Strategy vault / Trend following
10EMA Double Cross Trend Tracking Strategy
This strategy is a trend tracking strategy based on the double cross of 10EMA and 50EMA. It incorporates the 10EMA on the hourly chart as an auxiliary judgement to dynamically find the trend direction in the…
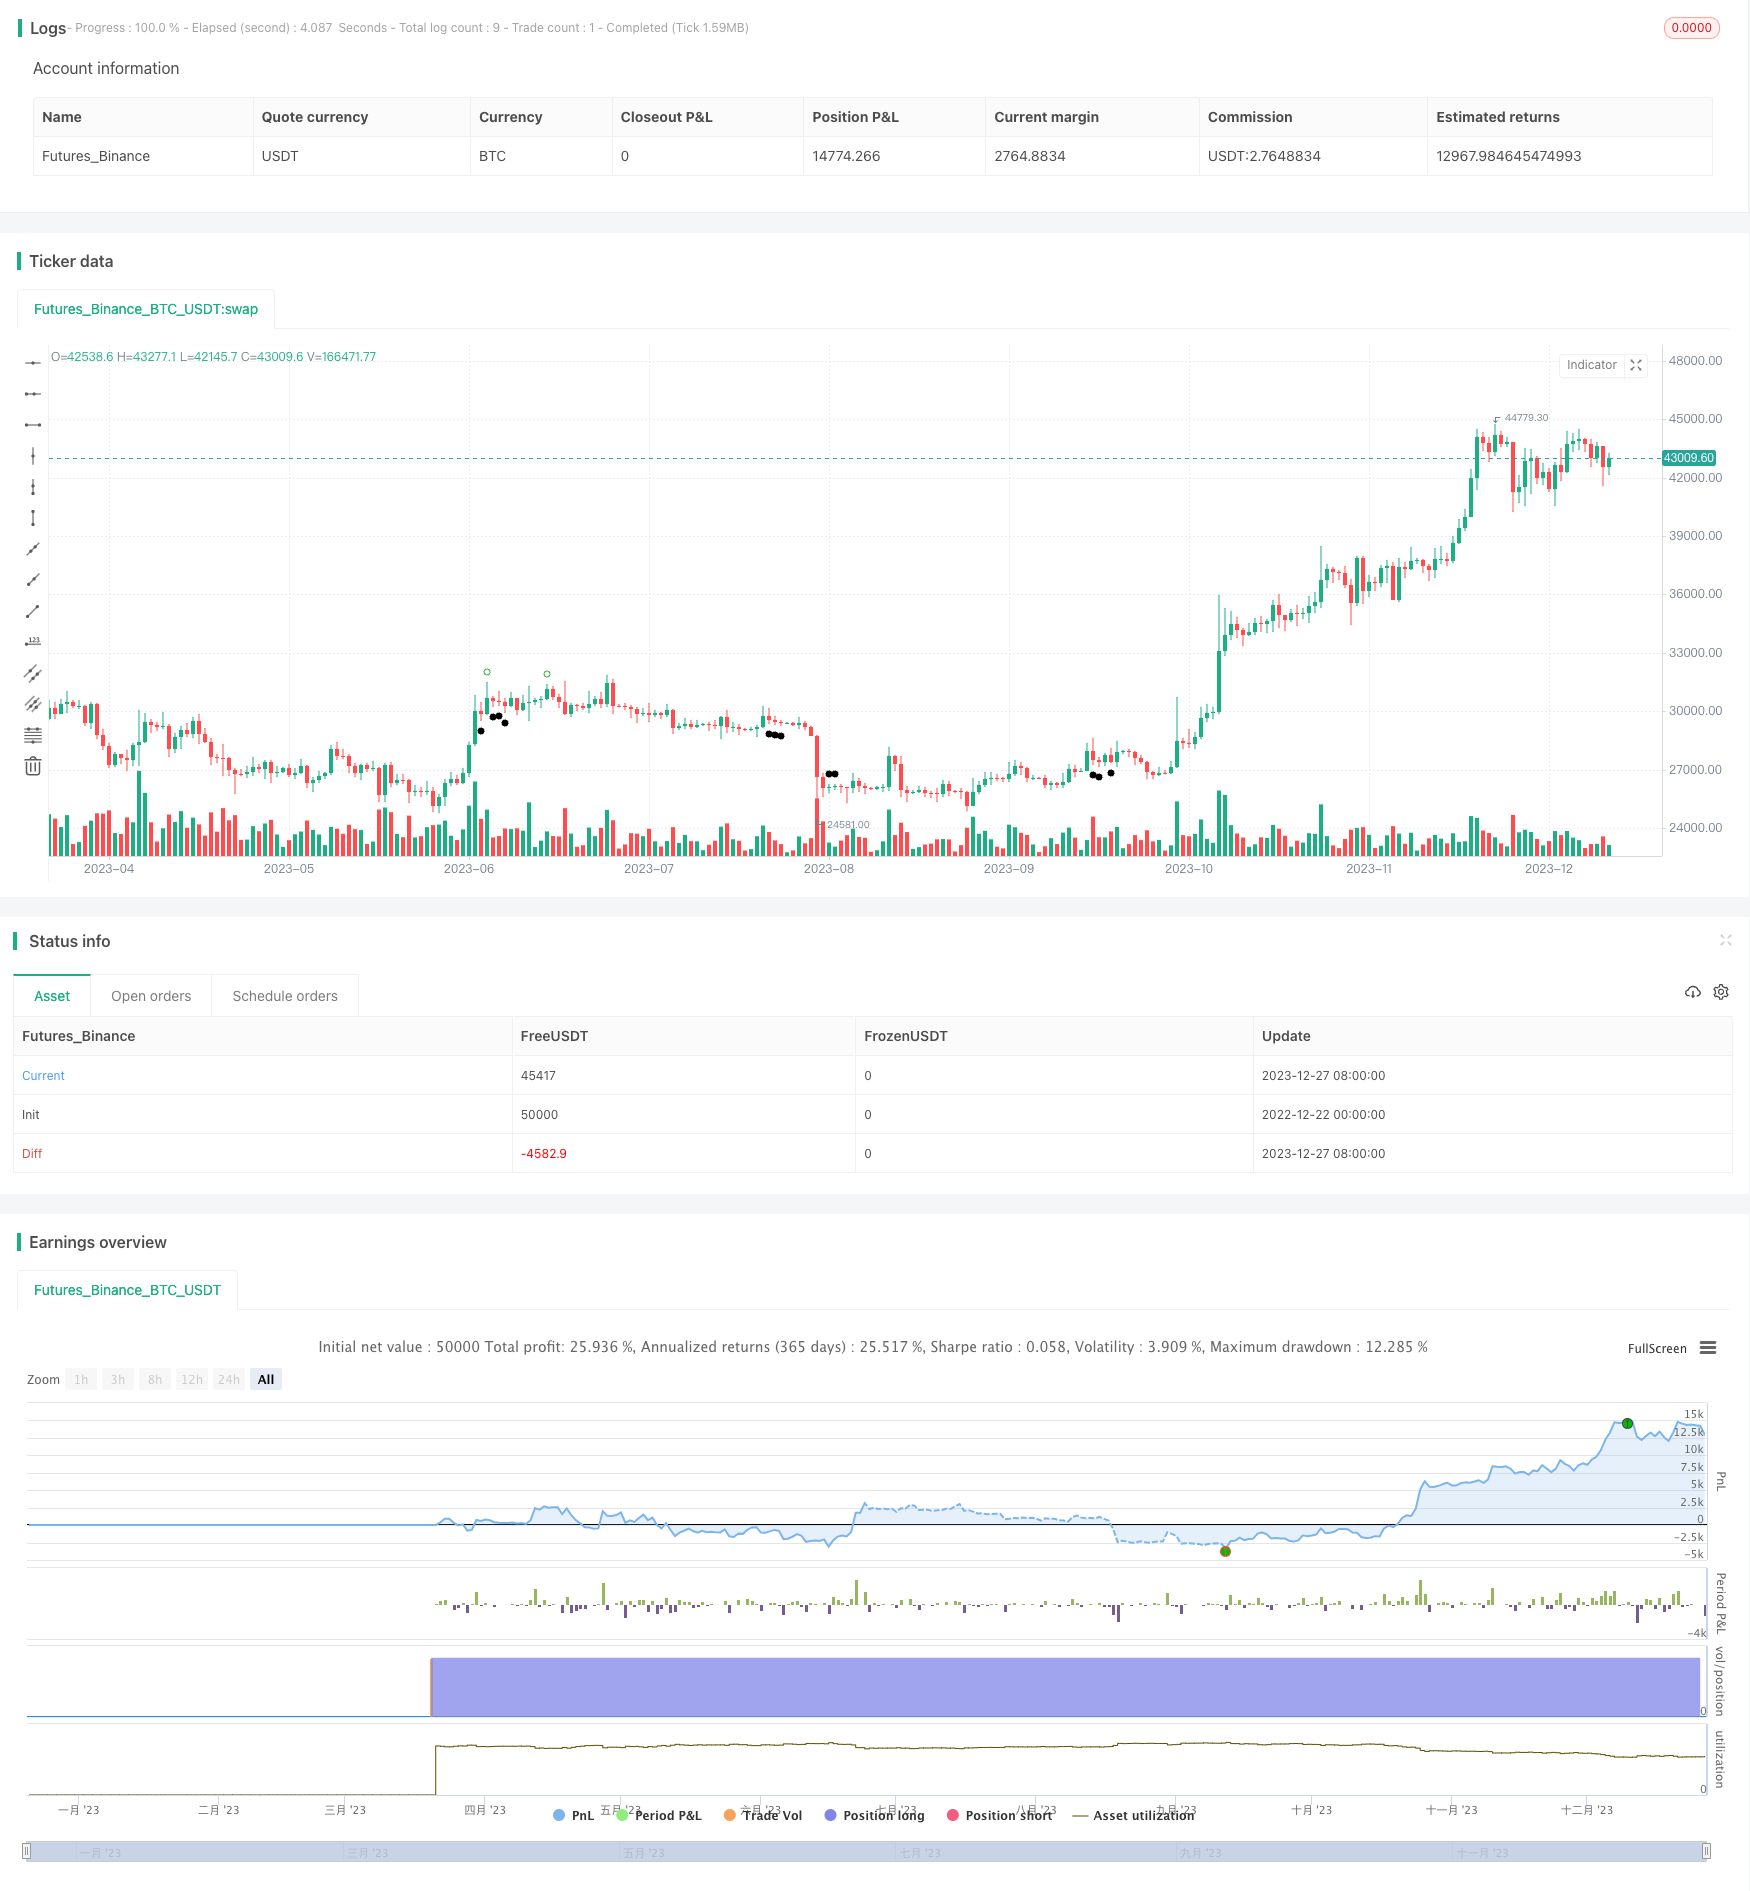
Overview
This strategy is a trend tracking strategy based on the double cross of 10EMA and 50EMA. It incorporates the 10EMA on the hourly chart as an auxiliary judgement to dynamically find the trend direction in the alternating bull and bear market, and achieve automatic tracking stop loss.
Strategy Principle
The core logic of the strategy is based on the golden cross and death cross of 10EMA and 50EMA. Specifically, when the 10EMA crosses above the 50EMA to form a golden cross, it is judged that the market has entered an uptrend; when the 10EMA crosses below the 50EMA to form a death cross, it is judged that the market has entered a downtrend.
Open long or short positions within 1-5 bars after the golden cross or death cross. In addition, the strategy also introduces the 10EMA on the hourly chart as an auxiliary judgment. Long positions are opened only when the 10EMA on the hourly chart is in an upward trend after the golden cross, and short positions are opened only when the 10EMA on the hourly chart is in a downward trend after the death cross, thus filtering out some false signals.
After opening positions, the strategy adopts a profit-taking and stop loss method of tracking stop loss + limit order. Tracking stop loss can lock in profits and maximize profitability of transactions; limit orders ensure that positions are closed when prices reach the target to obtain profits.
Advantage Analysis
The biggest advantage of this strategy is that while using EMA crosses to judge the main trend direction, it also introduces auxiliary indicators to filter signals, which can effectively filter false crosses to improve signal reliability. In addition, the double EMA cross combined with trailing stop loss and limit profit taking can both maximize tracking trend gains and effectively control trading risks with good overall risk-reward ratio.
Compared with single indicator strategies, this strategy can more accurately judge trend direction and amplitudes. Compared with traditional stop loss, this strategy adopts more advanced tracking stop loss technology to better lock in profits.
Risk Analysis
The main risks this strategy faces are intermittent whipsaws and trend reversals. When consecutive false crossing signals occur, the strategy may be scraped. In addition, price reversals after opening positions can also lead to losses.
To reduce the risk of whipsaws, auxiliary indicators are added to filter the signals. To control the risk of trend reversal, a relatively tolerant stop loss range is adopted, and the limit profit setting also helps reduce this risk. When the stop loss is triggered, it is also possible to consider re-entering the trend direction.
Optimization Directions
There are several optimization directions for this strategy: first, different parameter combinations such as EMA periods and position delay bars can be tested to find the optimal parameters; secondly, more auxiliary indicators such as MACD and BOLL can be introduced for signal filtering to improve signal quality; thirdly, stop loss and take profit logic can be optimized, such as adopting other stop loss methods like time stop loss and oscillating stop loss; fourthly, more market conditions can be combined to trigger strategy trading signals, such as only triggering signals during certain time periods or fluctuation ranges.
Summary
This 10EMA double cross trend tracking strategy judges the current trend direction through EMA golden crosses and death crosses, sets up tracking stop loss and limit profit taking to lock in profits and control risks, while combining auxiliary indicators to filter signals and improve signal quality. Compared with single indicator and traditional stop loss strategies, this strategy has advantages like accurate judgement, optimized stop profit mechanism, etc. It can effectively capture trend gains while controlling risks, making it suitable for conventional trading accounts. Of course there is still room for improvement for this strategy, such as further enhancing strategy performance through parameter optimization and introducing more auxiliary indicators.
Parameters
| Name | Default | What it controls |
|---|---|---|
| v_input_int_1 | 10 | short ema |
| v_input_int_2 | 50 | long ema |
| v_input_int_3 | 200 | hourly 10 ema |
| v_input_1_close | 0 | Source: close | high | low | open | hl2 | hlc3 | hlcc4 | ohlc4 |
| v_input_int_4 | false | Offset |
Source Pine Script
/*backtest
start: 2022-12-22 00:00:00
end: 2023-12-28 00:00:00
period: 1d
basePeriod: 1h
exchanges: [{"eid":"Futures_Binance","currency":"BTC_USDT"}]
*/

//@version=5
strategy("10ema Strat 9", overlay=true, format=format.price)
//#region // inputs for candles
//time
t1 = time(timeframe.period,"0930-1500") //last hour of market is not ideal for trading
// candle status
bullish = close > open and barstate.isconfirmed
bearish = open > close and barstate.isconfirmed
bullcandle = ta.valuewhen(bullish, close, 0)
bearcandle = ta.valuewhen(bearish, close, 0)
ema1 = input.int(10, minval=1, title="short ema")
ema2 = input.int(50, minval=1, title="long ema")
ema3 = input.int(200, minval=1, title="hourly 10 ema")
//@variable Input for source
src = input(close, title="Source")
offsetema = input.int(title="Offset", defval=0, minval=-500, maxval=500)
sema = ta.ema(src, ema1)//@variable Input for smaller ema1
lema = ta.ema(src, ema2)//@variable Input for longer ema2
hema = ta.ema(src, ema3)// @variable Input for hourly ema3
bullcrosscount = ta.barssince(ta.crossover(sema,lema)) //@variable Input 10/50 cross higher
bearcrosscount = ta.barssince(ta.crossunder(sema,lema)) //@variable Input 10/50 cross lower
ideallong = bullcrosscount <= 5 //number of candles after the cross
idealshort = bearcrosscount <= 5 //number of candles after the cross

emabull = (sema > lema) and bearish and close > sema and close > hema and ideallong and t1 and barstate.isconfirmed
xemabull = ta.barssince(emabull)
dbullema = emabull and emabull[1] and xemabull <=1
bullentry = if dbullema
    ta.valuewhen(emabull[1], high + 0.05, 0)
else
    ta.valuewhen(emabull, high + 0.05, 0)
bullentryh = dbullema ? bullentry[1] : bullentry
bullentrylow = ta.valuewhen(emabull, low - 0.05, 0)
bullstop = (bullentryh - bullentrylow) <= 1.00 ? bullentryh - 1.00 : (bullentryh - bullentrylow) <= 10.40 ? bullentrylow : na
bulltarget = (bullentryh - bullstop) * 1.62 + bullentryh

// bear setup
emabear = (sema < lema) and bullish and close < sema and close < hema and idealshort and t1 and barstate.isconfirmed
xemabear = ta.barssince(emabear)
dbearema = emabear and emabear [1] and xemabear <=1
bearentry = if dbearema
    ta.valuewhen(emabear[1], low - 0.05, 0)
else
    ta.valuewhen(emabear, low - 0.05, 0)
bearentryh = dbearema ? bearentry[1] : bearentry
bearentryhigh = ta.valuewhen(emabear, high + 0.05, 0)
bearstop = (bearentryhigh - bearentryh) <= 1.00 ? bearentryh + 1.00 : (bearentryh - bearentryhigh) <= 10.40 ? bearentryhigh : na
beartarget = bearentryh - (bearstop-bearentryh) * 1.62

bullclose = (xemabull <=7) and bullish and bullcrosscount >=1 and barstate.isconfirmed //number of candles for a close above
bearclose = (xemabear <=7) and bearish and bearcrosscount >=1 and barstate.isconfirmed //number of candles for a close below
buyzone = ta.barssince(bullclose)
shortzone =  ta.barssince(bearclose)
idealbuy = close >= bullentryh and bullclose and (buyzone<=7)
idealsell = close <= bearentryh and bearclose and (shortzone<=7)

// // bull setup on chart
// if sema > lema and xemabull < 50
//     var line line_bullentry = line.new(bar_index, na, bar_index + 1, na, color=color.rgb(0, 200, 0), style=line.style_solid, width=1)
//     if emabull
//         line.set_xy1(line_bullentry, x=bar_index, y=bullentryh)
//         line.set_xy2(line_bullentry, x=bar_index, y=bullentryh)
//         alert("EMA-bullish", alert.freq_once_per_bar_close)
//     line.set_x2(line_bullentry, x=bar_index)
//     var line line_bullstop = line.new(bar_index, na, bar_index + 1, na, color=color.rgb(250, 0, 0), style=line.style_solid, width=1)
//     if emabull
//         line.set_xy1(line_bullstop, x=bar_index, y=bullstop)
//         line.set_xy2(line_bullstop, x=bar_index, y=bullstop)
//     line.set_x2(line_bullstop, x=bar_index)
//     var line line_bulltarget = line.new(bar_index, na, bar_index + 1, na, color=color.rgb(200, 100, 200), style=line.style_solid, width=1)
//     if emabull
//         line.set_xy1(line_bulltarget, x=bar_index, y=bulltarget)
//         line.set_xy2(line_bulltarget, x=bar_index, y=bulltarget)
//     line.set_x2(line_bulltarget, x=bar_index)

// //bear setup on chart
// if sema < lema and xemabear < 50
//     var line line_bearentry = line.new(bar_index, na, bar_index, na, color=color.rgb(0, 200, 0), style=line.style_solid, width=1)
//     if emabear
//         line.set_xy1(line_bearentry, x=bar_index, y=bearentryh)
//         line.set_xy2(line_bearentry, x=bar_index, y=bearentryh)
//         alert("EMA-bearish", alert.freq_once_per_bar_close)
//     line.set_x2(line_bearentry, x=bar_index)
//     var line line_bearstop = line.new(bar_index, na, bar_index, na, color=color.rgb(250, 0, 0), style=line.style_solid, width=1)
//     if emabear
//         line.set_xy1(line_bearstop, x=bar_index, y=bearstop)
//         line.set_xy2(line_bearstop, x=bar_index, y=bearstop)
//     line.set_x2(line_bearstop, x=bar_index)
//     var line line_beartarget = line.new(bar_index, na, bar_index, na, color=color.rgb(200, 100, 200), style=line.style_solid, width=1)
//     if emabear
//         line.set_xy1(line_beartarget, x=bar_index, y=beartarget)
//         line.set_xy2(line_beartarget, x=bar_index, y=beartarget)
//     line.set_x2(line_beartarget, x=bar_index)

//#endregion
//execution
if idealbuy
    strategy.close("sell", comment=na)
    strategy.entry("buy", strategy.long, limit=bullentryh, stop=bullstop, comment="buy")
strategy.exit("exit","buy", trail_points = low, trail_offset = 5, qty_percent=100, limit=bulltarget, stop=bullstop)

if idealsell
	strategy.close("buy",comment=na)
    strategy.entry("sell", strategy.short, limit=bearentryh, stop=bearstop, comment="sell")
strategy.exit("exit","sell", trail_points = low, trail_offset = 5, qty_percent=100, limit=beartarget, stop=bearstop)
// strategy.close_all(time == close_day)
//#region // graphical analysis
//Plots
plotshape(emabull, location=location.belowbar, title='emabull')
plotshape(idealbuy, style=shape.circle, color=color.green, title="bull close")
plotshape(emabear, title='emabear')
plotshape(idealsell, location=location.belowbar, style=shape.circle, color=color.red, title="bear close")

// //Dashboard
// var label id = na
// label.delete(id)   // Delete last label
// i_offsetLabel = input(15, "Data Dashboard Offset")
// offset = i_offsetLabel * (time - time[1])
// dynamicText = "= Bull Setup ="
// id := label.new(x=time + offset, y=open, xloc=xloc.bar_time, text=dynamicText, color=color.rgb(255, 255, 255), size=size.normal)
// label.set_textcolor(id, color.rgb(0, 0, 0))
// label.set_text(id=id, text=dynamicText)
// label.set_textalign(id, text.align_left)
// label.set_text(id=id, text=dynamicText)
// f_round( _val, _decimals) =>
//     _p = math.pow(10, _decimals)
//     math.round(math.abs(_val) * _p) / _p * math.sign(_val)
// dynamicText := dynamicText + "\n" + str.tostring(f_round(bulltarget,2)) + "  :Target"
// label.set_text(id=id, text=dynamicText)
// dynamicText := dynamicText + "\n" + str.tostring(f_round(bullentryh,2)) + "  :Entry"
// label.set_text(id=id, text=dynamicText)
// dynamicText := dynamicText + "\n" + str.tostring(f_round(bullstop,2)) + "  :Stop"
// label.set_text(id=id, text=dynamicText)
// dynamicText := dynamicText + "\n"
// label.set_text(id=id, text=dynamicText)
// dynamicText := dynamicText + "\n" + "= Bear Setup ="
// label.set_text(id=id, text=dynamicText)
// dynamicText := dynamicText + "\n" + str.tostring(f_round(bearstop,2)) + "  :Stop"
// label.set_text(id=id, text=dynamicText)
// dynamicText := dynamicText + "\n" + str.tostring(f_round(bearentryh,2)) + "  :Entry"
// label.set_text(id=id, text=dynamicText)
// dynamicText := dynamicText + "\n" + str.tostring(f_round(beartarget,2)) + "  :Target"
// label.set_text(id=id, text=dynamicText)
// //#endregionPublished by ChaoZhang on the FMZ strategy square · last modified 2023-12-29. Collected in the Quant Trading Vault. Unvalidated research: re-test with your own data and costs before trusting it.
Build this with AgenKit
A spec is not a trading system. Paste this into your coding agent and AgenKit runs a specialist team — architecture, test-first build, risk gates, review — with paper trading on by default.
/agenkit build a production-grade trading bot with a backtest engine, risk controls and paper trading by default from strategies/10EMA-Double-Cross-Trend-Tracking-Strategy.md- npx agenkit install engineering-kit in your project
- Paste the command into your agent and approve each phase
- Get tests, backtest, risk controls and a paper-trading switch
Understand it first
Before you run this, read the lesson behind the idea and how to backtest it honestly. Specs like this one are the survivors of an unknown number of trials; deflate their results accordingly.
Related specs
- 200 EMA VWAP MFI Trend Following StrategyPine Script · Trend following · 1d
- 4 EMA Trend StrategyPine Script · Trend following · 1d
- ADX MA and EMA Long Only Trend Tracking StrategyPine Script · Trend following · 1d
- ATR Dynamic Trend Following and EMA Crossover Trading StrategyPine Script · Trend following · 1d
- ATR and Moving Average Crossover Hybrid StrategyPine Script · Trend following · 1h
- ATR and T3 Moving Average StrategyPine Script · Trend following · 5m