Strategy vault / Trend following
200 EMA VWAP MFI Trend Following Strategy
This strategy combines the 200-day Exponential Moving Average (200 EMA), Volume Weighted Average Price (VWAP), and Money Flow Index (MFI) to generate buy and sell signals. The main idea is to use the combination of…
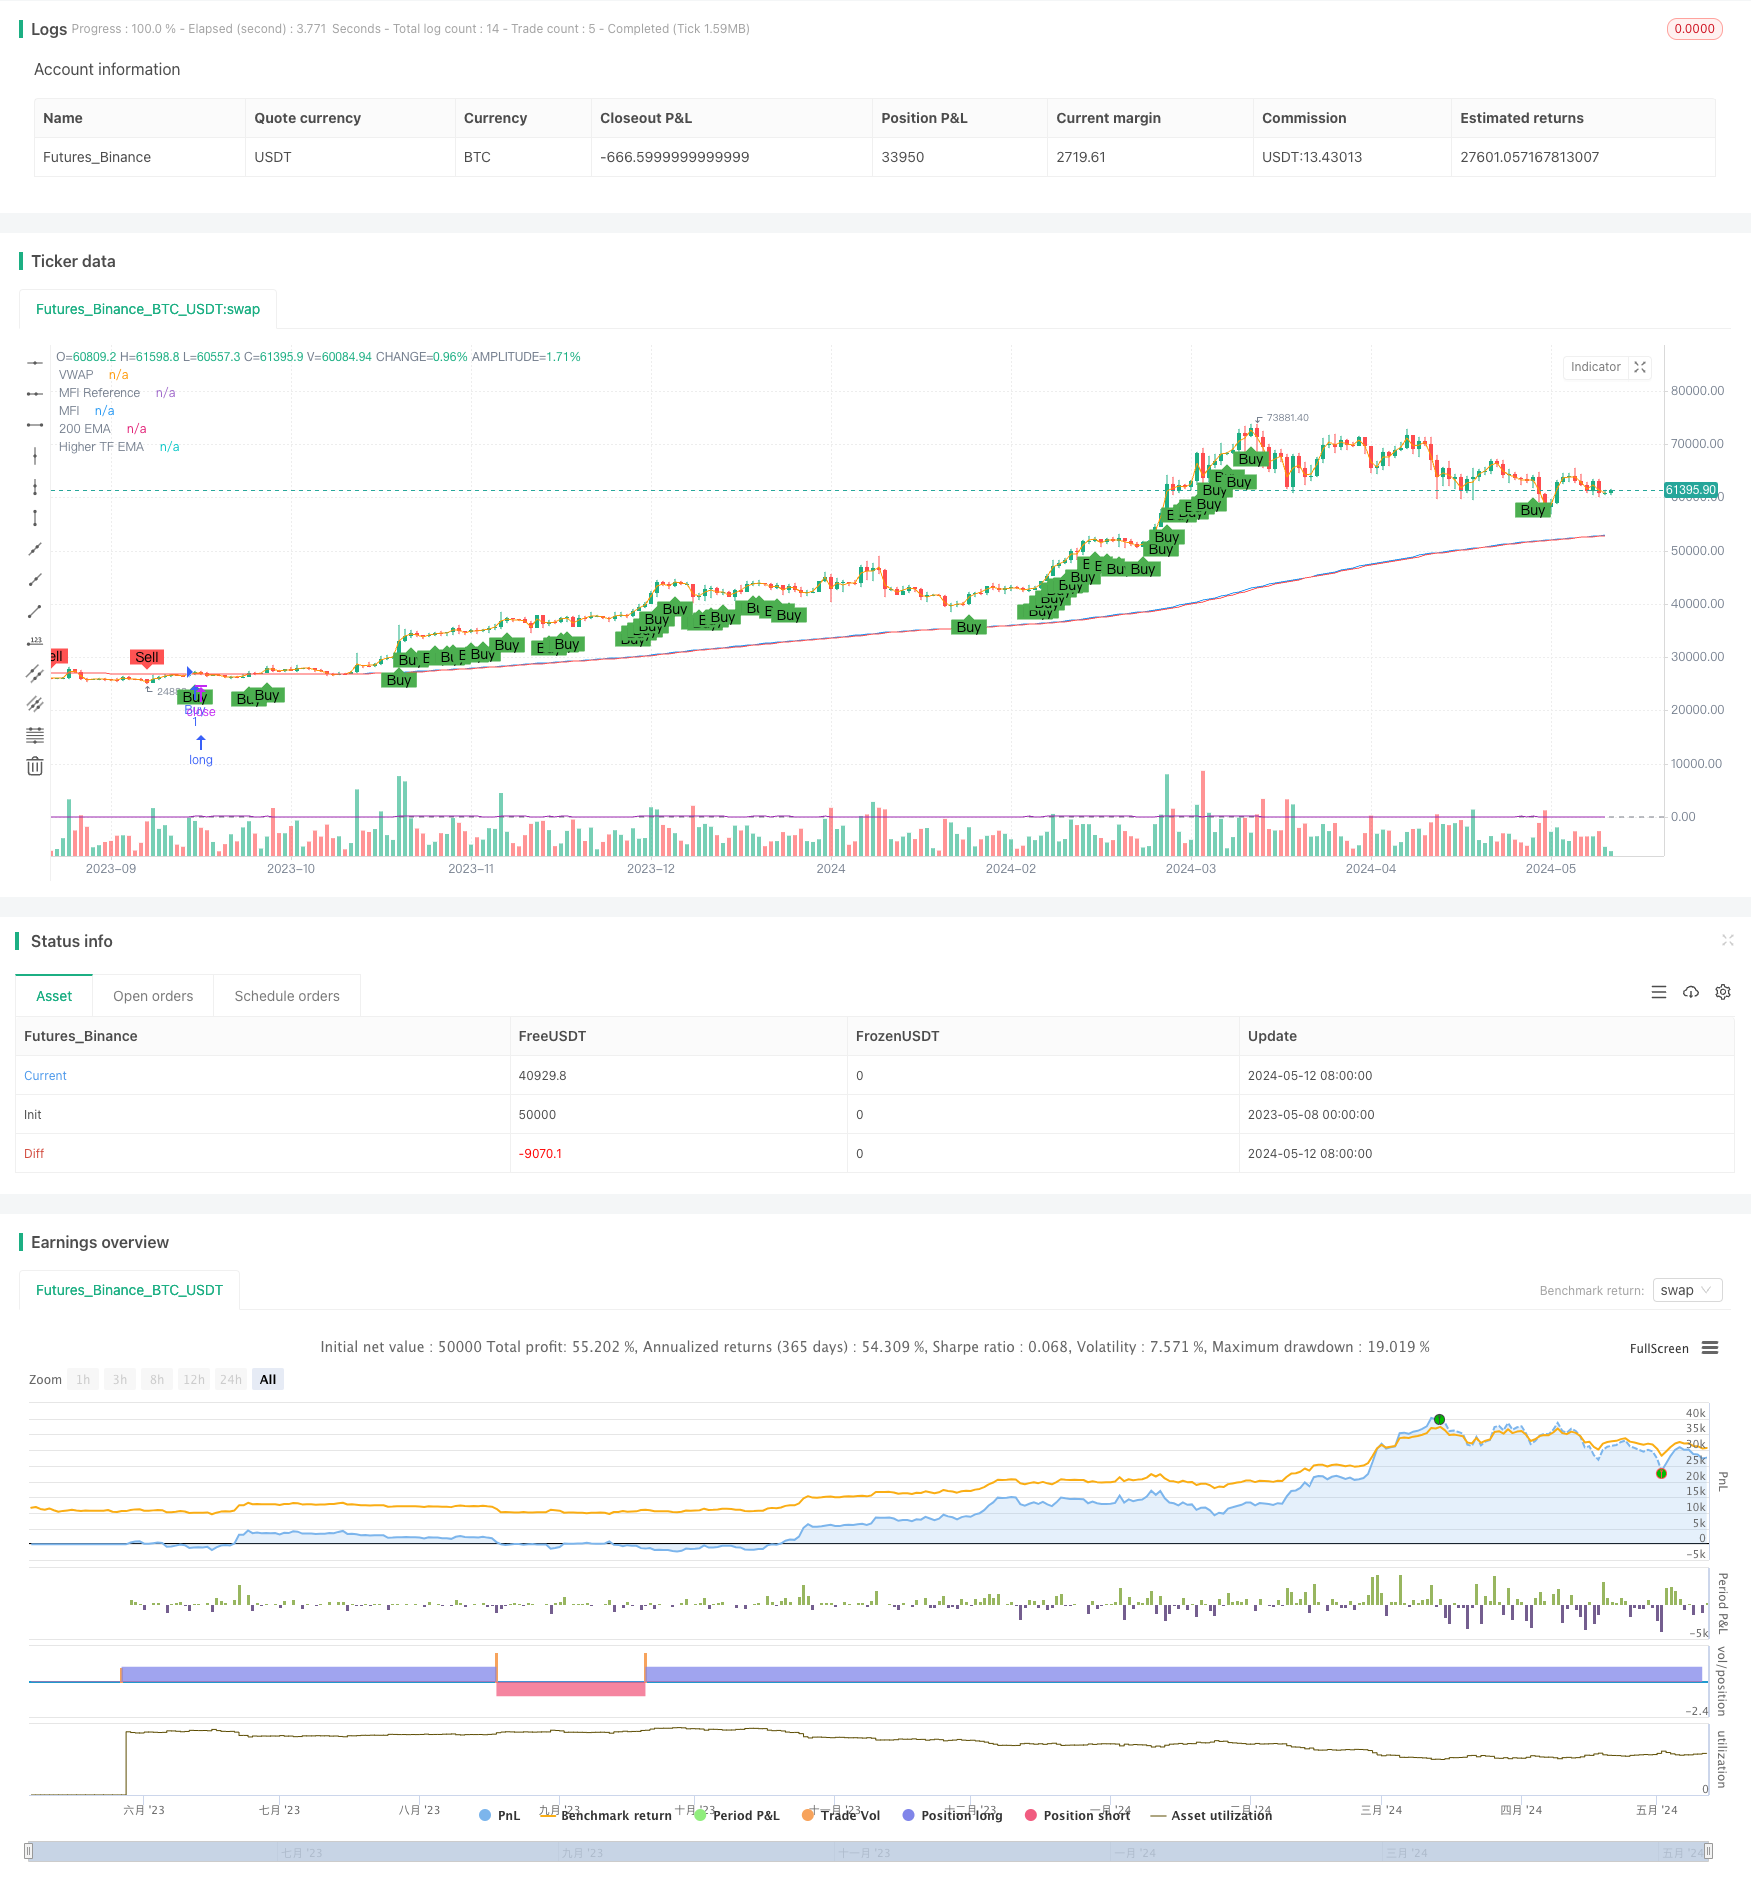
Overview
This strategy combines the 200-day Exponential Moving Average (200 EMA), Volume Weighted Average Price (VWAP), and Money Flow Index (MFI) to generate buy and sell signals. The main idea is to use the combination of these three indicators to determine the trend direction and strength, and generate trading signals when the price breaks through the 200 EMA and is confirmed by the VWAP and MFI indicators. Additionally, a 200 EMA from a higher timeframe is introduced as a trend filter, and trades are only executed when the trends on the current and higher timeframes align. Furthermore, the continuity of price movements is assessed to improve the reliability of signals.
Strategy Principles
- Calculate the 200-day EMA and the upper and lower buffer zones based on the input buffer percentage.
- Calculate the VWAP indicator.
- Calculate the 14-period MFI indicator and set the buy and sell thresholds.
- Obtain the 200 EMA from a higher timeframe as a trend filter.
- Determine the continuity of price movements by checking if the conditions for continuous uptrend or downtrend are met.
- Combine the above conditions to generate buy signals when the closing price breaks above the 200 EMA upper buffer and is above the VWAP, the MFI is greater than the buy threshold, the closing price is above the 200 EMA of the higher timeframe, and the price movement is continuously rising.
- Sell signals are generated when the closing price breaks below the 200 EMA lower buffer and is below the VWAP, the MFI is less than the sell threshold, the closing price is below the 200 EMA of the higher timeframe, and the price movement is continuously falling.
- When buy or sell conditions are met, the strategy executes corresponding long or short trades.
Strategy Advantages
- Combines multiple indicators for comprehensive analysis, effectively filters false signals, and improves signal reliability.
- Introduces trend filtering from a higher timeframe, aligning trading decisions with the larger trend and reducing the risk of counter-trend trading.
- Further confirms trend strength by assessing the continuity of price movements, improving the accuracy of entry timing.
- Uses the concept of buffer zones, allowing prices to fluctuate within a certain range and avoiding frequent trading.
- Adjustable parameters provide high flexibility, allowing optimization based on different markets and trading styles.
Strategy Risks
- In choppy markets or at trend turning points, indicators may generate false signals, leading to losses.
- Improper parameter settings may result in poor strategy performance. For example, an overly large buffer zone may miss trading opportunities, while an overly small one may lead to frequent trading.
- The strategy relies on historical data for calculations and judgments, and may not react promptly to sudden events or black swan events.
- In certain special market conditions, such as extremely prolonged trends or violent fluctuations, the strategy may fail.
Strategy Optimization Directions
- For parameter optimization, backtesting on historical data can be conducted to find the best combination of parameters, such as EMA period, MFI period and thresholds, and buffer zone size.
- Consider introducing other auxiliary indicators or market sentiment indicators, such as Bollinger Bands or RSI, to further improve signal reliability and robustness.
- In terms of trade management, introduce stop-loss and take-profit mechanisms, such as trailing stops or dynamic stops based on ATR, to control single-trade risk.
- Explore different position sizing strategies, such as risk-based position sizing or the Kelly Criterion, to optimize the risk-reward ratio of the strategy.
- Consider introducing machine learning or adaptive algorithms to dynamically adjust strategy parameters to adapt to market changes.
Summary
By combining the 200-day EMA, VWAP, and MFI indicators, while considering trends in higher timeframes and the continuity of price movements, this strategy constructs a relatively robust trend-following trading system. The strategy filters false signals by comprehensively analyzing multiple conditions, improving the accuracy of entry timing. At the same time, the flexibility of strategy parameters allows for optimization based on different markets and trading styles. However, the strategy also involves certain risks, such as potential losses in choppy markets or at trend turning points, and poor performance due to improper parameter settings. In the future, the strategy can be further optimized and improved in terms of parameter optimization, introducing auxiliary indicators, risk management, and other aspects. Overall, this strategy provides a comprehensive and feasible framework for trend-following trading.
Source Pine Script
/*backtest
start: 2023-05-08 00:00:00
end: 2024-05-13 00:00:00
period: 1d
basePeriod: 1h
exchanges: [{"eid":"Futures_Binance","currency":"BTC_USDT"}]
*/

//@version=5
strategy("200 EMA, VWAP, MFI Strategy - Visible Signals", overlay=true, pyramiding=0)

// Inputs for dynamic adjustments
buffer = input.float(0.2, title="EMA Buffer Percentage", step=0.1) / 100
higherTimeframe = input.timeframe("15", title="Higher Timeframe")
mfiBuyThreshold = input(60, title="MFI Buy Threshold")
mfiSellThreshold = input(40, title="MFI Sell Threshold")
consecutiveCloses = input.int(1, title="Consecutive Closes for Confirmation")

// Calculate the 200-period EMA
ema200 = ta.ema(close, 200)
emaBufferedHigh = ema200 * (1 + buffer)
emaBufferedLow = ema200 * (1 - buffer)
emaHigher = request.security(syminfo.tickerid, higherTimeframe, ta.ema(close, 200))

// VWAP calculation
vwap = ta.vwap(hlc3)

// Money Flow Index calculation
mfiLength = 14
mfi = ta.mfi(close, mfiLength)

// Plotting the indicators
plot(ema200, title="200 EMA", color=color.blue)
plot(vwap, title="VWAP", color=color.orange)
plot(mfi, title="MFI", color=color.purple)
hline(50, "MFI Reference", color=color.gray, linestyle=hline.style_dashed)
plot(emaHigher, title="Higher TF EMA", color=color.red)

// Price action confirmation
isUpTrend = ta.rising(close, consecutiveCloses)
isDownTrend = ta.falling(close, consecutiveCloses)

// Define entry conditions
longCondition = close > emaBufferedHigh and close > vwap and mfi > mfiBuyThreshold and close > emaHigher and isUpTrend
shortCondition = close < emaBufferedLow and close < vwap and mfi < mfiSellThreshold and close < emaHigher and isDownTrend

// Trading execution
if (longCondition)
    strategy.entry("Buy", strategy.long)

if (shortCondition)
    strategy.entry("Sell", strategy.short)

// Plot shapes for signals
plotshape(series=longCondition, location=location.belowbar, color=color.green, style=shape.labelup, size=size.small, title="Buy Signal", text="Buy")
plotshape(series=shortCondition, location=location.abovebar, color=color.red, style=shape.labeldown, size=size.small, title="Sell Signal", text="Sell")
Published by ChaoZhang on the FMZ strategy square · last modified 2024-05-14. Collected in the Quant Trading Vault. Unvalidated research: re-test with your own data and costs before trusting it.
Build this with AgenKit
A spec is not a trading system. Paste this into your coding agent and AgenKit runs a specialist team — architecture, test-first build, risk gates, review — with paper trading on by default.
/agenkit build a production-grade trading bot with a backtest engine, risk controls and paper trading by default from strategies/200-EMA-VWAP-MFI-Trend-Following-Strategy.md- npx agenkit install engineering-kit in your project
- Paste the command into your agent and approve each phase
- Get tests, backtest, risk controls and a paper-trading switch
Understand it first
Before you run this, read the lesson behind the idea and how to backtest it honestly. Specs like this one are the survivors of an unknown number of trials; deflate their results accordingly.
Related specs
- Fixed Range Volume Profile And Anchored VWAP Trend Identification Strategy With Dynamic Stop LossPine Script · Trend following · 1h
- JBravo Quantitative Trend StrategyPine Script · Trend following · 1d
- Multi Period EMA Crossover with VWAP High Win Rate Intraday Trading StrategyPine Script · Trend following · 1d
- Multi Trend StrategyPine Script · Trend following · 1m
- Simple Moving Average Crossover with Stop Loss StrategyPine Script · Trend following · 2h
- Trend Following Strategy Based on Moving Average 439858Pine Script · Trend following · 1d