Strategy vault / Mean reversion
3 Moving Average Swing Interval Reversal Strategy
This strategy uses a 3-day fast moving average, 10-day slow moving average and 16-day signal smoothing moving average to construct the MACD indicator, supplemented by the RSI indicator and volume characteristics, and…
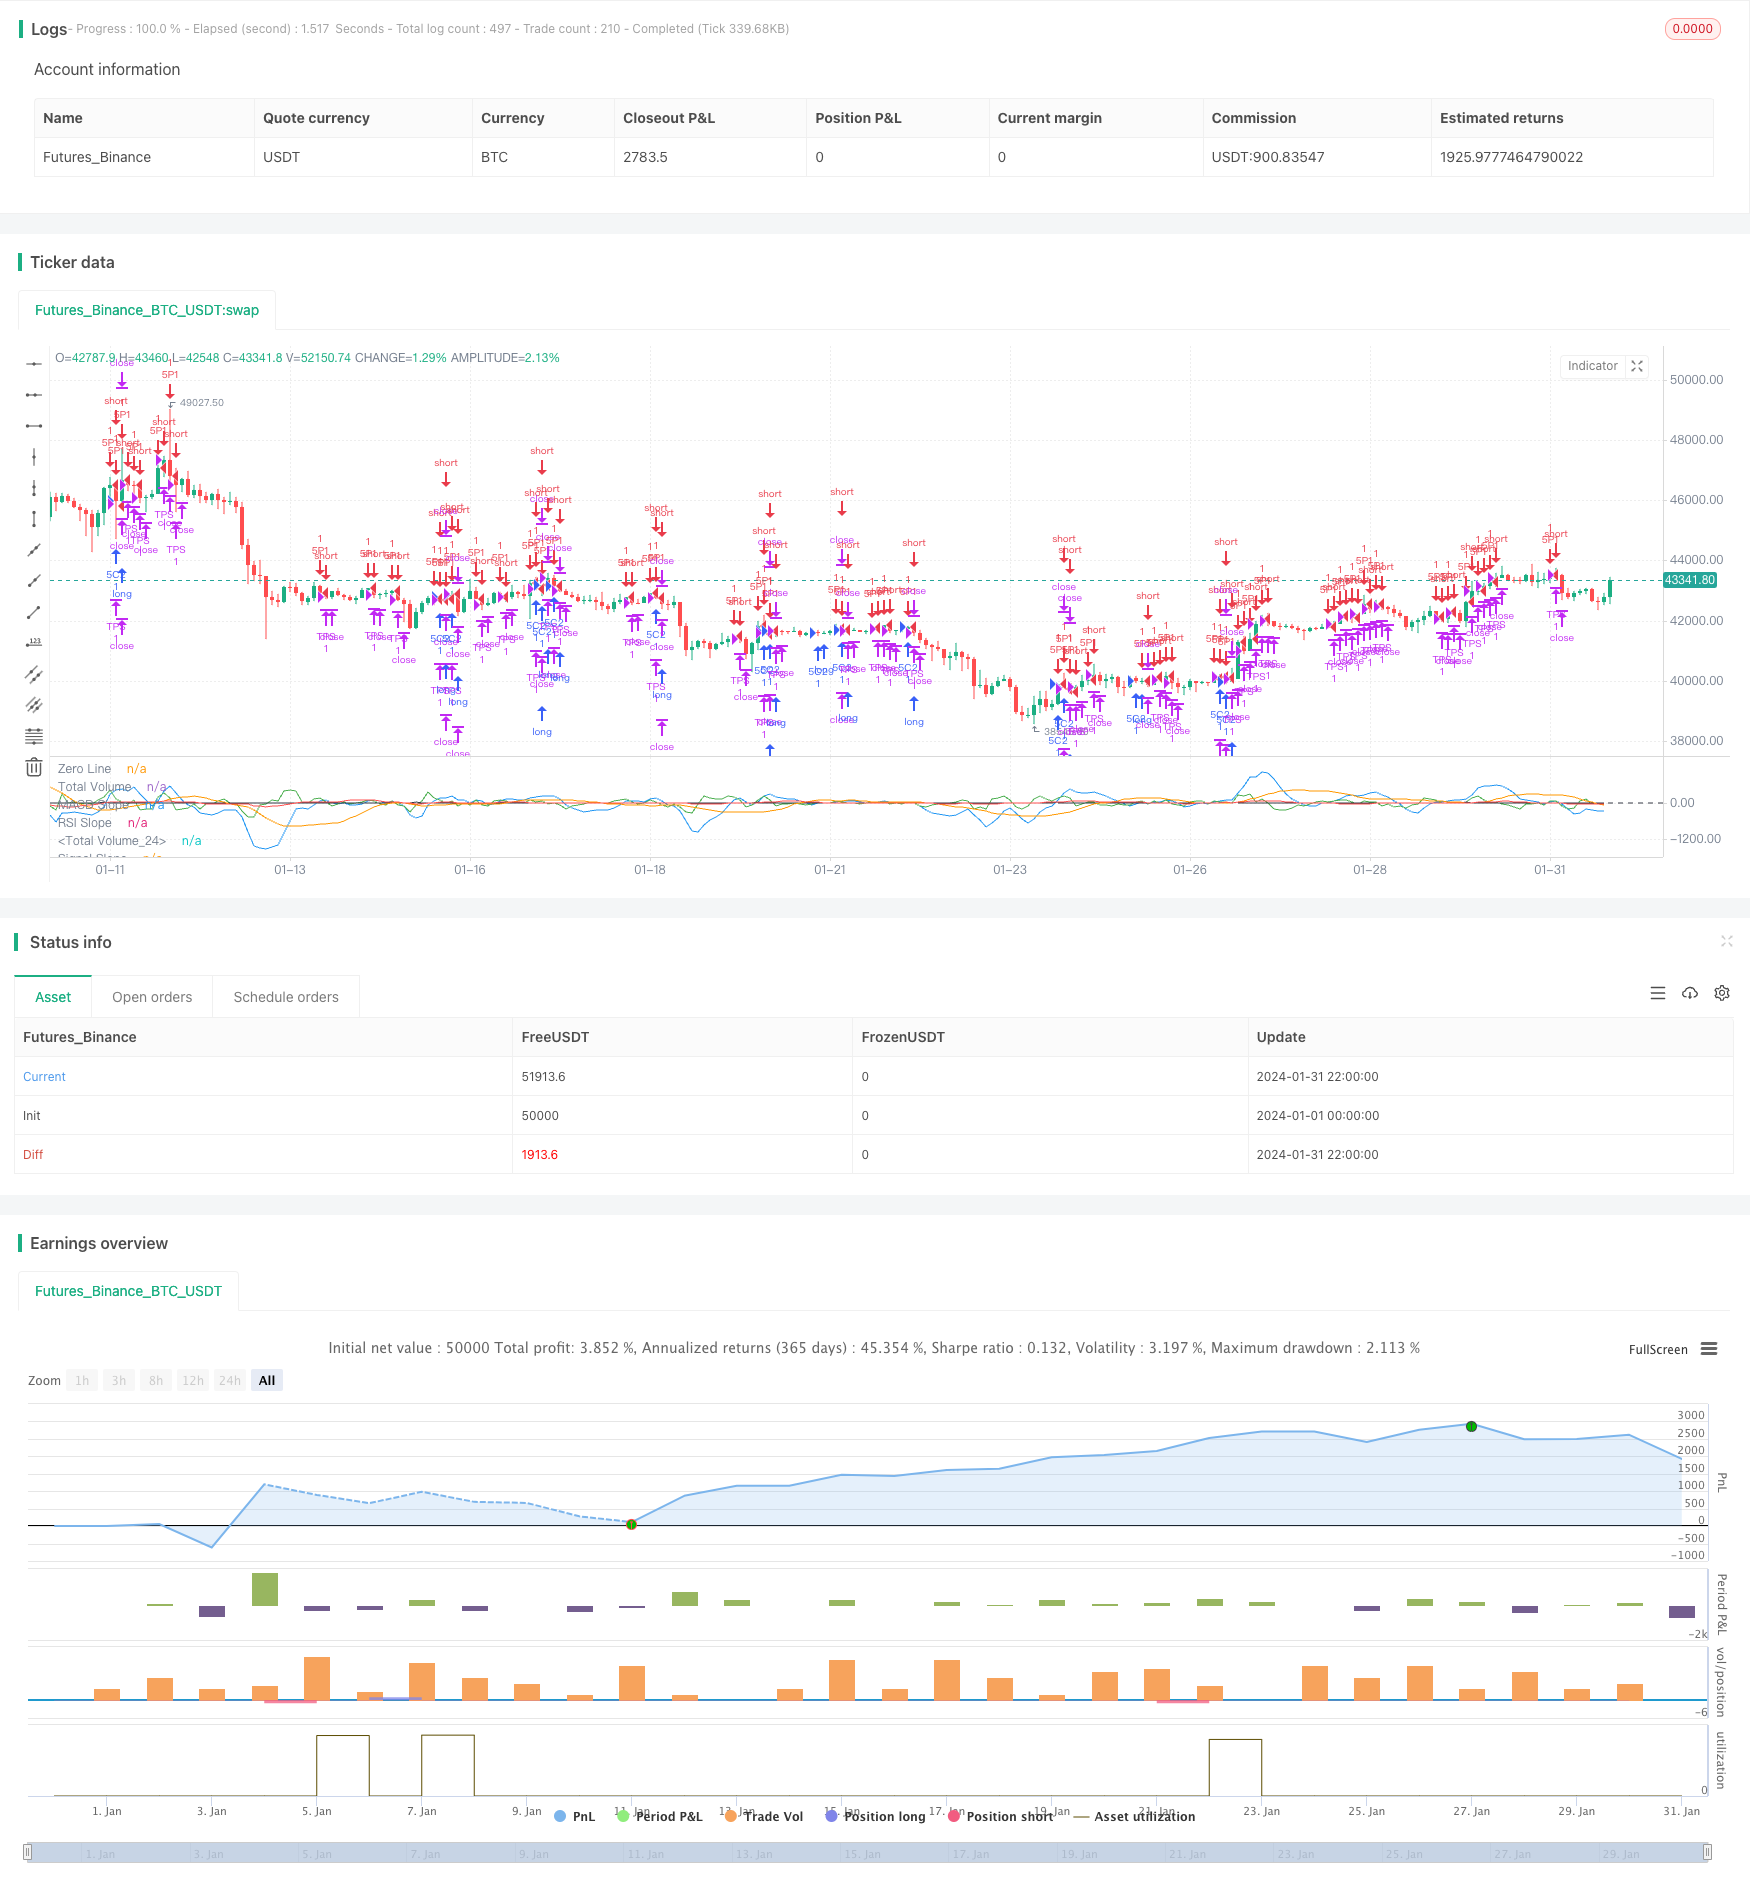
Overview
This strategy uses a 3-day fast moving average, 10-day slow moving average and 16-day signal smoothing moving average to construct the MACD indicator, supplemented by the RSI indicator and volume characteristics, and sets multidimensional K-line characteristics to determine over-extension of the market trend, forming a range swing trend and reversal long or short entries for profit taking.
The strategy aims to capture quick price reversals from local overbought or oversold levels. It typically performs well for 0DTE SPY Options using 15m timeframe.
Strategy Logic
The strategy mainly uses 3-day fast moving average minus 10-day slow moving average to form the MACD indicator, with 16-day signal line for smoothing, constituting a standard MACD strategy. It also combines volume analysis of buying and selling volumes to determine momentum characteristics. The RSI indicator is introduced to determine overbought or oversold levels. Through the combination of multiple indicators, it judges market characteristics and detects changes in interval swing trends to construct entry signals.
Specifically, by observing the relationship between the MACD line and signal line, as well as the slope changes, it determines the ebb and flow of bullish and bearish forces to spot reversal opportunities. At the same time, changes in buying and selling volumes reflect shifts in bullish and bearish momentum. Combined with the changes in the RSI indicator to determine overbought and oversold conditions, these indicators allow us to ascertain localized market profile features and potential reversal timing.
The strategy sets up 3 entry signals in total:
Long when buying volume has no advantage over selling volume, RSI below 41 while rising, MACD signal has no significant deviations;
Long when buying volume is stronger than selling volume, RSI in the 45-55 range and rising, MACD and signal line moving up in unison;
Short when MACD is above the threshold while rising.
These 3 scenarios all reflect localized ranging swings in a directional over-expansion, judged as opportune reversal timing for counter-direction entries.
Exits are set as Take profit (limit order) and Stop loss, to control drawdowns and realize profits.
Advantage Analysis
The strategy combines multiple indicators to determine ranging and overbought/oversold conditions, with a clear reversal profit-taking logic. It utilizes volume analysis for additional conviction on entries. The stop loss and take profit also helps avoid over-trading in one direction while securing profits early.
Specifically, advantages include:
MACD as volume-weighted momentum oscillator, avoids simplistic technical analysis;
Volume conditions add to entry conviction;
RSI assists in spotting potential reversals;
Stop loss and take profit controls excessive drawdowns and locks in some profit.
Risk Analysis
Despite combining indicators to improve win rate, all strategies have risks. Main issues are:
Probability of false signals, like continuations after initial reversal;
Inadequate stop loss and take profit settings lead to oversized drawdowns and failure to lock in profit;
Parameter tuning like MA lengths, RSI periods, take profit ratios may need further optimization.
These risks can be reduced through additional optimization. Specific methods are elaborated in next section.
Optimization Directions
There remains room for further optimization, mainly:
Test different MA parameter combinations for best results;
Test RSI lookback periods to find optimum overbought/oversold judge;
Optimize take profit and stop loss ratios to balance drawdowns and profit capture;
Introduce machine learning models, leverage more data to reduce misjudgements and improve win rate.
These can be implemented through more systematic backtests. As parameter spaces expand and sample sizes grow, strategy win rate and profitability will also improve.
Conclusion
This strategy combines MACD, RSI and volume analysis to determine market ranging features, establishing entries at reversal zones to capture retracement moves. The logic is clear, balancing trend and reversals. With further optimization, it has strong profit potential as a robust quant strategy. Parameter tuning and model introduction can enhance it into a highly efficient algorithm.
Parameters
| Name | Default | What it controls |
|---|---|---|
| v_input_1 | 0.26 | Signal Bias |
| v_input_2 | 0.7 | MACD Bias |
| v_input_3 | 3 | Short LookBack |
| v_input_4 | 6 | Long LookBack |
| v_input_5 | 2 | Take Profit |
| v_input_6 | 0.7 | Stop Loss |
Source Pine Script
/*backtest
start: 2024-01-01 00:00:00
end: 2024-01-31 23:59:59
period: 2h
basePeriod: 15m
exchanges: [{"eid":"Futures_Binance","currency":"BTC_USDT"}]
*/

//@version=5
strategy("3 1 Oscillator Profile Flagging", shorttitle="3 1 Oscillator Profile Flagging", overlay=false)

signalBiasValue = input(title="Signal Bias", defval=0.26)
macdBiasValue = input(title="MACD Bias", defval=0.7)
shortLookBack = input( title="Short LookBack", defval=3)
longLookBack = input( title="Long LookBack", defval=6)
takeProfit = input( title="Take Profit", defval=2)
stopLoss = input( title="Stop Loss", defval=0.7)

fast_ma = ta.sma(close, 3)
slow_ma = ta.sma(close, 10)
macd = fast_ma - slow_ma
signal = ta.sma(macd, 16)
hline(0, "Zero Line", color = color.black)

buyVolume = volume*((close-low)/(high-low))
sellVolume = volume*((high-close)/(high-low))
buyVolSlope = buyVolume - buyVolume[1]
sellVolSlope = sellVolume - sellVolume[1]
signalSlope = ( signal - signal[1] )
macdSlope = ( macd - macd[1] )
plot(macd, color=color.blue, title="Total Volume")
plot(signal, color=color.orange, title="Total Volume")
plot(macdSlope, color=color.green, title="MACD Slope")
plot(signalSlope, color=color.red, title="Signal Slope")
intrabarRange = high - low
rsi = ta.rsi(close, 14)
rsiSlope = rsi - rsi[1]
plot(rsiSlope, color=color.black, title="RSI Slope")

getRSISlopeChange(lookBack) =>
    j = 0
    for i = 0 to lookBack
        if ( rsi[i] - rsi[ i + 1 ] ) > -5
            j += 1
    j

getBuyerVolBias(lookBack) =>
    j = 0
    for i = 1 to lookBack
        if buyVolume[i] > sellVolume[i]
            j += 1
    j

getSellerVolBias(lookBack) =>
    j = 0
    for i = 1 to lookBack
        if sellVolume[i] > buyVolume[i]
            j += 1
    j

getVolBias(lookBack) =>
    float b = 0.0
    float s = 0.0
    for i = 1 to lookBack
        b += buyVolume[i]
        s += sellVolume[i]
    b > s

getSignalBuyerBias(lookBack) =>
    j = 0
    for i = 1 to lookBack
        if signal[i] > signalBiasValue
            j += 1
    j

getSignalSellerBias(lookBack) =>
    j = 0
    for i = 1 to lookBack
        if signal[i] < ( 0.0 - signalBiasValue )
            j += 1
    j

getSignalNoBias(lookBack) =>
    j = 0
    for i = 1 to lookBack
        if signal[i] < signalBiasValue and signal[i] > ( 0.0 - signalBiasValue )
            j += 1
    j

getPriceRising(lookBack) =>
    j = 0
    for i = 1 to lookBack
        if close[i] > close[i + 1]
            j += 1
    j


getPriceFalling(lookBack) =>
    j = 0
    for i = 1 to lookBack
        if close[i] < close[i + 1]
            j += 1
    j

getRangeNarrowing(lookBack) =>
    j = 0
    for i = 1 to lookBack
        if intrabarRange[i] < intrabarRange[i + 1]
            j+= 1
    j

getRangeBroadening(lookBack) =>
    j = 0
    for i = 1 to lookBack
        if intrabarRange[i] > intrabarRange[i + 1]
            j+= 1
    j

bool isNegativeSignalReversal = signalSlope < 0.0 and signalSlope[1] > 0.0
bool isNegativeMacdReversal = macdSlope < 0.0 and macdSlope[1] > 0.0

bool isPositiveSignalReversal = signalSlope > 0.0 and signalSlope[1] < 0.0
bool isPositiveMacdReversal = macdSlope > 0.0 and macdSlope[1] < 0.0

bool hasBearInversion = signalSlope > 0.0 and macdSlope < 0.0
bool hasBullInversion = signalSlope < 0.0 and macdSlope > 0.0

bool hasSignalBias = math.abs(signal) >= signalBiasValue
bool hasNoSignalBias = signal < signalBiasValue and signal > ( 0.0 - signalBiasValue )

bool hasSignalBuyerBias = hasSignalBias and signal > 0.0
bool hasSignalSellerBias = hasSignalBias and signal < 0.0

bool hasPositiveMACDBias = macd > macdBiasValue
bool hasNegativeMACDBias = macd < ( 0.0 - macdBiasValue )

bool hasBullAntiPattern = ta.crossunder(macd, signal)
bool hasBearAntiPattern = ta.crossover(macd, signal)

bool hasSignificantBuyerVolBias = buyVolume > ( sellVolume * 1.5 )
bool hasSignificantSellerVolBias = sellVolume > ( buyVolume * 1.5 )


// 202.30 Profit 55.29% 5m
if ( ( getVolBias(longLookBack) == false ) and rsi <= 41 and math.abs(rsi - rsi[shortLookBack]) > 1 and hasNoSignalBias and rsiSlope > 1.5 and close > open)
    strategy.entry("5C1", strategy.long, qty=1)
strategy.exit("TPS", "5C1", limit=strategy.position_avg_price + takeProfit, stop=strategy.position_avg_price - stopLoss)

// 171.70 Profit 50.22% 5m
if ( getVolBias(longLookBack) == true and rsi > 45 and rsi < 55 and macdSlope > 0 and signalSlope > 0)
    strategy.entry("5C2", strategy.long, qty=1)
strategy.exit("TPS", "5C2", limit=strategy.position_avg_price + takeProfit, stop=strategy.position_avg_price - stopLoss)

// 309.50 Profit 30.8% 5m 2 tp .7 sl 289 trades
if ( macd > macdBiasValue and macdSlope > 0)
    strategy.entry("5P1", strategy.short, qty=1)
strategy.exit("TPS", "5P1", limit=strategy.position_avg_price - takeProfit, stop=strategy.position_avg_price + stopLoss)
Published by ChaoZhang on the FMZ strategy square · last modified 2024-02-18. Collected in the Quant Trading Vault. Unvalidated research: re-test with your own data and costs before trusting it.
Build this with AgenKit
A spec is not a trading system. Paste this into your coding agent and AgenKit runs a specialist team — architecture, test-first build, risk gates, review — with paper trading on by default.
/agenkit build a production-grade trading bot with a backtest engine, risk controls and paper trading by default from strategies/3-Moving-Average-Swing-Interval-Reversal-Strategy.md- npx agenkit install engineering-kit in your project
- Paste the command into your agent and approve each phase
- Get tests, backtest, risk controls and a paper-trading switch
Understand it first
Before you run this, read the lesson behind the idea and how to backtest it honestly. Specs like this one are the survivors of an unknown number of trials; deflate their results accordingly.
Related specs
- Advanced 15 Minute Chart Trading Signal StrategyPine Script · Mean reversion · 3h
- BONK Multi Factor Trading StrategyPine Script · Mean reversion · 1d
- Customizable Non Repainting HTF MACD MFI Scalable Bot StrategyPine Script · Mean reversion · 1d
- Dynamic Adaptive Multi Timeframe Trend Following and Range Reversal Hybrid StrategyPine Script · Mean reversion · 2d
- MACD Cross Period Trading StrategyPine Script · Mean reversion · 1d
- MACD Long Reversal StrategyPine Script · Mean reversion · 1d