Strategy vault / Mean reversion
A Powerful System Combining Reversal and Trend Following Strategies
The Double Dip Reversal Breakout System combines elements of reversal and trend-following strategies in quantitative trading. It generates buy signals by detecting consecutive down days compared to previous closing…
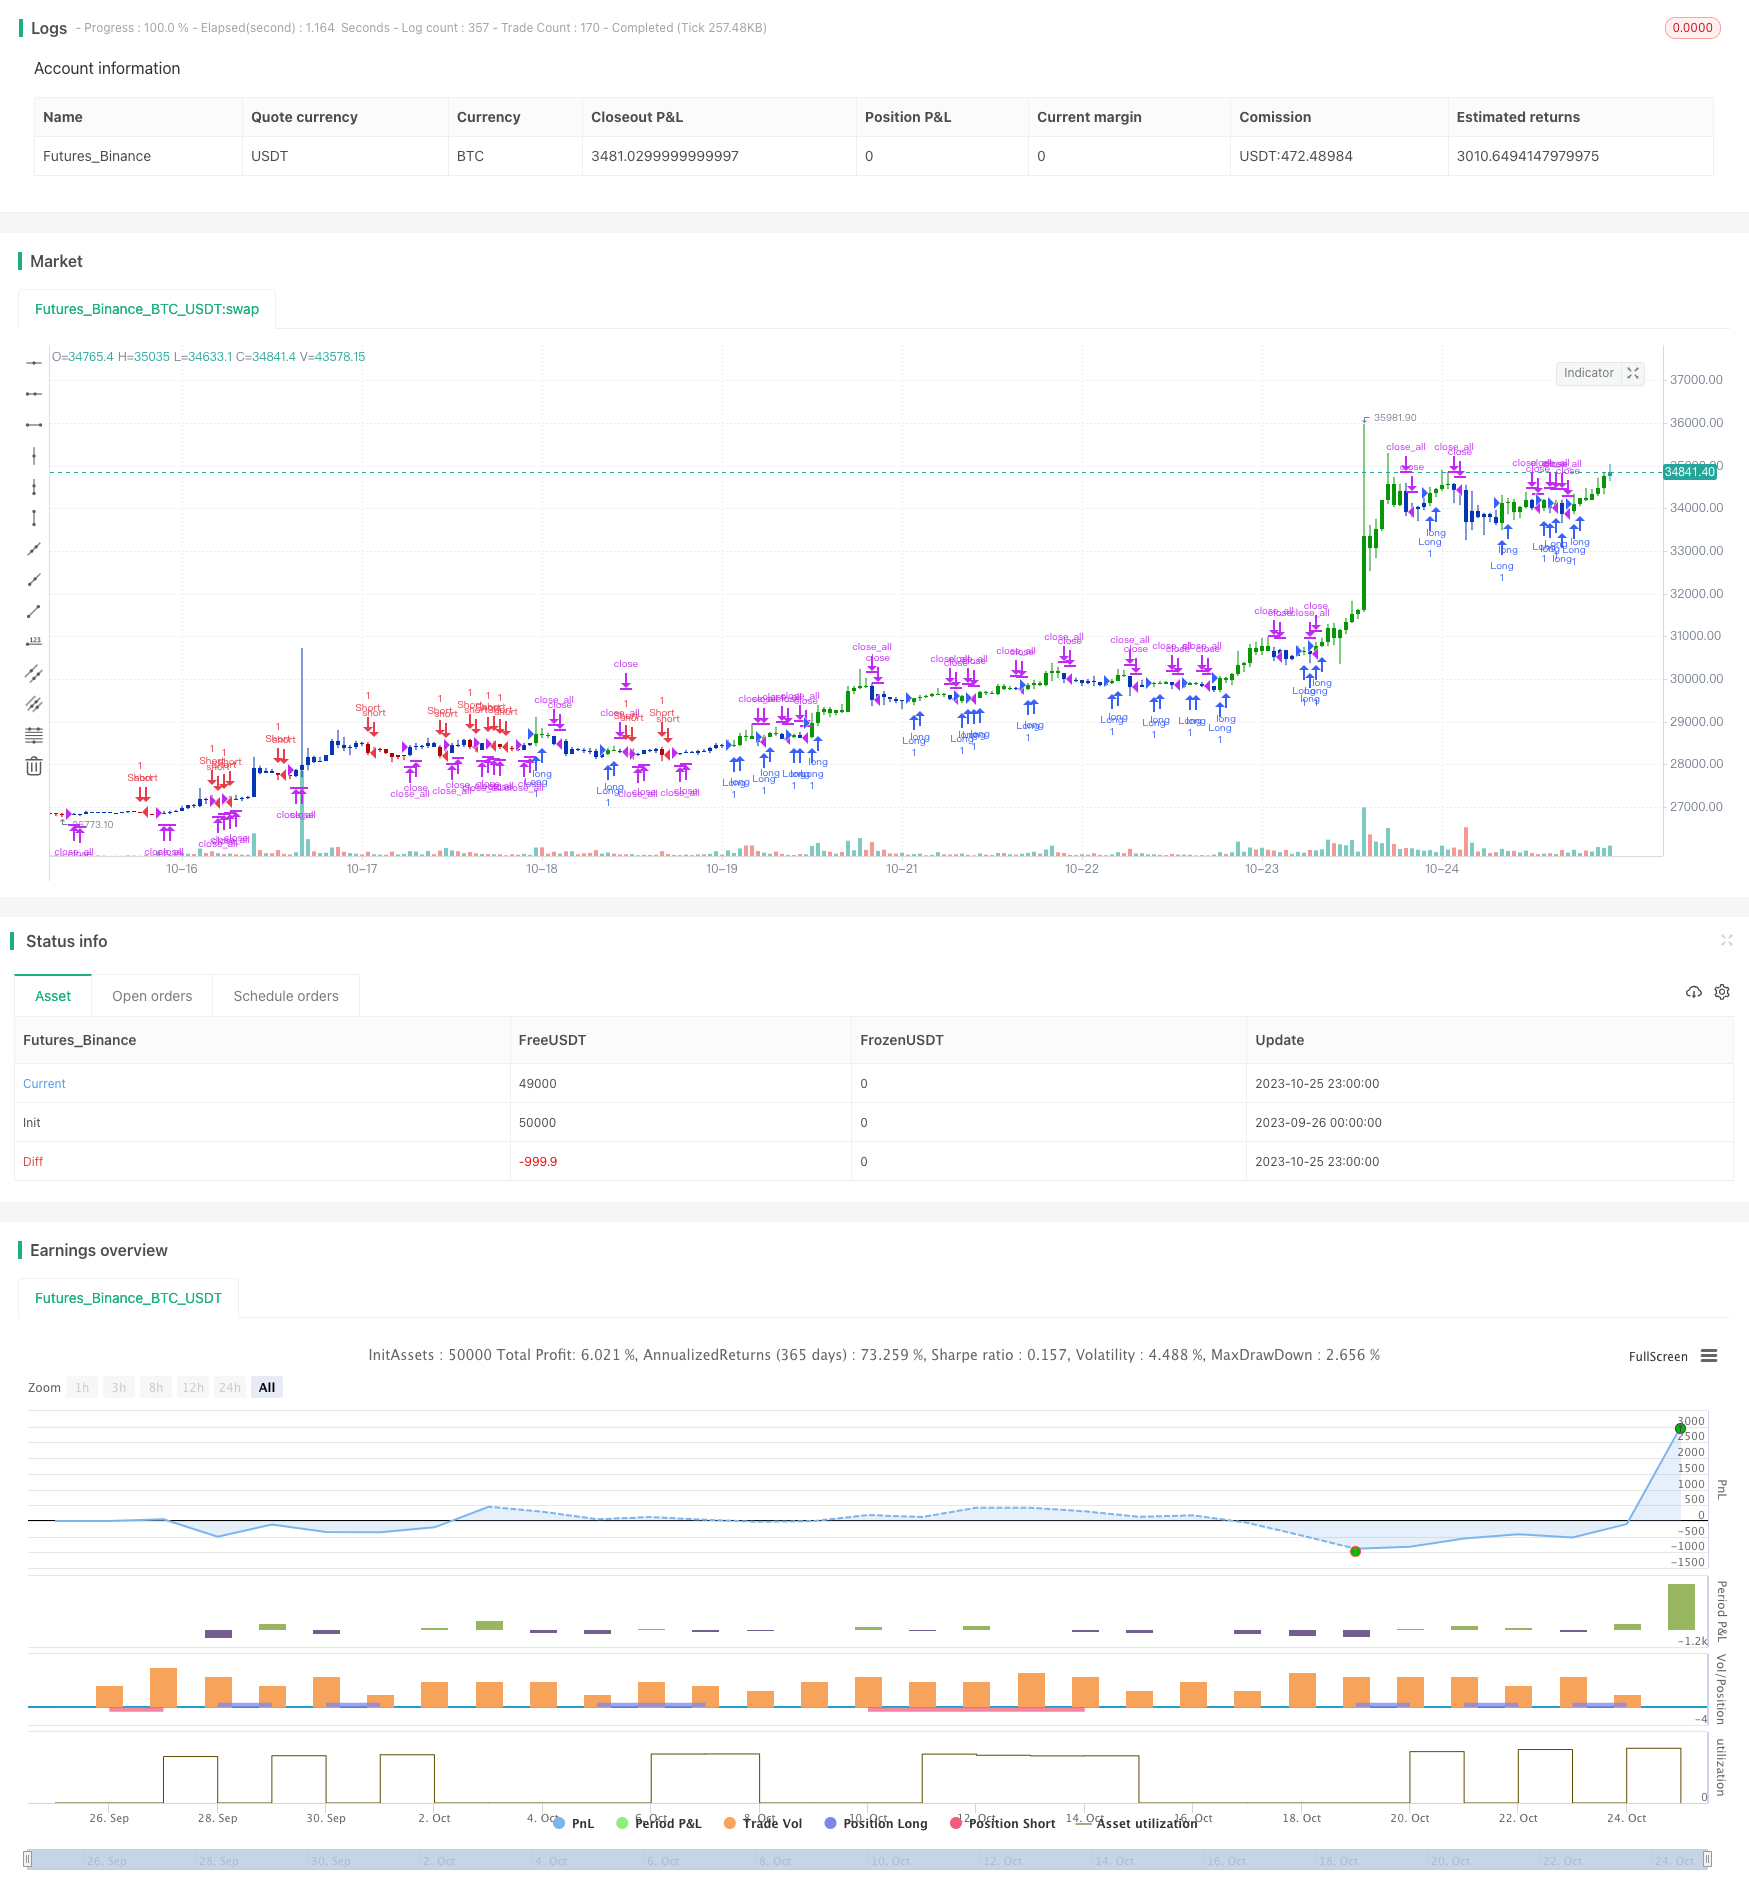
Overview
The Double Dip Reversal Breakout System combines elements of reversal and trend-following strategies in quantitative trading. It generates buy signals by detecting consecutive down days compared to previous closing prices, and sell signals when the price crosses above the T3 moving average line, allowing for profitable trades while managing risks.
How It Works
The system consists of two components:
- The 123 Reversal
It observes the closing price changes over past N days. If today's close is higher than yesterday's, and yesterday is lower than the day before, it signals two consecutive down days and triggers a buy signal. It also uses the STOCH indicator - when today's STOCH fast line is lower than the slow line, it further confirms the validity of the buy signal.
- The T3 Moving Average
The T3 line is calculated based on exponential moving averages using a special formula. By adjusting parameters, it controls the moving average's sensitivity to price changes. A sell signal is generated when the price crosses above the T3 line.
The system combines the two signals above, generating actual trading signals only when the 123 Reversal buy signal and T3 Sell signal occur together.
Advantage Analysis
- Effective for bottom-fishing reversal trades and riding counter-trend bounces
- The moving average helps lock in profits and manage risks
- The dual-signal mechanism improves signal validity and reduces false signals
- Combines the strengths of both trend-following and reversal strategies
- Adjustable parameters allow flexibility for different market conditions
Risk Analysis
- Reversal signals may be false, leading to losing trades
- Improper parameter tuning may cause over-trading, increasing costs
- Sell signals from moving average may prematurely exit profitable trends
- Risks like stop-loss hunting remain during volatile markets
- Parameters need to be optimized for different instruments
To address the risks, the following can be done:
- Adjust reversal parameters to improve signal validity
- Tune moving average parameters to extend holding period
- Add stop-loss to limit losses
- Optimize parameters separately for different instruments
Enhancement Opportunities
The strategy can be improved in several aspects:
Add filters to ensure signal validity
Additional indicators like volume breakouts can be added as filters to avoid false trades.
Adjust parameters for changing markets
Backtest various parameter combinations and select the set giving highest returns. Dynamic parameter tuning can also be used.
Incorporate machine learning for adaptive optimization
Collect large historical datasets, train ML models to forecast optimal entry/exit points, and dynamically optimize parameters.
Optimize parameters separately for different instruments
Instruments have different characteristics, so their optimal parameters also differ. Backtest and tune parameters independently for each.
Conclusion
The Double Dip Reversal Breakout System synergistically combines trend-following and reversal trading. It allows buying at lows after dips and securing profits from trends using moving average. The effective combination of reversal and trend signals capitalizes on reversal opportunities while locking in profits. Despite some risks, the strategy can be improved via parameter optimization, adding filters etc. to suit different market conditions. It provides effective insights for quantitative trading and merits further enhancement.
Parameters
| Name | Default | What it controls |
|---|---|---|
| v_input_1 | true | ---- 123 Reversal ---- |
| v_input_2 | 14 | Length |
| v_input_3 | true | KSmoothing |
| v_input_4 | 3 | DLength |
| v_input_5 | 50 | Level |
| v_input_6 | true | ---- T3 Averages ---- |
| v_input_7 | 5 | LengthT3 |
| v_input_8 | 0.7 | b |
| v_input_9 | false | Trade reverse |
Source Pine Script
/*backtest
start: 2023-09-26 00:00:00
end: 2023-10-26 00:00:00
period: 1h
basePeriod: 15m
exchanges: [{"eid":"Futures_Binance","currency":"BTC_USDT"}]
*/

//@version=4
////////////////////////////////////////////////////////////
//  Copyright by HPotter v1.0 16/09/2021
// This is combo strategies for get a cumulative signal.
//
// First strategy
// This System was created from the Book "How I Tripled My Money In The
// Futures Market" by Ulf Jensen, Page 183. This is reverse type of strategies.
// The strategy buys at market, if close price is higher than the previous close
// during 2 days and the meaning of 9-days Stochastic Slow Oscillator is lower than 50.
// The strategy sells at market, if close price is lower than the previous close price
// during 2 days and the meaning of 9-days Stochastic Fast Oscillator is higher than 50.
//
// Second strategy
// This indicator plots the moving average described in the January, 1998 issue
// of S&C, p.57, "Smoothing Techniques for More Accurate Signals", by Tim Tillson.
// This indicator plots T3 moving average presented in Figure 4 in the article.
// T3 indicator is a moving average which is calculated according to formula:
//     T3(n) = GD(GD(GD(n))),
// where GD - generalized DEMA (Double EMA) and calculating according to this:
//     GD(n,v) = EMA(n) * (1+v)-EMA(EMA(n)) * v,
// where "v" is volume factor, which determines how hot the moving average's response
// to linear trends will be. The author advises to use v=0.7.
// When v = 0, GD = EMA, and when v = 1, GD = DEMA. In between, GD is a less aggressive
// version of DEMA. By using a value for v less than1, trader cure the multiple DEMA
// overshoot problem but at the cost of accepting some additional phase delay.
// In filter theory terminology, T3 is a six-pole nonlinear Kalman filter. Kalman
// filters are ones that use the error - in this case, (time series - EMA(n)) -
// to correct themselves. In the realm of technical analysis, these are called adaptive
// moving averages; they track the time series more aggres-sively when it is making large
// moves. Tim Tillson is a software project manager at Hewlett-Packard, with degrees in
// mathematics and computer science. He has privately traded options and equities for 15 years.
//
// WARNING:
// - For purpose educate only
// - This script to change bars colors.
////////////////////////////////////////////////////////////
Reversal123(Length, KSmoothing, DLength, Level) =>
    vFast = sma(stoch(close, high, low, Length), KSmoothing)
    vSlow = sma(vFast, DLength)
    pos = 0.0
    pos := iff(close[2] < close[1] and close > close[1] and vFast < vSlow and vFast > Level, 1,
	         iff(close[2] > close[1] and close < close[1] and vFast > vSlow and vFast < Level, -1, nz(pos[1], 0)))
	pos


T3A(Length, b) =>
    pos = 0.0
    xPrice = close
    xe1 = ema(xPrice, Length)
    xe2 = ema(xe1, Length)
    xe3 = ema(xe2, Length)
    xe4 = ema(xe3, Length)
    xe5 = ema(xe4, Length)
    xe6 = ema(xe5, Length)
    c1 = -b*b*b
    c2 = 3*b*b+3*b*b*b
    c3 = -6*b*b-3*b-3*b*b*b
    c4 = 1+3*b+b*b*b+3*b*b
    nT3Average = c1 * xe6 + c2 * xe5 + c3 * xe4 + c4 * xe3
    pos:= iff(nT3Average > close, -1,
           iff(nT3Average < close, 1, nz(pos[1], 0)))
    pos

strategy(title="Combo Backtest 123 Reversal & T3 Averages", shorttitle="Combo", overlay = true)
line1 = input(true, "---- 123 Reversal ----")
Length = input(14, minval=1)
KSmoothing = input(1, minval=1)
DLength = input(3, minval=1)
Level = input(50, minval=1)
//-------------------------
line2 = input(true, "---- T3 Averages ----")
LengthT3 = input(5, minval=1)
b = input(0.7, minval=0.01,step=0.01)
reverse = input(false, title="Trade reverse")
posReversal123 = Reversal123(Length, KSmoothing, DLength, Level)
posT3A = T3A(LengthT3, b)
pos = iff(posReversal123 == 1 and posT3A == 1 , 1,
	   iff(posReversal123 == -1 and posT3A == -1, -1, 0))
possig = iff(reverse and pos == 1, -1,
          iff(reverse and pos == -1 , 1, pos))
if (possig == 1 )
    strategy.entry("Long", strategy.long)
if (possig == -1 )
    strategy.entry("Short", strategy.short)
if (possig == 0)
    strategy.close_all()
barcolor(possig == -1 ? #b50404: possig == 1 ? #079605 : #0536b3 )Published by ChaoZhang on the FMZ strategy square · last modified 2023-10-27. Collected in the Quant Trading Vault. Unvalidated research: re-test with your own data and costs before trusting it.
Build this with AgenKit
A spec is not a trading system. Paste this into your coding agent and AgenKit runs a specialist team — architecture, test-first build, risk gates, review — with paper trading on by default.
/agenkit build a production-grade trading bot with a backtest engine, risk controls and paper trading by default from strategies/A-Powerful-System-Combining-Reversal-and-Trend-Following-Strategies.md- npx agenkit install engineering-kit in your project
- Paste the command into your agent and approve each phase
- Get tests, backtest, risk controls and a paper-trading switch
Understand it first
Before you run this, read the lesson behind the idea and how to backtest it honestly. Specs like this one are the survivors of an unknown number of trials; deflate their results accordingly.
Related specs
- Advanced 15 Minute Chart Trading Signal StrategyPine Script · Mean reversion · 3h
- Dynamic Adaptive Multi Timeframe Trend Following and Range Reversal Hybrid StrategyPine Script · Mean reversion · 2d
- Multi Strategy Technical Analysis Trading SystemPine Script · Mean reversion · 1d
- Oma and Apollo Dual Rail Trading StrategyPine Script · Mean reversion · 5m
- Stochastic Moving Average StrategyPine Script · Mean reversion · 1h
- 3EMA with Stochastic RSI StrategyPine Script · Mean reversion · 1h