Strategy vault / Trend following
Adaptive Bollinger Trend Tracking Strategy
This strategy is based on the Bollinger Bands indicator, combined with an adaptive moving average, to accurately judge and track trends. By dynamically adjusting parameters, the strategy can adapt to different…
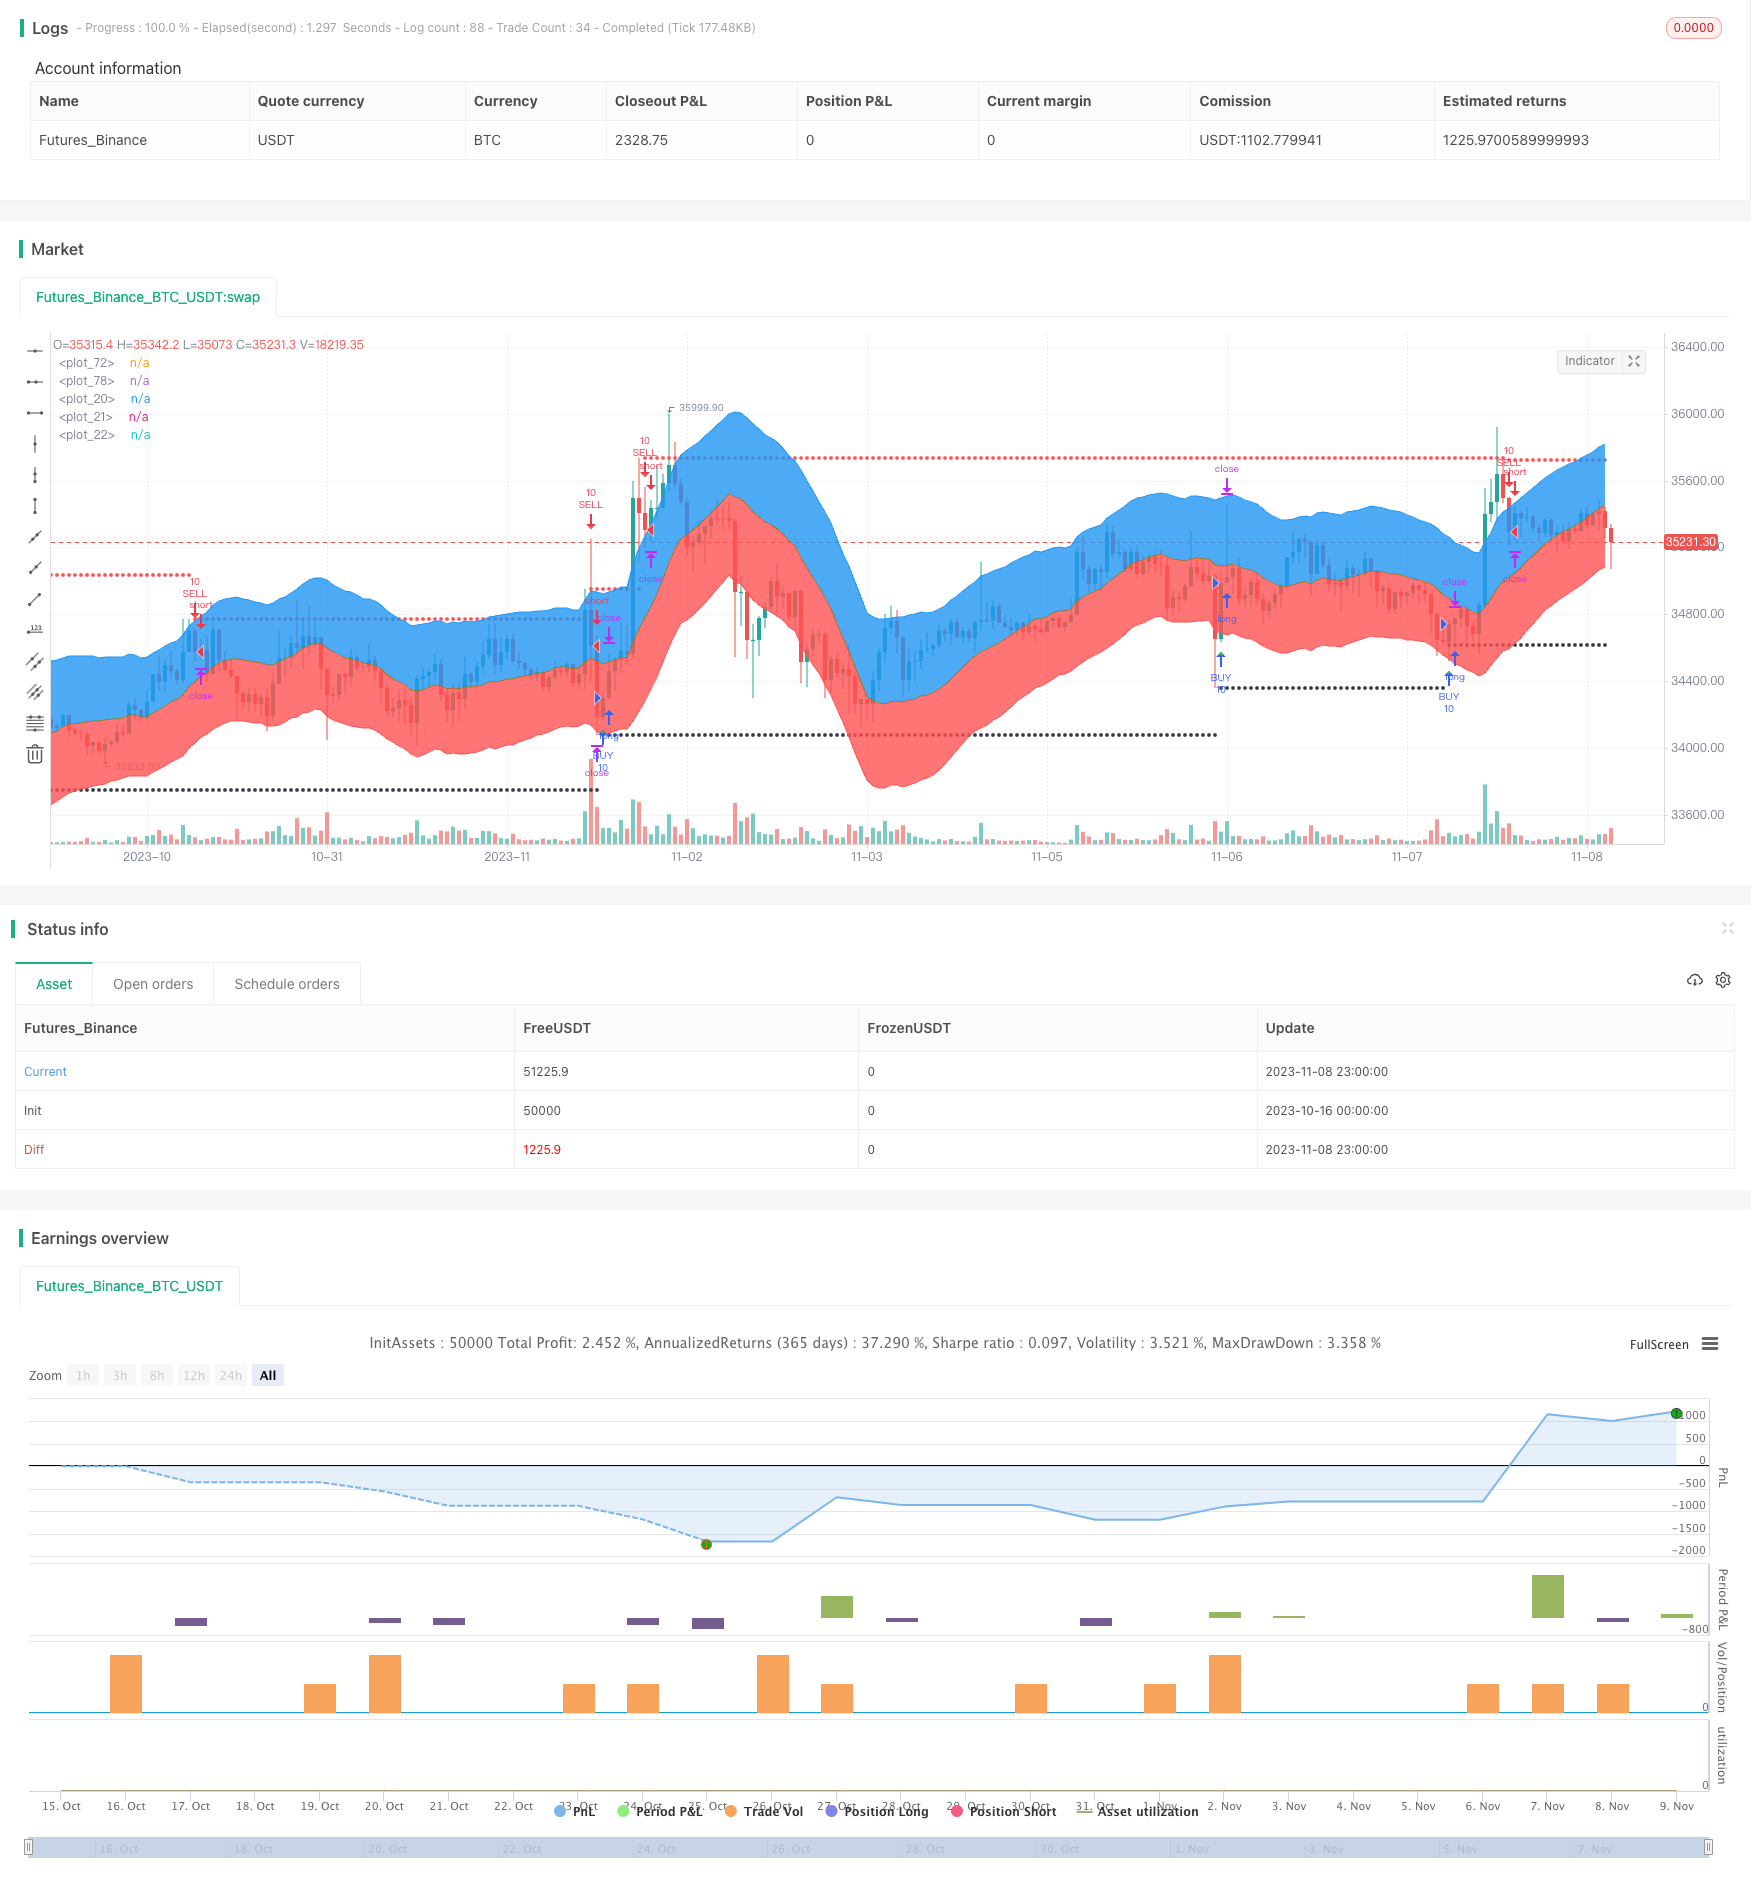
Overview
This strategy is based on the Bollinger Bands indicator, combined with an adaptive moving average, to accurately judge and track trends. By dynamically adjusting parameters, the strategy can adapt to different products and market environments, with strong stability and adaptability.
Strategy Logic
The strategy consists of the following main parts:
Calculate adaptive moving average. Use linear regression indicator to calculate linear regression curve over a certain period as moving average.
Calculate Bollinger Bands. Use adaptive ATR indicator to calculate bands, combined with user specified ratio2 parameter, to get upper and lower bands.
Determine entries and exits. Judge trend direction and entries/exits based on price breaking through Bollinger Bands. Breaking upper band signals sell entry while breaking lower band signals buy entry.
Set stop loss and take profit. Use fixed points stop loss to control risks and trailing stop profit to maximize trend profits.
Combine with backtesting time window for strategy optimization and verification.
Advantages
Adaptive parameters. Adaptive moving average and bands design adapts to market changes.
Clear breakout signals. Bollinger Bands breakouts offer clear trend reversal signals.
Reasonable stops setting. Fixed stop loss controls risks and trailing stop profit aims to maximize trend profits.
Validated by backtesting. Backtesting window verifies strategy effectiveness.
Easy to understand and implement. The logic is clear and code is concise for easy understanding.
Risks
Bollinger Bands need parameters tuning. Band width and period may need optimization for different products. Improper parameters lead to missing signals or false triggers.
Limited backtest period. Recent backtest range may be insufficient to fully verify stability across comprehensive historical data.
Overfitting risk. Current optimized parameters may overfit recent specific market conditions.
Stop loss level needs evaluation. Small stop loss may be too sensitive and get stopped out by small fluctuations. Suitable stop loss needs assessed.
Lack of quantifiable validation. Currently only use graphical breakout for trade signals without quantifiable metrics validation.
Improvement Directions
Introduce more adaptive indicators. Test combinations of various adaptive moving averages and channels to build robust trend tracking system.
Parameter optimization. Use more systematic methods like genetic algorithms to find optimal parameters combination.
Expand backtest period. Test on wider historical data to examine parameter stability. Incorporate transaction costs for more realistic backtest.
Introduce quantitative filters. Set up filters like volume breakout, MACD histogram gap to avoid false breakouts.
Optimize stops. Evaluate different fixed stop loss levels and trailing stop methods to find optimal stops.
Live validation. Run optimized strategy live to record performance for further improvements.
Conclusion
The strategy has clear logic using Bollinger Bands to determine trend direction and capture breakout signals, with moving average defining overall trend. With proper optimizations, it can become a stable and reliable trend following strategy. But key considerations include backtest representativeness, quantitative filters, and stop loss tuning. If these aspects are handled well, the strategy can achieve steady and considerable profits in live trading.
Parameters
| Name | Default | What it controls |
|---|---|---|
| v_input_1 | 40 | len |
| v_input_2 | true | Upper Deviation |
| v_input_3 | true | Lower Deviation |
| v_input_4 | 2 | Ratio 2 |
| v_input_5 | 40 | linear Length |
| v_input_6 | 2 | linear Deviation |
| v_input_7 | true | Overbought |
| v_input_8 | false | Oversold |
| v_input_9 | false | Use another Timeframe? |
| v_input_10 | 60 | Select The Timeframe |
| v_input_11 | 70 | SL Activation |
| v_input_12 | 10 | SL Trigger |
| v_input_13 | 50 | TP Activation |
| v_input_14 | 10 | TP Trigger |
| v_input_15 | true | From Month |
| v_input_16 | true | From Day |
| v_input_17 | 2019 | From Year |
| v_input_18 | true | To Month |
| v_input_19 | true | To Day |
| v_input_20 | 9999 | To Year |
Source Pine Script
/*backtest
start: 2023-10-16 00:00:00
end: 2023-11-09 00:00:00
period: 1h
basePeriod: 15m
exchanges: [{"eid":"Futures_Binance","currency":"BTC_USDT"}]
*/

//@version=4
strategy("Linear Regression (Backtest / Trailing Stop)",overlay=true)
close_price = close[0]

len = input(40)
linear_reg = linreg(close_price, len, 0)

calculationToPlotAverageMeanLine=linear_reg
useUpperDeviation = input(true, "Upper Deviation", bool)
useLowerDeviation = input(true, "Lower Deviation", bool)
ratio2=input(defval=2,title=" Ratio 2")
avg=atr(len)
r2=avg*ratio2
top=linear_reg+r2
bott=linear_reg-r2

calculationToPlotUpperLine=top
calculationToPlotLowerLine=bott

plotUpperDeviationLine = plot(not useUpperDeviation ? na : calculationToPlotUpperLine, color=color(blue,0))
plotAverageMeanLine = plot(calculationToPlotAverageMeanLine, color=color(olive,0))
plotLowererDeviationLine = plot(not useLowerDeviation ? na : calculationToPlotLowerLine, color=color(red,0))
fill(plotUpperDeviationLine, plotAverageMeanLine, color=color(blue,85))
fill(plotLowererDeviationLine, plotAverageMeanLine, color=color(red,85))


//
length = input(title="linear Length",  defval=40, minval=1)
multiplier = input(title="linear Deviation", type=float, defval=2, minval=1)
overbought = input(title="Overbought",  defval=1, minval=1)
oversold = input(title="Oversold",  defval=0, minval=1)
custom_timeframe = input(title="Use another Timeframe?", type=bool, defval=false)
highTimeFrame = input(title="Select The Timeframe",  defval="60")
res1 = custom_timeframe ? highTimeFrame : timeframe.period

fixedSL = input(title="SL Activation", defval=70)
trailSL = input(title="SL Trigger", defval=10)
fixedTP = input(title="TP Activation", defval=50)
trailTP = input(title="TP Trigger", defval=10)

// === INPUT BACKTEST RANGE ===
FromMonth = input(defval = 1, title = "From Month", minval = 1, maxval = 12)
FromDay   = input(defval = 1, title = "From Day", minval = 1, maxval = 31)
FromYear  = input(defval = 2019, title = "From Year", minval = 2015)
ToMonth   = input(defval = 1, title = "To Month", minval = 1, maxval = 12)
ToDay     = input(defval = 1, title = "To Day", minval = 1, maxval = 31)
ToYear    = input(defval = 9999, title = "To Year", minval = 2015)

start     = timestamp(FromYear, FromMonth, FromDay, 00, 00)  // backtest start window
finish    = timestamp(ToYear, ToMonth, ToDay, 23, 59)        // backtest finish window
window()  => time >= start and time <= finish ? true : false // create function "within window of time"

smabasis = linreg(close_price, length, 0)
stdev = stdev(close, length)
cierre = request.security(syminfo.tickerid, res1, close, false)
alta = request.security(syminfo.tickerid, res1, high, false)
baja = request.security(syminfo.tickerid, res1, low, false)
basis1 = request.security(syminfo.tickerid, res1, smabasis, false)
stdevb = request.security(syminfo.tickerid, res1, stdev, false)
dev = multiplier * stdevb // stdev(cierre, length)
upper = basis1 + dev
lower = basis1 - dev

bbr = (cierre - lower)/(upper - lower)

// plot(bbr)

// // MARCA LAS RESISTENCIAS
pintarojo = 0.0
pintarojo := nz(pintarojo[1])
pintarojo := bbr[1] > overbought and bbr < overbought ? alta[1] :  nz(pintarojo[1])
p = plot(pintarojo, color = red, style=circles, linewidth=2)

// // MARCA LOS SOPORTES
pintaverde = 0.0
pintaverde := nz(pintaverde[1])
pintaverde := bbr[1] < oversold and bbr > oversold ? baja[1] :  nz(pintaverde[1])
g = plot(pintaverde, color = black, style=circles, linewidth=2)
zz= crossover(pintaverde,pintaverde[1]) or crossunder(pintaverde,pintaverde[1])
kp= crossover(pintarojo,pintarojo[1]) or crossunder(pintarojo,pintarojo[1])
plotshape(zz,  title="buy", style=shape.triangleup,location=location.belowbar, color=green, transp=0, size=size.small)
plotshape(kp, title="sell", style=shape.triangledown,location=location.abovebar, color=red, transp=0, size=size.small)


strategy.entry("BUY", strategy.long, qty=10, oca_name="BUY",  when=zz and window())
strategy.exit("B.Exit", "BUY", qty_percent = 100, loss=fixedSL, trail_offset=trailTP, trail_points=fixedTP)

strategy.entry("SELL", strategy.short, qty=10, oca_name="SELL",  when=kp and window())
strategy.exit("S.Exit", "SELL", qty_percent = 100, loss=fixedSL, trail_offset=trailSL, trail_points=fixedTP)
Published by ChaoZhang on the FMZ strategy square · last modified 2023-11-16. Collected in the Quant Trading Vault. Unvalidated research: re-test with your own data and costs before trusting it.
Build this with AgenKit
A spec is not a trading system. Paste this into your coding agent and AgenKit runs a specialist team — architecture, test-first build, risk gates, review — with paper trading on by default.
/agenkit build a production-grade trading bot with a backtest engine, risk controls and paper trading by default from strategies/Adaptive-Bollinger-Trend-Tracking-Strategy.md- npx agenkit install engineering-kit in your project
- Paste the command into your agent and approve each phase
- Get tests, backtest, risk controls and a paper-trading switch
Understand it first
Before you run this, read the lesson behind the idea and how to backtest it honestly. Specs like this one are the survivors of an unknown number of trials; deflate their results accordingly.
Related specs
- ATR and Moving Average Crossover Hybrid StrategyPine Script · Trend following · 1h
- BB Percentage Index Trend Fading StrategyPine Script · Trend following · 1h
- Bollinger Bands and RSI Trend Following StrategyPine Script · Trend following · 1h
- Dual Moving Average Crossover Dynamic Position Optimization Strategy with EMA Cross Signal SystemPine Script · Trend following · 1h
- Dynamic Moving Average and Bollinger Bands Cross Strategy with Fixed Stop Loss Optimization ModelPine Script · Trend following · 3h
- EMA Cross Trend Following Strategy with SMA Stop Loss and Re Entry MechanismPine Script · Trend following · 1h