Adaptive Channel Breakout Strategy with Dynamic Support and Resistance Trading System
This strategy is an advanced trading system based on support and resistance levels, combining dynamic trend channels with risk management functionality. The strategy identifies key support and resistance levels by…
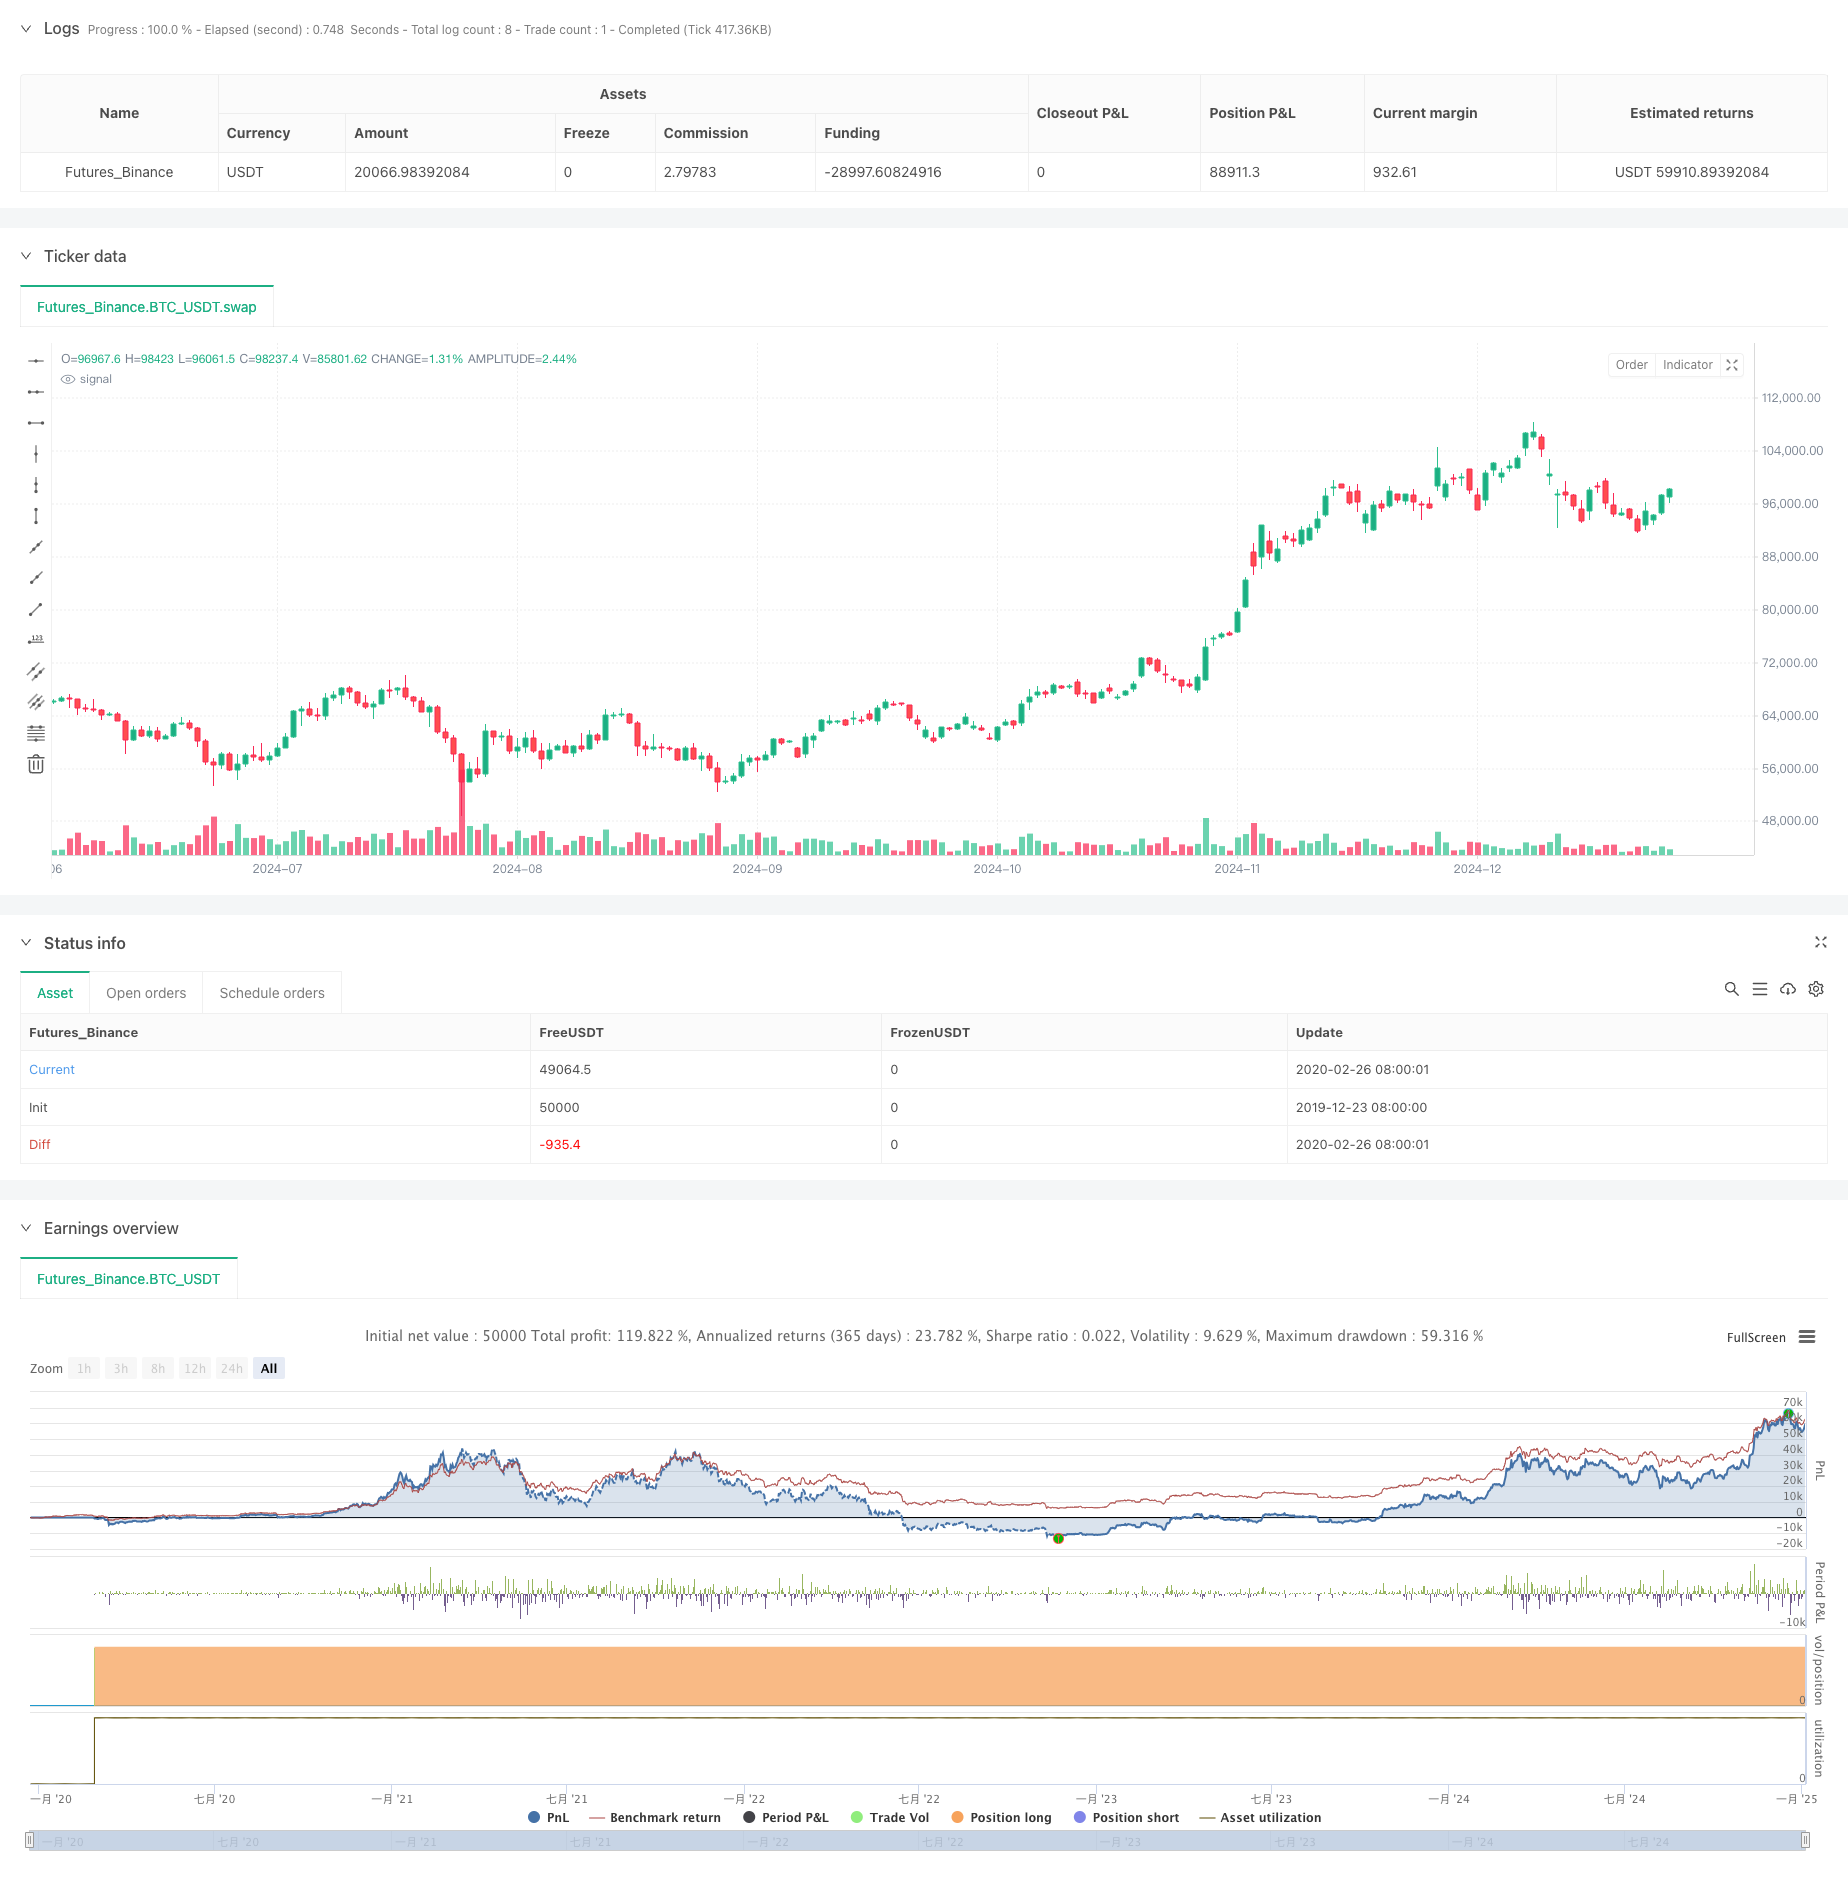
Overview
This strategy is an advanced trading system based on support and resistance levels, combining dynamic trend channels with risk management functionality. The strategy identifies key support and resistance levels by analyzing price fluctuations' highs and lows over a specified lookback period, and utilizes channel width parameters to construct dynamic trading ranges, providing traders with a clear market structure perspective and precise trading signals.
Strategy Principles
The core logic includes several key elements:
- Support and resistance levels are calculated based on the lowest and highest prices within a user-defined lookback period
- Dynamic channel width is set through percentage parameters, building upper and lower channels based on support and resistance levels
- Buy signals are triggered when price approaches support level (within 1% distance)
- The system automatically calculates stop-loss and take-profit levels based on user-defined percentages
- Trades are executed only within specified backtesting time range
- Risk-to-reward ratios are calculated and displayed in real-time to help traders evaluate potential returns against risks
Strategy Advantages
- High Adaptability: Support and resistance levels dynamically adjust with market changes, adapting to different market environments
- Comprehensive Risk Management: Integrates stop-loss, take-profit, and risk-reward ratio calculation with visualization
- Clear Trading Signals: Provides distinct entry signals, reducing the impact of subjective judgment
- Excellent Visualization: Various price levels are displayed intuitively through different colored lines and labels
- Flexible Parameters: Allows users to adjust parameters based on personal trading style and market characteristics
Strategy Risks
- Market Volatility Risk: May trigger excessive trading signals in highly volatile markets
- False Breakout Risk: Price approaching support levels may result in false breakouts leading to incorrect signals
- Parameter Sensitivity: Strategy performance is highly dependent on lookback period and channel width settings
- Unidirectional Trading Limitation: Currently only supports long positions, potentially missing short opportunities
- Time Dependency: Strategy effectiveness is limited to specified backtesting time range
Strategy Optimization Directions
- Add Trend Filter: Incorporate moving averages or momentum indicators to filter out counter-trend signals
- Complete Trading Directions: Add short trading logic to enhance strategy comprehensiveness
- Optimize Signal Generation: Integrate volume indicators to verify price breakout validity
- Dynamic Stop-Loss Setting: Adjust stop-loss distances dynamically based on ATR or volatility
- Enhance Position Management: Dynamically adjust position sizes based on risk-reward ratio and market volatility
Summary
This strategy combines key technical analysis concepts - support/resistance levels and trend channels - to build a logically rigorous and risk-controlled trading system. The strategy's strengths lie in its adaptability and comprehensive risk management, but traders still need to carefully adjust parameters based on market conditions and personal risk tolerance. Through the suggested optimization directions, the strategy has room for further improvement and can develop into a more comprehensive and robust trading system.
Source Pine Script
/*backtest
start: 2019-12-23 08:00:00
end: 2025-01-04 08:00:00
period: 1d
basePeriod: 1d
exchanges: [{"eid":"Futures_Binance","currency":"BTC_USDT"}]
*/

//@version=5
strategy("Support and Resistance with Trend Lines and Channels", overlay=true)

// Inputs
lookback = input.int(20, title="Lookback Period for Support/Resistance", minval=1)
channelWidth = input.float(0.01, title="Channel Width (%)", minval=0.001) / 100
startDate = input(timestamp("2023-01-01 00:00"), title="Backtesting Start Date")
endDate = input(timestamp("2023-12-31 23:59"), title="Backtesting End Date")

// Check if the current bar is within the testing range
inTestingRange = true

// Support and Resistance Levels
supportLevel = ta.lowest(low, lookback)  // Swing low (support)
resistanceLevel = ta.highest(high, lookback)  // Swing high (resistance)

// Trend Lines and Channels
var line supportLine = na
var line resistanceLine = na
var line upperChannelLine = na
var line lowerChannelLine = na

// Calculate channel levels
upperChannel = resistanceLevel * (1 + channelWidth)  // Upper edge of channel
lowerChannel = supportLevel * (1 - channelWidth)  // Lower edge of channel

// Create or update the support trend line
// if na(supportLine)
//     supportLine := line.new(bar_index, supportLevel, bar_index + 1, supportLevel, color=color.green, width=2, extend=extend.right)
// else
//     line.set_y1(supportLine, supportLevel)
//     line.set_y2(supportLine, supportLevel)

// // Create or update the resistance trend line
// if na(resistanceLine)
//     resistanceLine := line.new(bar_index, resistanceLevel, bar_index + 1, resistanceLevel, color=color.red, width=2, extend=extend.right)
// else
//     line.set_y1(resistanceLine, resistanceLevel)
//     line.set_y2(resistanceLine, resistanceLevel)

// // Create or update the upper channel line
// if na(upperChannelLine)
//     upperChannelLine := line.new(bar_index, upperChannel, bar_index + 1, upperChannel, color=color.blue, width=1, style=line.style_dashed, extend=extend.right)
// else
//     line.set_y1(upperChannelLine, upperChannel)
//     line.set_y2(upperChannelLine, upperChannel)

// // Create or update the lower channel line
// if na(lowerChannelLine)
//     lowerChannelLine := line.new(bar_index, lowerChannel, bar_index + 1, lowerChannel, color=color.purple, width=1, style=line.style_dashed, extend=extend.right)
// else
//     line.set_y1(lowerChannelLine, lowerChannel)
//     line.set_y2(lowerChannelLine, lowerChannel)

// Buy Condition: When price is near support level
buyCondition = close <= supportLevel * 1.01 and inTestingRange
if buyCondition
    strategy.entry("Buy", strategy.long)

// Stop Loss and Take Profit
stopLossPercentage = input.float(1.5, title="Stop Loss Percentage", minval=0.0) / 100
takeProfitPercentage = input.float(3.0, title="Take Profit Percentage", minval=0.0) / 100

var float longStopLoss = na
var float longTakeProfit = na
if strategy.position_size > 0
    longStopLoss := strategy.position_avg_price * (1 - stopLossPercentage)
    longTakeProfit := strategy.position_avg_price * (1 + takeProfitPercentage)
    strategy.exit("Exit Buy", "Buy", stop=longStopLoss, limit=longTakeProfit)

// Visualize Entry, Stop Loss, and Take Profit Levels
var float entryPrice = na
if buyCondition
    entryPrice := close
if not na(entryPrice)
    label.new(bar_index, entryPrice, text="Entry: " + str.tostring(entryPrice, "#.##"), style=label.style_label_up, color=color.green, textcolor=color.white)

if strategy.position_size > 0
    line.new(bar_index, longStopLoss, bar_index + 1, longStopLoss, color=color.red, width=1, extend=extend.right)
    line.new(bar_index, longTakeProfit, bar_index + 1, longTakeProfit, color=color.blue, width=1, extend=extend.right)

// Risk-to-Reward Ratio (Optional)
if not na(entryPrice) and not na(longStopLoss) and not na(longTakeProfit)
    riskToReward = (longTakeProfit - entryPrice) / (entryPrice - longStopLoss)
label.new(bar_index, entryPrice, text="R:R " + str.tostring(riskToReward, "#.##"), style=label.style_label_up, color=color.yellow, textcolor=color.black, size=size.small)Published by ChaoZhang on the FMZ strategy square · last modified 2025-01-06. Collected in the Quant Trading Vault. Unvalidated research: re-test with your own data and costs before trusting it.
Build this with AgenKit
A spec is not a trading system. Paste this into your coding agent and AgenKit runs a specialist team — architecture, test-first build, risk gates, review — with paper trading on by default.
/agenkit build a production-grade trading bot with a backtest engine, risk controls and paper trading by default from strategies/Adaptive-Channel-Breakout-Strategy-with-Dynamic-Support-and-Resistance-Trading-System.md- npx agenkit install engineering-kit in your project
- Paste the command into your agent and approve each phase
- Get tests, backtest, risk controls and a paper-trading switch
Understand it first
Before you run this, read the lesson behind the idea and how to backtest it honestly. Specs like this one are the survivors of an unknown number of trials; deflate their results accordingly.
Related specs
- Bollinger Bands Breakout Trading StrategyPine Script · Breakout · 1h
- Bollinger Bands Dynamic Breakout StrategyPine Script · Breakout · 1h
- Cross period Value Area Breakout StrategyPine Script · Breakout · 1d
- Donchian Channel Breakout Strategy 442842Pine Script · Breakout · 4h
- Dynamic Support Resistance Breakout Moving Average Crossover StrategyPine Script · Breakout · 1d
- Dynamic Support and Resistance Adaptive Pivot Trading StrategyPine Script · Breakout · 1d