Strategy vault / Mean reversion
Adaptive Dynamic Trading Strategy Based on Standardized Logarithmic Returns
This strategy is an adaptive trading system based on the Shiryaev-Zhou Index (SZI). It identifies overbought and oversold market conditions by calculating standardized scores of logarithmic returns, aiming to capture…
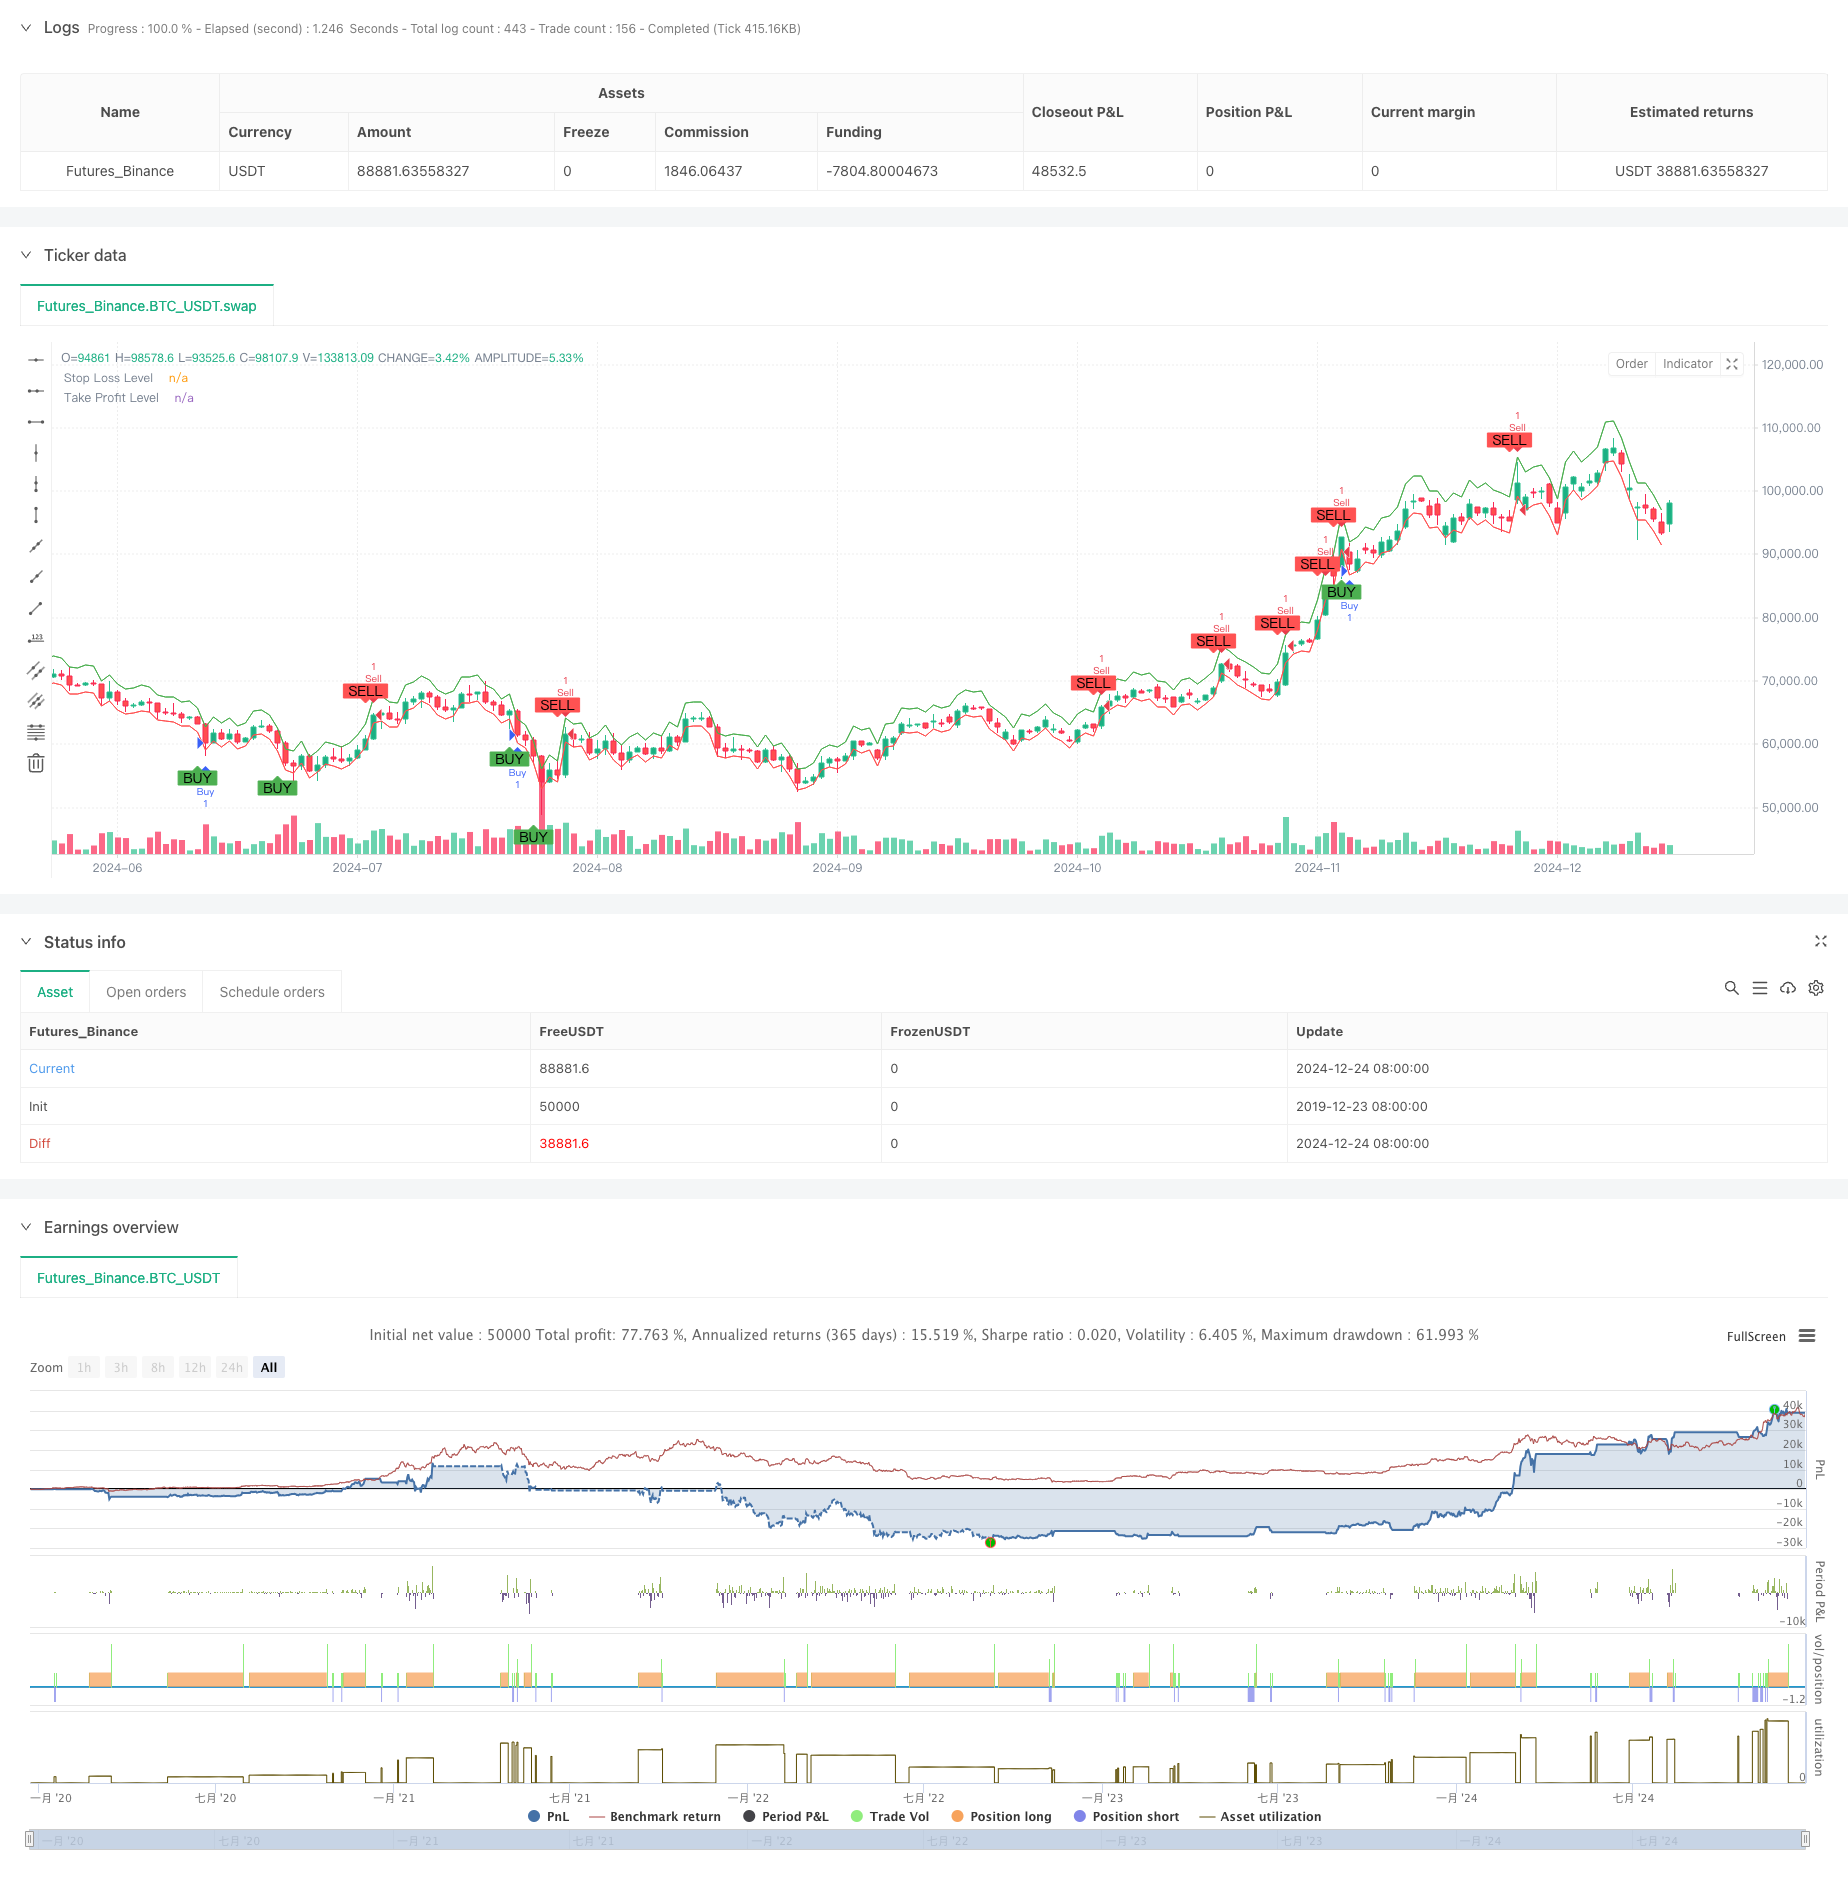
Overview
This strategy is an adaptive trading system based on the Shiryaev-Zhou Index (SZI). It identifies overbought and oversold market conditions by calculating standardized scores of logarithmic returns, aiming to capture mean reversion opportunities. The strategy incorporates dynamic stop-loss and take-profit targets for precise risk control.
Strategy Principles
The core of the strategy lies in constructing a standardized indicator using rolling statistical properties of logarithmic returns. The specific steps are:
- Calculate logarithmic returns for normalization
- Compute rolling mean and standard deviation using a 50-period window
- Construct SZI: (logarithmic return - rolling mean)/rolling standard deviation
- Generate long signals when SZI falls below -2.0 and short signals when above 2.0
- Set 2% stop-loss and 4% take-profit levels based on entry price
Strategy Advantages
- Solid Theoretical Foundation: Based on log-normal distribution assumptions with strong statistical support
- High Adaptability: Rolling window calculations adapt to changes in market volatility characteristics
- Comprehensive Risk Control: Percentage-based stop-loss strategy enables precise risk control for each trade
- User-friendly Visualization: Clear annotation of trading signals and risk control levels on charts
Strategy Risks
- Parameter Sensitivity: Strategy performance significantly affected by choice of rolling window length and thresholds
- Market Environment Dependency: May generate frequent false signals in trending markets
- Slippage Impact: Actual execution prices may significantly deviate from ideal levels during volatile periods
- Calculation Delay: Real-time computation of statistical indicators may lead to signal lag
Optimization Directions
- Dynamic Thresholds: Consider adjusting signal thresholds based on market volatility
- Multiple Time Frames: Introduce signal confirmation mechanisms across multiple timeframes
- Volatility Filtering: Pause trading or adjust positions during extreme volatility periods
- Signal Confirmation: Add volume, momentum, and other auxiliary indicators for signal confirmation
- Position Management: Implement volatility-based dynamic position sizing
Summary
This is a quantitative trading strategy built on solid statistical foundations, capturing price volatility opportunities through standardized logarithmic returns. The strategy's main strengths lie in its adaptability and comprehensive risk control, though there remains room for optimization in parameter selection and market environment adaptation. Through the introduction of dynamic thresholds and multi-dimensional signal confirmation mechanisms, the strategy's stability and reliability can be further enhanced.
Source Pine Script
/*backtest
start: 2019-12-23 08:00:00
end: 2024-12-25 08:00:00
period: 1d
basePeriod: 1d
exchanges: [{"eid":"Futures_Binance","currency":"BTC_USDT"}]
*/

//@version=5
strategy("Jalambi Paul model", overlay=true)

// Define the length for the rolling window
window = input.int(50, title="Window Length", minval=1)
threshold = 2.0 // Fixed threshold value
risk_percentage = input.float(1.0, title="Risk Percentage per Trade", step=0.1) / 100

// Calculate the logarithmic returns
log_return = math.log(close / close[1])

// Calculate the rolling mean and standard deviation
rolling_mean = ta.sma(log_return, window)
rolling_std = ta.stdev(log_return, window)

// Calculate the Shiryaev-Zhou Index (SZI)
SZI = (log_return - rolling_mean) / rolling_std

// Generate signals based on the fixed threshold
long_signal = SZI < -threshold
short_signal = SZI > threshold

// Plot the signals on the main chart (overlay on price)
plotshape(series=long_signal, location=location.belowbar, color=color.green, style=shape.labelup, title="Buy Signal", text="BUY", offset=-1)
plotshape(series=short_signal, location=location.abovebar, color=color.red, style=shape.labeldown, title="Sell Signal", text="SELL", offset=-1)

// Strategy logic: Buy when SZI crosses below the negative threshold, Sell when it crosses above the positive threshold
if (long_signal)
    strategy.entry("Buy", strategy.long, comment="Long Entry")

if (short_signal)
    strategy.entry("Sell", strategy.short, comment="Short Entry")

// Calculate the stop loss and take profit levels based on the percentage of risk
stop_loss_pct = input.float(2.0, title="Stop Loss (%)") / 100
take_profit_pct = input.float(4.0, title="Take Profit (%)") / 100

// Set the stop loss and take profit levels based on the entry price
strategy.exit("Take Profit / Stop Loss", "Buy", stop=close * (1 - stop_loss_pct), limit=close * (1 + take_profit_pct))
strategy.exit("Take Profit / Stop Loss", "Sell", stop=close * (1 + stop_loss_pct), limit=close * (1 - take_profit_pct))

// Plot the stop loss and take profit levels for visualization (optional)
plot(stop_loss_pct != 0 ? close * (1 - stop_loss_pct) : na, color=color.red, linewidth=1, title="Stop Loss Level")
plot(take_profit_pct != 0 ? close * (1 + take_profit_pct) : na, color=color.green, linewidth=1, title="Take Profit Level")
Published by ChaoZhang on the FMZ strategy square · last modified 2024-12-27. Collected in the Quant Trading Vault. Unvalidated research: re-test with your own data and costs before trusting it.
Build this with AgenKit
A spec is not a trading system. Paste this into your coding agent and AgenKit runs a specialist team — architecture, test-first build, risk gates, review — with paper trading on by default.
/agenkit build a production-grade trading bot with a backtest engine, risk controls and paper trading by default from strategies/Adaptive-Dynamic-Trading-Strategy-Based-on-Standardized-Logarithmic-Returns.md- npx agenkit install engineering-kit in your project
- Paste the command into your agent and approve each phase
- Get tests, backtest, risk controls and a paper-trading switch
Understand it first
Before you run this, read the lesson behind the idea and how to backtest it honestly. Specs like this one are the survivors of an unknown number of trials; deflate their results accordingly.
Related specs
- 3 10 Oscillator Profile Flagging StrategyPine Script · Mean reversion · 1d
- A Trend Reversal Strategy Based on Moving Averages Price Patterns and VolumePine Script · Mean reversion · 1d
- Adaptive Mean Reversion Trading Strategy Based on Chande Momentum OscillatorPine Script · Mean reversion · 1d
- Adaptive Trading Strategy Combining Dynamic Trend Reversal and Stochastic IndicatorPine Script · Mean reversion · 1d
- Advanced 15 Minute Chart Trading Signal StrategyPine Script · Mean reversion · 3h
- Advanced Momentum EMA Trend Following with RSI Overbought Oversold Trading StrategyPine Script · Mean reversion · 1d