Adaptive Moving Average Channel Breakout Strategy
The Adaptive Moving Average Channel Breakout Strategy is a trend-following breakout strategy based on the Adaptive Moving Average (AMA) and an adaptive channel range for generating trading signals. It uses the AMA to…
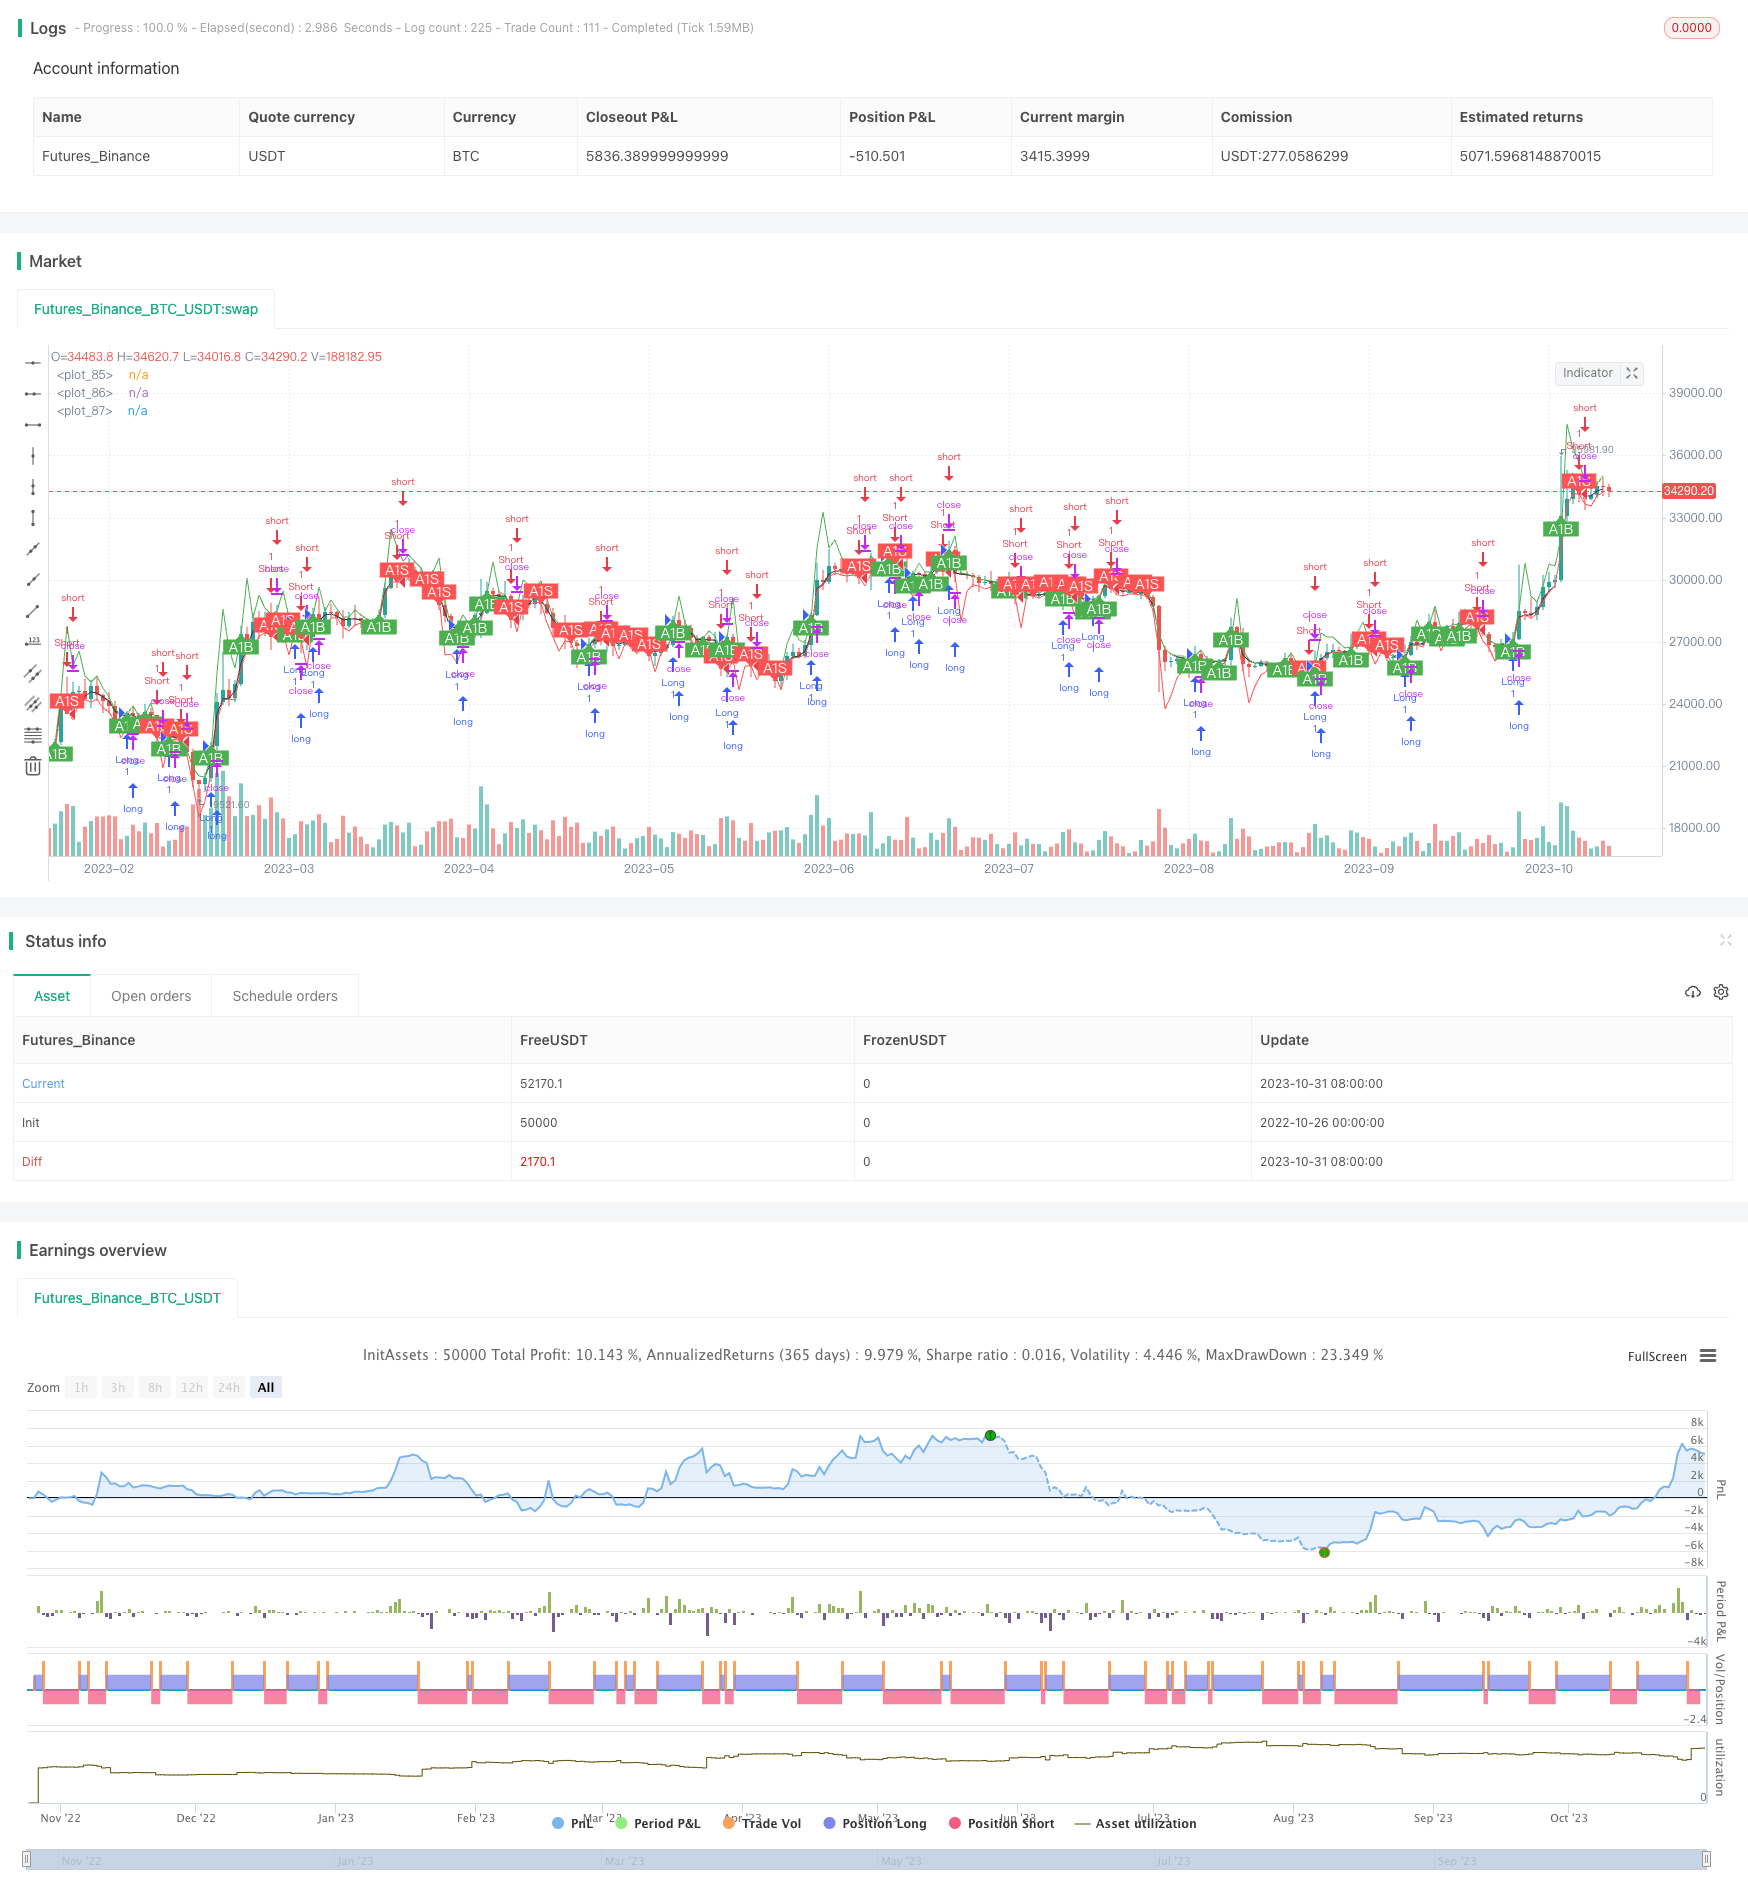
Overview
The Adaptive Moving Average Channel Breakout Strategy is a trend-following breakout strategy based on the Adaptive Moving Average (AMA) and an adaptive channel range for generating trading signals. It uses the AMA to determine the current price trend direction and adaptive channel levels to detect price breakout signals for timely entries and exits.
Strategy Principle
The core indicator of this strategy is the Adaptive Moving Average (AMA), which is used to capture the price trend. The AMA is calculated as:
AMA(t) = α(t-1) * P(t) + [1 - α(t-1)] * AMA(t-1)
Where P(t) is the current price, and α(t) is the smoothing constant between 0 and 1. α(t) is dynamically adjusted according to certain rules to control the sensitivity of the AMA to price changes. Specifically, α(t) is proportional to the deviation SNRT between AMA and price, which is calculated as:
SNRT = (P(t) - AMA(t-1)) / AMA(t-1)
Thus, as price fluctuations increase, α(t) will increase to make the AMA more responsive; when fluctuations decrease, α(t) will decrease to make the AMA smoother.
Based on the AMA, the strategy builds an adaptive channel range to detect price breakout signals. The upper and lower channel levels are:
Upper: H(t) = (1 + β*H(t-1)) * AMA(t)
Lower: L(t) = (1 - β*L(t-1)) * AMA(t)
Where β is an adjustable parameter controlling the channel width. Finally, the strategy generates trades based on price breakouts of the channel levels:
Enter long when price breaks above the upper level.
Enter short when price breaks below the lower level.
Otherwise, stay flat.
Advantage Analysis
The advantages of this strategy include:
The AMA is more flexible in capturing price trends compared to simple moving averages, especially in volatile markets.
The adaptive channel can dynamically adjust its width, expanding when the trend is unclear and narrowing when a trend emerges.
Price breakout signals can timely capture trend starts with higher win rates.
The logic is simple and clear, easy to understand and automate for quantitative trading.
Risk Analysis
The risks of this strategy include:
Improper AMA parameters may miss price trends or generate false signals.
The adaptive channel parameters like β need careful tuning, otherwise too much whipsaw or missed trends may occur.
Price breakouts are susceptible to false breaks, requiring more filters.
The strategy does not incorporate risk management or stop loss mechanisms.
Optimization Directions
The strategy can be optimized by:
Improving the α calculation to make the AMA more responsive.
Adding further confirmation after initial breakouts to avoid false signals.
Applying filters like volume or volatility to validate breakout validity.
Incorporating trailing stop loss to lock in profits and control risk.
Optimizing position sizing for different asset classes.
Conclusion
In summary, the Adaptive Moving Average Channel Breakout Strategy is a simple and practical trend-following breakout strategy. It uses the flexible AMA to track price trends and an adaptive channel to detect breakout signals. The strategy has some advantages but also potential risks. With optimizations like parameter tuning, adding filters, and improving stops, it can become more robust. Overall, it provides a solid baseline model for quantitative trading.
Parameters
| Name | Default | What it controls |
|---|---|---|
| v_input_1 | 2019 | Backtest Start Year |
| v_input_2 | 6 | Backtest Start Month |
| v_input_3 | true | Backtest Start Day |
| v_input_4 | 2019 | Backtest Stop Year |
| v_input_5 | 12 | Backtest Stop Month |
| v_input_6 | 31 | Backtest Stop Day |
| v_input_7 | true | Color Background? |
| v_input_8_close | 0 | Price Source:: close | high | low | open | hl2 | hlc3 | hlcc4 | ohlc4 |
| v_input_9 | 2.1 | SNR Factor: |
| v_input_10 | 5 | Sensitivity Lookback: |
| v_input_11 | 2.1 | Beta: |
| v_input_12 | 0.001 | Offset Label: |
Source Pine Script
/*backtest
start: 2022-10-26 00:00:00
end: 2023-11-01 00:00:00
period: 1d
basePeriod: 1h
exchanges: [{"eid":"Futures_Binance","currency":"BTC_USDT"}]
*/

//@version=4

// CryptoStatistical - 2019
// AMA Strategy Channel Breakout Strategy from E. Durenard - Professional Automated Trading
// https://www.amazon.com/Professional-Automated-Trading-Theory-Practice/dp/1118129857

strategy(title="[CS] AMA Strategy - Channel Break Out", shorttitle="AMA_ChannelBreakout_Strategy", initial_capital = 1000, overlay=true, pyramiding = 0, calc_on_every_tick=false, calc_on_order_fills=false, commission_type= strategy.commission.percent, commission_value = 0.08, currency=currency.USD)
testStartYear = input(2019, "Backtest Start Year")
testStartMonth = input(6, "Backtest Start Month")
testStartDay = input(1, "Backtest Start Day")
testPeriodStart = timestamp(testStartYear,testStartMonth,testStartDay,0,0)

testStopYear = input(2019, "Backtest Stop Year")
testStopMonth = input(12, "Backtest Stop Month")
testStopDay = input(31, "Backtest Stop Day")
testPeriodStop = timestamp(testStopYear,testStopMonth,testStopDay,0,0)

testPeriodBackground = input(title="Color Background?", type=input.bool, defval=true)
testPeriodBackgroundColor = testPeriodBackground and (time >= testPeriodStart) and (time <= testPeriodStop) ? #00FF00 : na
bgcolor(testPeriodBackgroundColor, transp=95)

testPeriod() =>  true

price = input(title='Price Source:', type=input.source, defval=close)

ama = price
hb = price
lb = price

// Static model parameters
minfactor = 0.
maxfactor = 1.
deviation_max = 1.
deviation_min = 1.
beta_hb = 1.
beta_lb = 1.
snr = 1.

normalized_atan= 0.
alpha = 0.5
// Suggested snr-factor from .5 upto 3.1 by .3 to find best parameter
snrfactor = input(title='SNR Factor:', type=input.float, minval=0.6, maxval=3.3, step=0.3, defval=2.1)

// Sensitivity Lookback search for the best perdiod from 5 to 20
lookback = input(title='Sensitivity Lookback:', type=input.integer, defval=5)

// Suggested Beta from .5 below 4.5 by .3, usually in the range 1.2, 1.5
beta = input(title='Beta:', type=input.float, minval=0.6, maxval=4.5, step=0.3, defval=2.1)

offsetlabel = input(title='Offset Label:', type=input.float, minval=0.001, maxval=0.03, step=0.001, defval=0.001)

// pi/2
pi2 = 1.5707963267948966

// Zero-lag resampled moving average (Durschner nwma)
f_nwma(_src, _period) =>
    fast = _period/2
    lambda = _period/fast
    alpha = lambda * (_period - 1)/(_period - lambda)
    average1 = wma(_src,_period)
    average2 = wma(average1,fast)
    nwma = (1+alpha)*average1 - alpha*average2

ama := alpha[1]*price + (1-alpha[1])*nz(ama[1])

deviation_max := alpha[1]*max((price[0] - price[1])/price[1],0) + (1-alpha[1])*nz(deviation_max[1])
deviation_min := -alpha[1]*min((price[0] - price[1])/price[1],0) + (1-alpha[1])*nz(deviation_min[1])

beta_hb := beta*deviation_max
beta_lb := beta*deviation_min
hb := (1 + beta_hb[1])*ama
lb := (1 - beta_lb[1])*ama

snr := if price > hb
    ((price - ama[1])/ama[1])/beta_lb
else
    if price < lb
        -((price - ama[1])/ama[1])/beta_hb
    else
        0

normalized_atan := (atan(snrfactor*snr) + pi2)/(2*pi2)
alpha := f_nwma(minfactor + (maxfactor - minfactor)*normalized_atan, lookback)

plot(ama, color=color.black)
plot(hb, color=color.green)
plot(lb, color=color.red)

// Buy Condition Var
bc = false
// Sell Condition Var
sc = false
d = color.black

// Buy Condition
if(price > hb)
    bc := true
    d := color.green

// Sell Condition
if(price < lb)
    sc := true
    d := color.red

if(testPeriod())
    strategy.entry("Long", strategy.long, when = bc)
    strategy.entry("Short", strategy.short, when = sc)

alertcondition(bc, title='BuyCondition', message='Buy')
alertcondition(sc, title='SellCondition', message='Sell')

plotshape(title='Buy', series=bc ? price * (1 - offsetlabel) : na, text='A1B', style=shape.labelup, location=location.absolute, color=d, textcolor=color.white, offset=0)
plotshape(title='Sell', series=sc ? price * (1 + offsetlabel) : na, text='A1S', style=shape.labeldown, location=location.absolute, color=d, textcolor=color.white, offset=0)Published by ChaoZhang on the FMZ strategy square · last modified 2023-11-02. Collected in the Quant Trading Vault. Unvalidated research: re-test with your own data and costs before trusting it.
Build this with AgenKit
A spec is not a trading system. Paste this into your coding agent and AgenKit runs a specialist team — architecture, test-first build, risk gates, review — with paper trading on by default.
/agenkit build a production-grade trading bot with a backtest engine, risk controls and paper trading by default from strategies/Adaptive-Moving-Average-Channel-Breakout-Strategy.md- npx agenkit install engineering-kit in your project
- Paste the command into your agent and approve each phase
- Get tests, backtest, risk controls and a paper-trading switch
Understand it first
Before you run this, read the lesson behind the idea and how to backtest it honestly. Specs like this one are the survivors of an unknown number of trials; deflate their results accordingly.
Related specs
- 5 Day Moving Average Channel Breakout Strategy Combined With Mileage ConceptPine Script · Breakout · 1d
- Adaptive Bollinger Breakout with Moving Average Quantitative Strategy SystemPine Script · Breakout · 1h
- Adaptive Multi Period Trading Strategy Based on Wave Trend Momentum BreakoutPine Script · Breakout · 2h
- Adaptive Trading Strategy Based on ADX IndicatorPine Script · Breakout · 1d
- Average Line Breakthrough StrategyPine Script · Breakout · 1d
- BB Breakout StrategyPine Script · Breakout · 1d