Strategy vault / Mean reversion
Advanced Five Day Cross Analysis Strategy Based on RSI and MACD Integration
This strategy is a quantitative trading approach that combines the Relative Strength Index (RSI) and Moving Average Convergence Divergence (MACD) indicators. The core concept involves monitoring RSI…
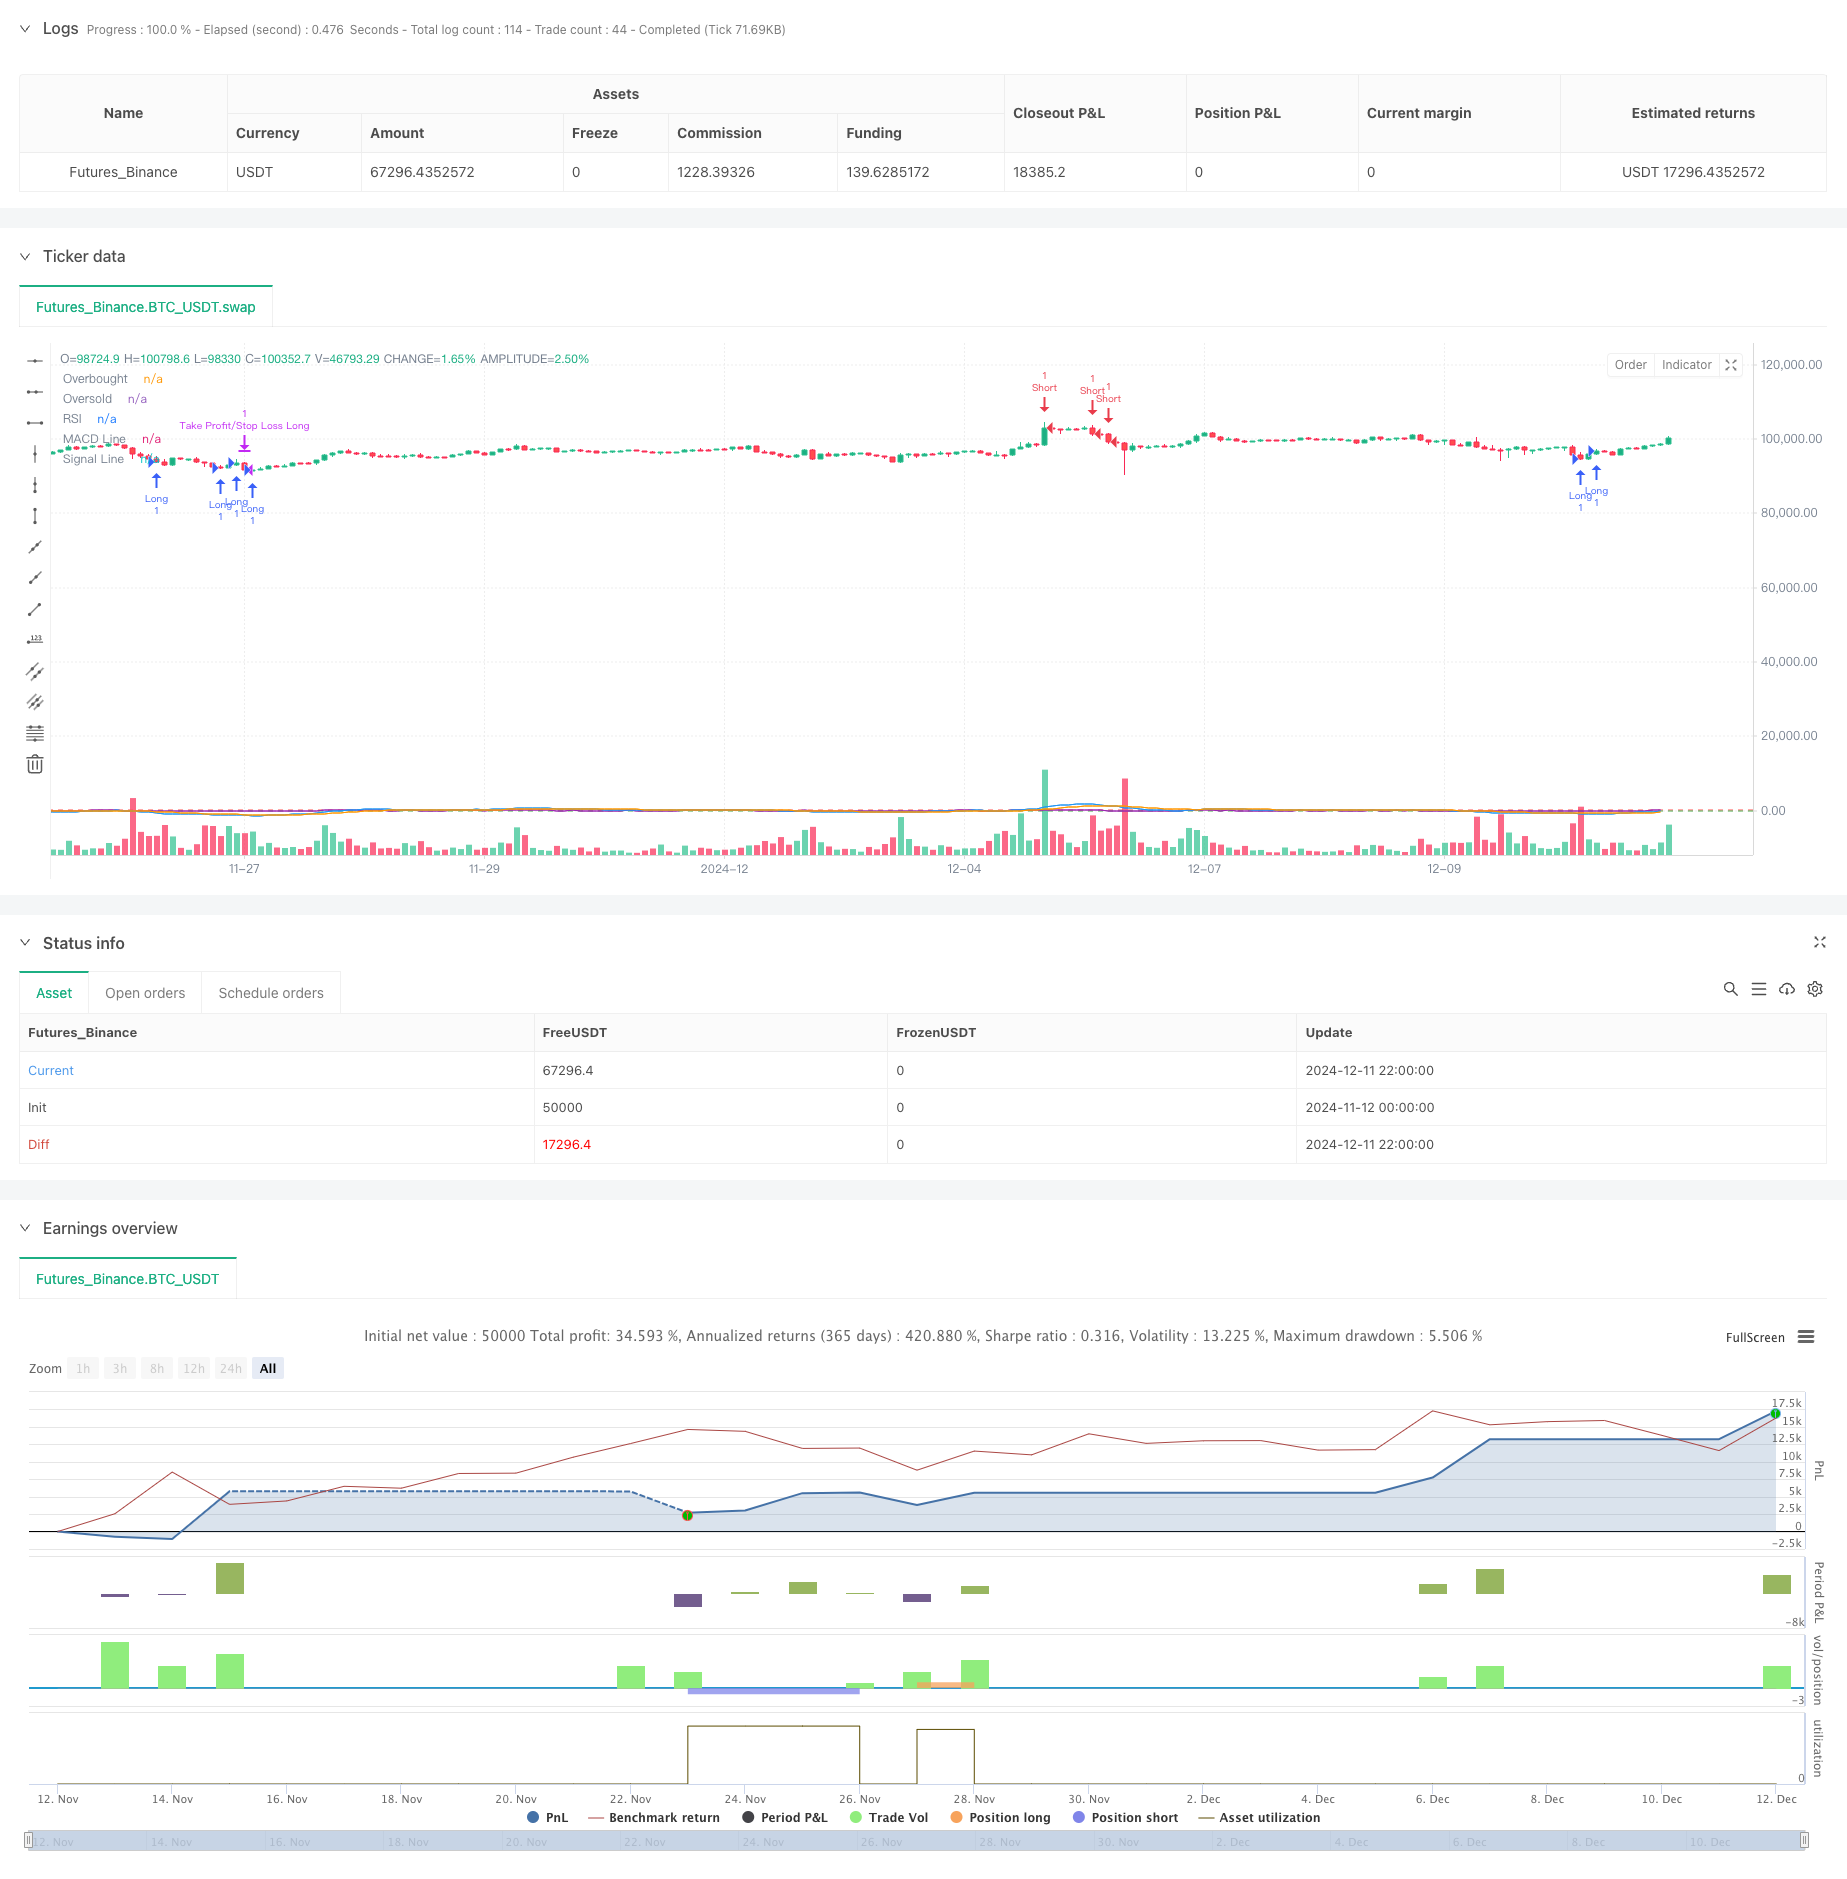
Overview
This strategy is a quantitative trading approach that combines the Relative Strength Index (RSI) and Moving Average Convergence Divergence (MACD) indicators. The core concept involves monitoring RSI overbought/oversold zones while confirming trends through MACD crossovers within a 5-period window. This methodology provides more accurate trading signals while effectively reducing risks from false signals.
Strategy Principles
The strategy is built on several key components:
- RSI indicator uses a 14-period parameter to identify potential reversals when assets are overbought (>70) or oversold (<30).
- MACD employs the classic 12-26-9 parameter combination, looking for crossovers between MACD and signal lines within 5 trading periods.
- Entry logic includes two conditions:
- Long entry: RSI's 5-period low drops below 30, coinciding with an upward MACD crossover within 5 periods.
- Short entry: RSI's 5-period high exceeds 70, coinciding with a downward MACD crossover within 5 periods.
- Risk management implements symmetrical 2% stop-loss and 2% take-profit levels.
Strategy Advantages
- Multi-indicator cross-validation enhances signal reliability by combining RSI and MACD to filter out false signals from single indicators.
- Flexible 5-day observation window captures more trading opportunities while avoiding missing crucial market turning points.
- Symmetrical stop-loss/take-profit setup facilitates effective money management and risk control per trade.
- Simple and clear strategy logic makes it easy to understand and execute, suitable as a foundation for further optimization.
Strategy Risks
- Both RSI and MACD are lagging indicators, potentially causing delays in volatile markets.
- Fixed stop-loss/take-profit percentages may not suit all market conditions and require adjustment as volatility changes.
- The 5-day observation period might be too short in certain market conditions, leading to overtrading.
- Lack of volume consideration may generate inaccurate signals in low-liquidity environments.
Optimization Directions
- Implement volatility-adaptive mechanisms to dynamically adjust stop-loss/take-profit levels.
- Incorporate volume indicators as additional confirmation to enhance signal reliability.
- Develop dynamic period selection mechanisms to automatically adjust the observation window based on market conditions.
- Add trend filters to avoid counter-trend trading in strong trend markets.
- Consider implementing time filters to avoid trading during highly volatile market opening and closing periods.
Summary
The strategy creates a relatively complete trading system by combining RSI and MACD indicators with flexible entry conditions and risk control mechanisms. While there are areas for optimization, the basic framework offers good scalability and, through further refinement and improvement, has the potential to evolve into a more robust trading strategy.
Source Pine Script
/*backtest
start: 2024-11-12 00:00:00
end: 2024-12-12 00:00:00
period: 2h
basePeriod: 2h
exchanges: [{"eid":"Futures_Binance","currency":"BTC_USDT"}]
*/

//@version=5
strategy("MACD & RSI Strategy with SL/TP and Flexible Entry (5 bars)", overlay=true)

// Параметры для RSI и MACD
rsiLength = 14
overbought = 70
oversold = 30
[macdLine, signalLine, _] = ta.macd(close, 12, 26, 9)

// Рассчитаем RSI
rsi = ta.rsi(close, rsiLength)

// Проверка пересечения MACD
macdCrossOver = ta.crossover(macdLine, signalLine)
macdCrossUnder = ta.crossunder(macdLine, signalLine)

// Логика для проверки пересечения MACD за последние 5 баров
var bool macdCrossOverRecent = false
var bool macdCrossUnderRecent = false

// Проверяем пересечения за последние 5 баров
for i = 0 to 4
    if macdCrossOver[i]
        macdCrossOverRecent := true
    if macdCrossUnder[i]
        macdCrossUnderRecent := true

// Условия для шортовой сделки: RSI выше 70 (перекупленность) + пересечение MACD за последние 5 баров
shortCondition = ta.highest(rsi, 5) > overbought and macdCrossOverRecent

// Условия для лонговой сделки: RSI ниже 30 (перепроданность) + пересечение MACD за последние 5 баров
longCondition = ta.lowest(rsi, 5) < oversold and macdCrossUnderRecent

// Процент для стоп-лосса и тейк-профита
takeProfitPercent = 0.02
stopLossPercent = 0.02

// Открытие шортовой позиции
if (shortCondition)
    strategy.entry("Short", strategy.short)

// Открытие лонговой позиции
if (longCondition)
    strategy.entry("Long", strategy.long)

// Рассчитываем стоп-лосс и тейк-профит для шорта
shortStopLoss = strategy.position_avg_price * (1 + stopLossPercent)
shortTakeProfit = strategy.position_avg_price * (1 - takeProfitPercent)

// Рассчитываем стоп-лосс и тейк-профит для лонга
longStopLoss = strategy.position_avg_price * (1 - stopLossPercent)
longTakeProfit = strategy.position_avg_price * (1 + takeProfitPercent)

// Устанавливаем выход по стоп-лоссу и тейк-профиту для шортов
if (strategy.position_size < 0) // Проверяем, что открыта шортовая позиция
    strategy.exit("Take Profit/Stop Loss Short", "Short", stop=shortStopLoss, limit=shortTakeProfit)

// Устанавливаем выход по стоп-лоссу и тейк-профиту для лонгов
if (strategy.position_size > 0) // Проверяем, что открыта лонговая позиция
    strategy.exit("Take Profit/Stop Loss Long", "Long", stop=longStopLoss, limit=longTakeProfit)

// Графики для отображения RSI и MACD
plot(rsi, "RSI", color=color.purple)
hline(overbought, "Overbought", color=color.red)
hline(oversold, "Oversold", color=color.green)

plot(macdLine, "MACD Line", color=color.blue)
plot(signalLine, "Signal Line", color=color.orange)
Published by ChaoZhang on the FMZ strategy square · last modified 2024-12-13. Collected in the Quant Trading Vault. Unvalidated research: re-test with your own data and costs before trusting it.
Build this with AgenKit
A spec is not a trading system. Paste this into your coding agent and AgenKit runs a specialist team — architecture, test-first build, risk gates, review — with paper trading on by default.
/agenkit build a production-grade trading bot with a backtest engine, risk controls and paper trading by default from strategies/Advanced-Five-Day-Cross-Analysis-Strategy-Based-on-RSI-and-MACD-Integration.md- npx agenkit install engineering-kit in your project
- Paste the command into your agent and approve each phase
- Get tests, backtest, risk controls and a paper-trading switch
Understand it first
Before you run this, read the lesson behind the idea and how to backtest it honestly. Specs like this one are the survivors of an unknown number of trials; deflate their results accordingly.
Related specs
- ATR and EMA based Dynamic Take Profit and Stop Loss Adaptive StrategyPine Script · Mean reversion · 1h
- Advanced 15 Minute Chart Trading Signal StrategyPine Script · Mean reversion · 3h
- BONK Multi Factor Trading StrategyPine Script · Mean reversion · 1d
- Bitcoin Futures Position Trading StrategyPine Script · Mean reversion · 1h
- Chaikin Oscillator StrategyPine Script · Mean reversion · 3h
- Customizable Non Repainting HTF MACD MFI Scalable Bot StrategyPine Script · Mean reversion · 1d