Advanced Multi Pattern Breakout Trading Strategy
This strategy is an advanced trading system based on multiple technical pattern recognition, combining candlestick pattern analysis with breakout trading principles. The strategy identifies and trades multiple…
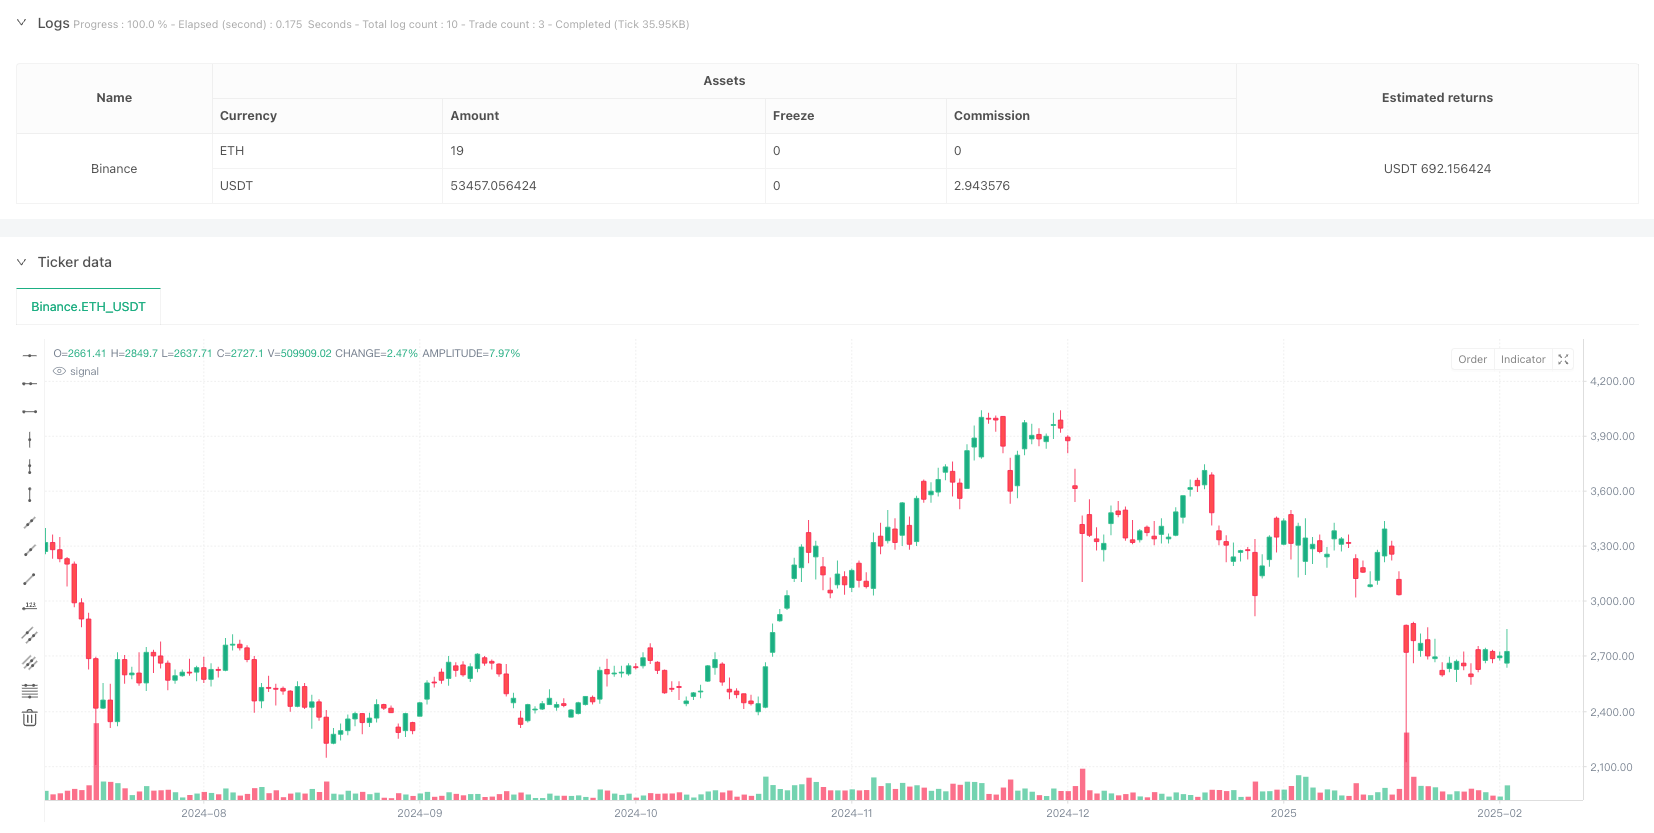
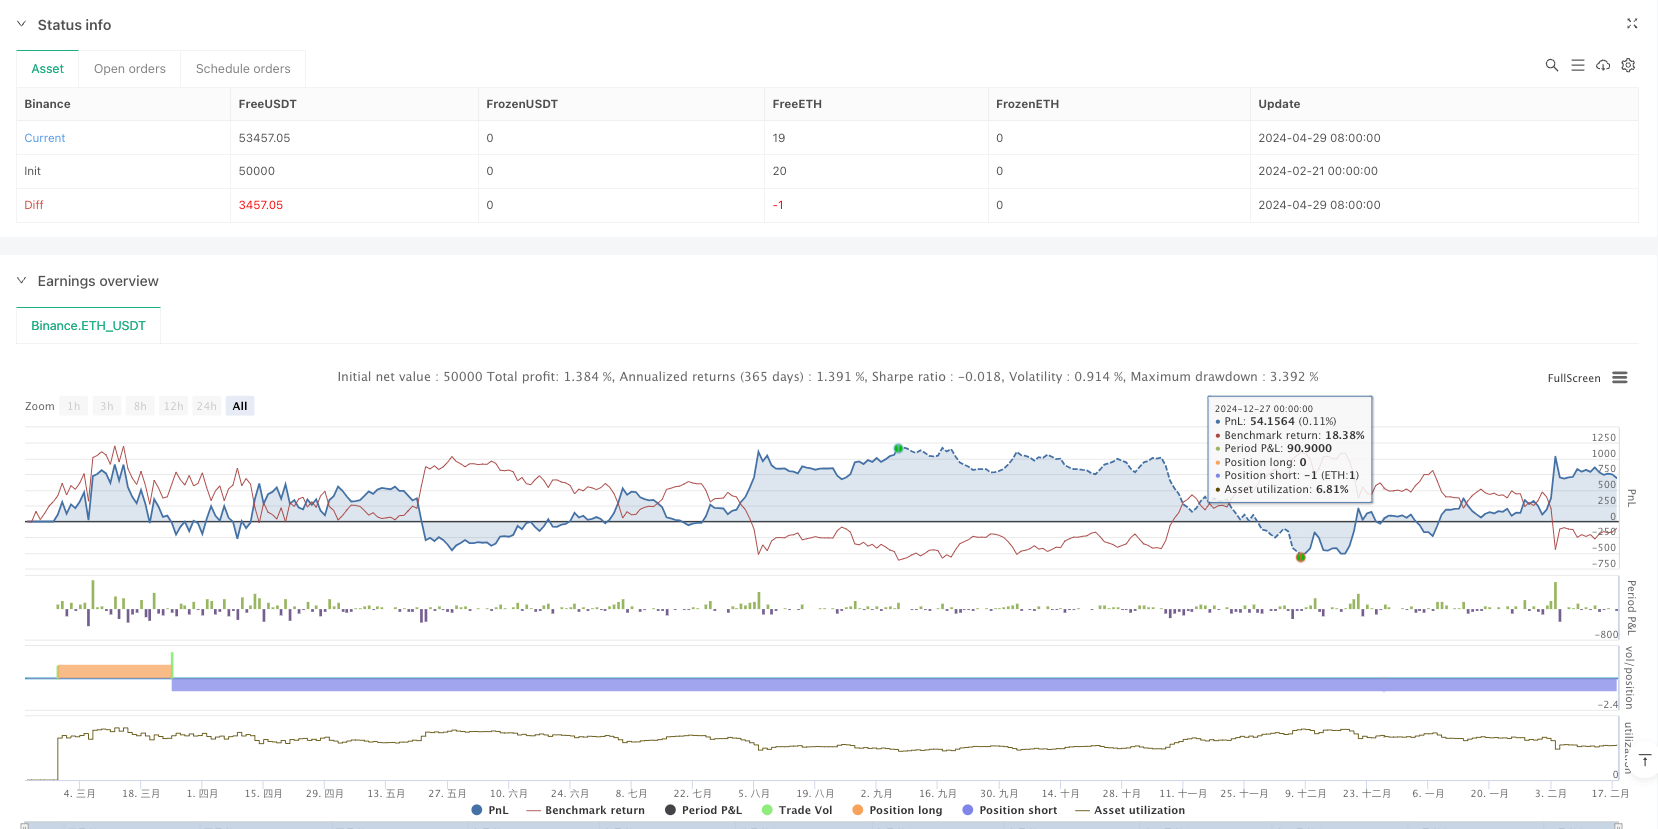
Overview
This strategy is an advanced trading system based on multiple technical pattern recognition, combining candlestick pattern analysis with breakout trading principles. The strategy identifies and trades multiple classic candlestick patterns, including Doji, Hammer, and Pin Bar formations, while incorporating a dual-candle confirmation system to enhance signal reliability.
Strategy Principles
The core logic of the strategy is built on several key elements:
- Pattern Recognition System - Uses precise mathematical calculations to identify three key candlestick patterns: Doji, Hammer, and Pin Bar. Each pattern has its unique identification criteria, such as the relationship between body and shadow ratios.
- Breakout Confirmation Mechanism - Employs a dual-candle confirmation system, requiring the second candle to break above the high (for longs) or below the low (for shorts) of the previous candle to reduce false signals.
- Target Price Determination - Uses an adjustable lookback period (default 20 periods) to determine recent highs or lows as target prices, giving the strategy dynamic adaptability.
Strategy Advantages
- Multiple Pattern Recognition - Significantly increases potential trading opportunities by monitoring multiple technical patterns simultaneously.
- Signal Confirmation Mechanism - The dual-candle confirmation system effectively reduces the risk of false signals.
- Visual Trading Ranges - Uses colored boxes to mark trading ranges, making trading targets more intuitive.
- Flexible Parameter Adjustment - Parameters like lookback period can be adjusted according to different market conditions.
Strategy Risks
- Market Volatility Risk - May generate false breakout signals during high volatility periods.
- Slippage Risk - Actual execution prices may significantly deviate from signal prices in less liquid markets.
- Trend Reversal Risk - Reversal signals in strong trend markets may lead to substantial losses.
Optimization Directions
- Volume Confirmation Integration - Recommend incorporating volume analysis into the pattern recognition system to improve signal reliability.
- Dynamic Stop-Loss Mechanism - Can implement dynamic stop-loss levels based on ATR or volatility.
- Market Environment Filtering - Add trend strength indicators to filter out reversal signals during strong trends.
- Timeframe Optimization - Consider signal confirmation across multiple timeframes.
Summary
The strategy establishes a comprehensive trading system by combining multiple technical pattern analysis with breakout trading principles. Its strengths lie in multi-dimensional signal confirmation and flexible parameter adjustment, while attention must be paid to market volatility and liquidity risks. Through the suggested optimization directions, the strategy's stability and reliability can be further enhanced.
Source Pine Script
/*backtest
start: 2024-02-21 00:00:00
end: 2025-02-18 08:00:00
period: 1d
basePeriod: 1d
exchanges: [{"eid":"Binance","currency":"ETH_USDT"}]
*/

//@version=5
strategy("Target(Made by Karan)", overlay=true)

// Input for lookback period
lookbackPeriod = input.int(20, title="Lookback Period for Recent High/Low", minval=1)

// --- Pattern Identification Functions ---

// Identify Doji pattern
isDoji(open, high, low, close) =>
    bodySize = math.abs(close - open)
    rangeSize = high - low
    bodySize <= rangeSize * 0.1  // Small body compared to total range

// Identify Hammer pattern
isHammer(open, high, low, close) =>
    bodySize = math.abs(close - open)
    lowerShadow = open - low
    upperShadow = high - close
    bodySize <= (high - low) * 0.3 and lowerShadow > 2 * bodySize and upperShadow <= bodySize * 0.3  // Long lower shadow, small upper shadow

// Identify Pin Bar pattern
isPinBar(open, high, low, close) =>
    bodySize = math.abs(close - open)
    rangeSize = high - low
    upperShadow = high - math.max(open, close)
    lowerShadow = math.min(open, close) - low
    (upperShadow > bodySize * 2 and lowerShadow < bodySize) or (lowerShadow > bodySize * 2 and upperShadow < bodySize)  // Long shadow on one side

// --- Candle Breakout Logic ---

// Identify the first green candle (Bullish)
is_first_green_candle = close > open

// Identify the breakout above the high of the first green candle
breakout_green_candle = ta.crossover(close, high[1]) and is_first_green_candle[1]

// Identify the second green candle confirming the breakout
second_green_candle = close > open and breakout_green_candle[1]

// Find the recent high (for the target)
recent_high = ta.highest(high, lookbackPeriod)  // Use adjustable lookback period

// Plot the green rectangle box if the conditions are met and generate buy signal
var float start_price_green = na
var float end_price_green = na

if second_green_candle
    start_price_green := low[1]  // Low of the breakout green candle
    end_price_green := recent_high  // The most recent high in the lookback period
    strategy.entry("Buy", strategy.long)  // Buy signal

// --- Red Candle Logic ---

// Identify the first red candle (Bearish)
is_first_red_candle = close < open

// Identify the breakdown below the low of the first red candle
breakdown_red_candle = ta.crossunder(close, low[1]) and is_first_red_candle[1]

// Identify the second red candle confirming the breakdown
second_red_candle = close < open and breakdown_red_candle[1]

// Find the recent low (for the target)
recent_low = ta.lowest(low, lookbackPeriod)  // Use adjustable lookback period

// Plot the red rectangle box if the conditions are met and generate sell signal
var float start_price_red = na
var float end_price_red = na

if second_red_candle
    start_price_red := high[1]  // High of the breakout red candle
    end_price_red := recent_low  // The most recent low in the lookback period
    strategy.entry("Sell", strategy.short)  // Sell signal

// --- Pattern Breakout Logic for Doji, Hammer, Pin Bar ---

// Detect breakout of Doji, Hammer, or Pin Bar patterns
var float start_price_pattern = na
var float end_price_pattern = na

// Check for Doji breakout
if isDoji(open, high, low, close) and ta.crossover(close, high[1])
    start_price_pattern := low[1]  // Low of the breakout Doji
    end_price_pattern := recent_high  // The most recent high in the lookback period
    box.new(left = bar_index[1], right = bar_index, top = end_price_pattern, bottom = start_price_pattern, border_color = color.new(color.blue, 0), bgcolor = color.new(color.blue, 80))
    strategy.entry("Buy Doji", strategy.long)  // Buy signal for Doji breakout

// Check for Hammer breakout
if isHammer(open, high, low, close) and ta.crossover(close, high[1])
    start_price_pattern := low[1]  // Low of the breakout Hammer
    end_price_pattern := recent_high  // The most recent high in the lookback period
    box.new(left = bar_index[1], right = bar_index, top = end_price_pattern, bottom = start_price_pattern, border_color = color.new(color.blue, 0), bgcolor = color.new(color.blue, 80))
    strategy.entry("Buy Hammer", strategy.long)  // Buy signal for Hammer breakout

// Check for Pin Bar breakout
if isPinBar(open, high, low, close) and ta.crossover(close, high[1])
    start_price_pattern := low[1]  // Low of the breakout Pin Bar
    end_price_pattern := recent_high  // The most recent high in the lookback period
    box.new(left = bar_index[1], right = bar_index, top = end_price_pattern, bottom = start_price_pattern, border_color = color.new(color.blue, 0), bgcolor = color.new(color.blue, 80))
    strategy.entry("Buy Pin Bar", strategy.long)  // Buy signal for Pin Bar breakout

// Check for bearish Doji breakout
if isDoji(open, high, low, close) and ta.crossunder(close, low[1])
    start_price_pattern := high[1]  // High of the breakdown Doji
    end_price_pattern := recent_low  // The most recent low in the lookback period
    box.new(left = bar_index[1], right = bar_index, top = start_price_pattern, bottom = end_price_pattern, border_color = color.new(color.orange, 0), bgcolor = color.new(color.orange, 80))
    strategy.entry("Sell Doji", strategy.short)  // Sell signal for Doji breakdown

// Check for bearish Hammer breakout
if isHammer(open, high, low, close) and ta.crossunder(close, low[1])
    start_price_pattern := high[1]  // High of the breakdown Hammer
    end_price_pattern := recent_low  // The most recent low in the lookback period
    box.new(left = bar_index[1], right = bar_index, top = start_price_pattern, bottom = end_price_pattern, border_color = color.new(color.orange, 0), bgcolor = color.new(color.orange, 80))
    strategy.entry("Sell Hammer", strategy.short)  // Sell signal for Hammer breakdown

// Check for bearish Pin Bar breakout
if isPinBar(open, high, low, close) and ta.crossunder(close, low[1])
    start_price_pattern := high[1]  // High of the breakdown Pin Bar
    end_price_pattern := recent_low  // The most recent low in the lookback period
    box.new(left = bar_index[1], right = bar_index, top = start_price_pattern, bottom = end_price_pattern, border_color = color.new(color.orange, 0), bgcolor = color.new(color.orange, 80))
    strategy.entry("Sell Pin Bar", strategy.short)  // Sell signal for Pin Bar breakdown

// Optional: Plot shapes for the green sequence of candles
plotshape(series=is_first_green_candle, location=location.belowbar, color=color.green, style=shape.labelup, text="1st Green")
plotshape(series=breakout_green_candle, location=location.belowbar, color=color.blue, style=shape.labelup, text="Breakout")
plotshape(series=second_green_candle, location=location.belowbar, color=color.orange, style=shape.labelup, text="2nd Green")

// Optional: Plot shapes for the red sequence of candles
plotshape(series=is_first_red_candle, location=location.abovebar, color=color.red, style=shape.labeldown, text="1st Red")
plotshape(series=breakdown_red_candle, location=location.abovebar, color=color.blue, style=shape.labeldown, text="Breakdown")
plotshape(series=second_red_candle, location=location.abovebar, color=color.orange, style=shape.labeldown, text="2nd Red")
Published by ianzeng123 on the FMZ strategy square · last modified 2025-02-20. Collected in the Quant Trading Vault. Unvalidated research: re-test with your own data and costs before trusting it.
Build this with AgenKit
A spec is not a trading system. Paste this into your coding agent and AgenKit runs a specialist team — architecture, test-first build, risk gates, review — with paper trading on by default.
/agenkit build a production-grade trading bot with a backtest engine, risk controls and paper trading by default from strategies/Advanced-Multi-Pattern-Breakout-Trading-Strategy.md- npx agenkit install engineering-kit in your project
- Paste the command into your agent and approve each phase
- Get tests, backtest, risk controls and a paper-trading switch
Understand it first
Before you run this, read the lesson behind the idea and how to backtest it honestly. Specs like this one are the survivors of an unknown number of trials; deflate their results accordingly.
Related specs
- Flexible Long Short Trading Strategy Based on Keltner ChannelsPine Script · Breakout · 1d
- Momentum Breakout Trading Strategy 435896Pine Script · Breakout · 1d
- Multi Filter Trend Breakthrough Smart Moving Average Trading StrategyPine Script · Breakout · 1h
- Multi Indicator Trend Breakout Strategy with Dynamic Stop LossPine Script · Breakout · 1d
- Multi Technical Indicator Dynamic Wave Trading StrategyPine Script · Breakout · 1h
- Volatility Momentum Breakout Strategy with Trend and Momentum FiltersPine Script · Breakout · 10m