Advanced Quantitative Trading Strategy Combining Dynamic Bollinger Bands with PSAR Indicator
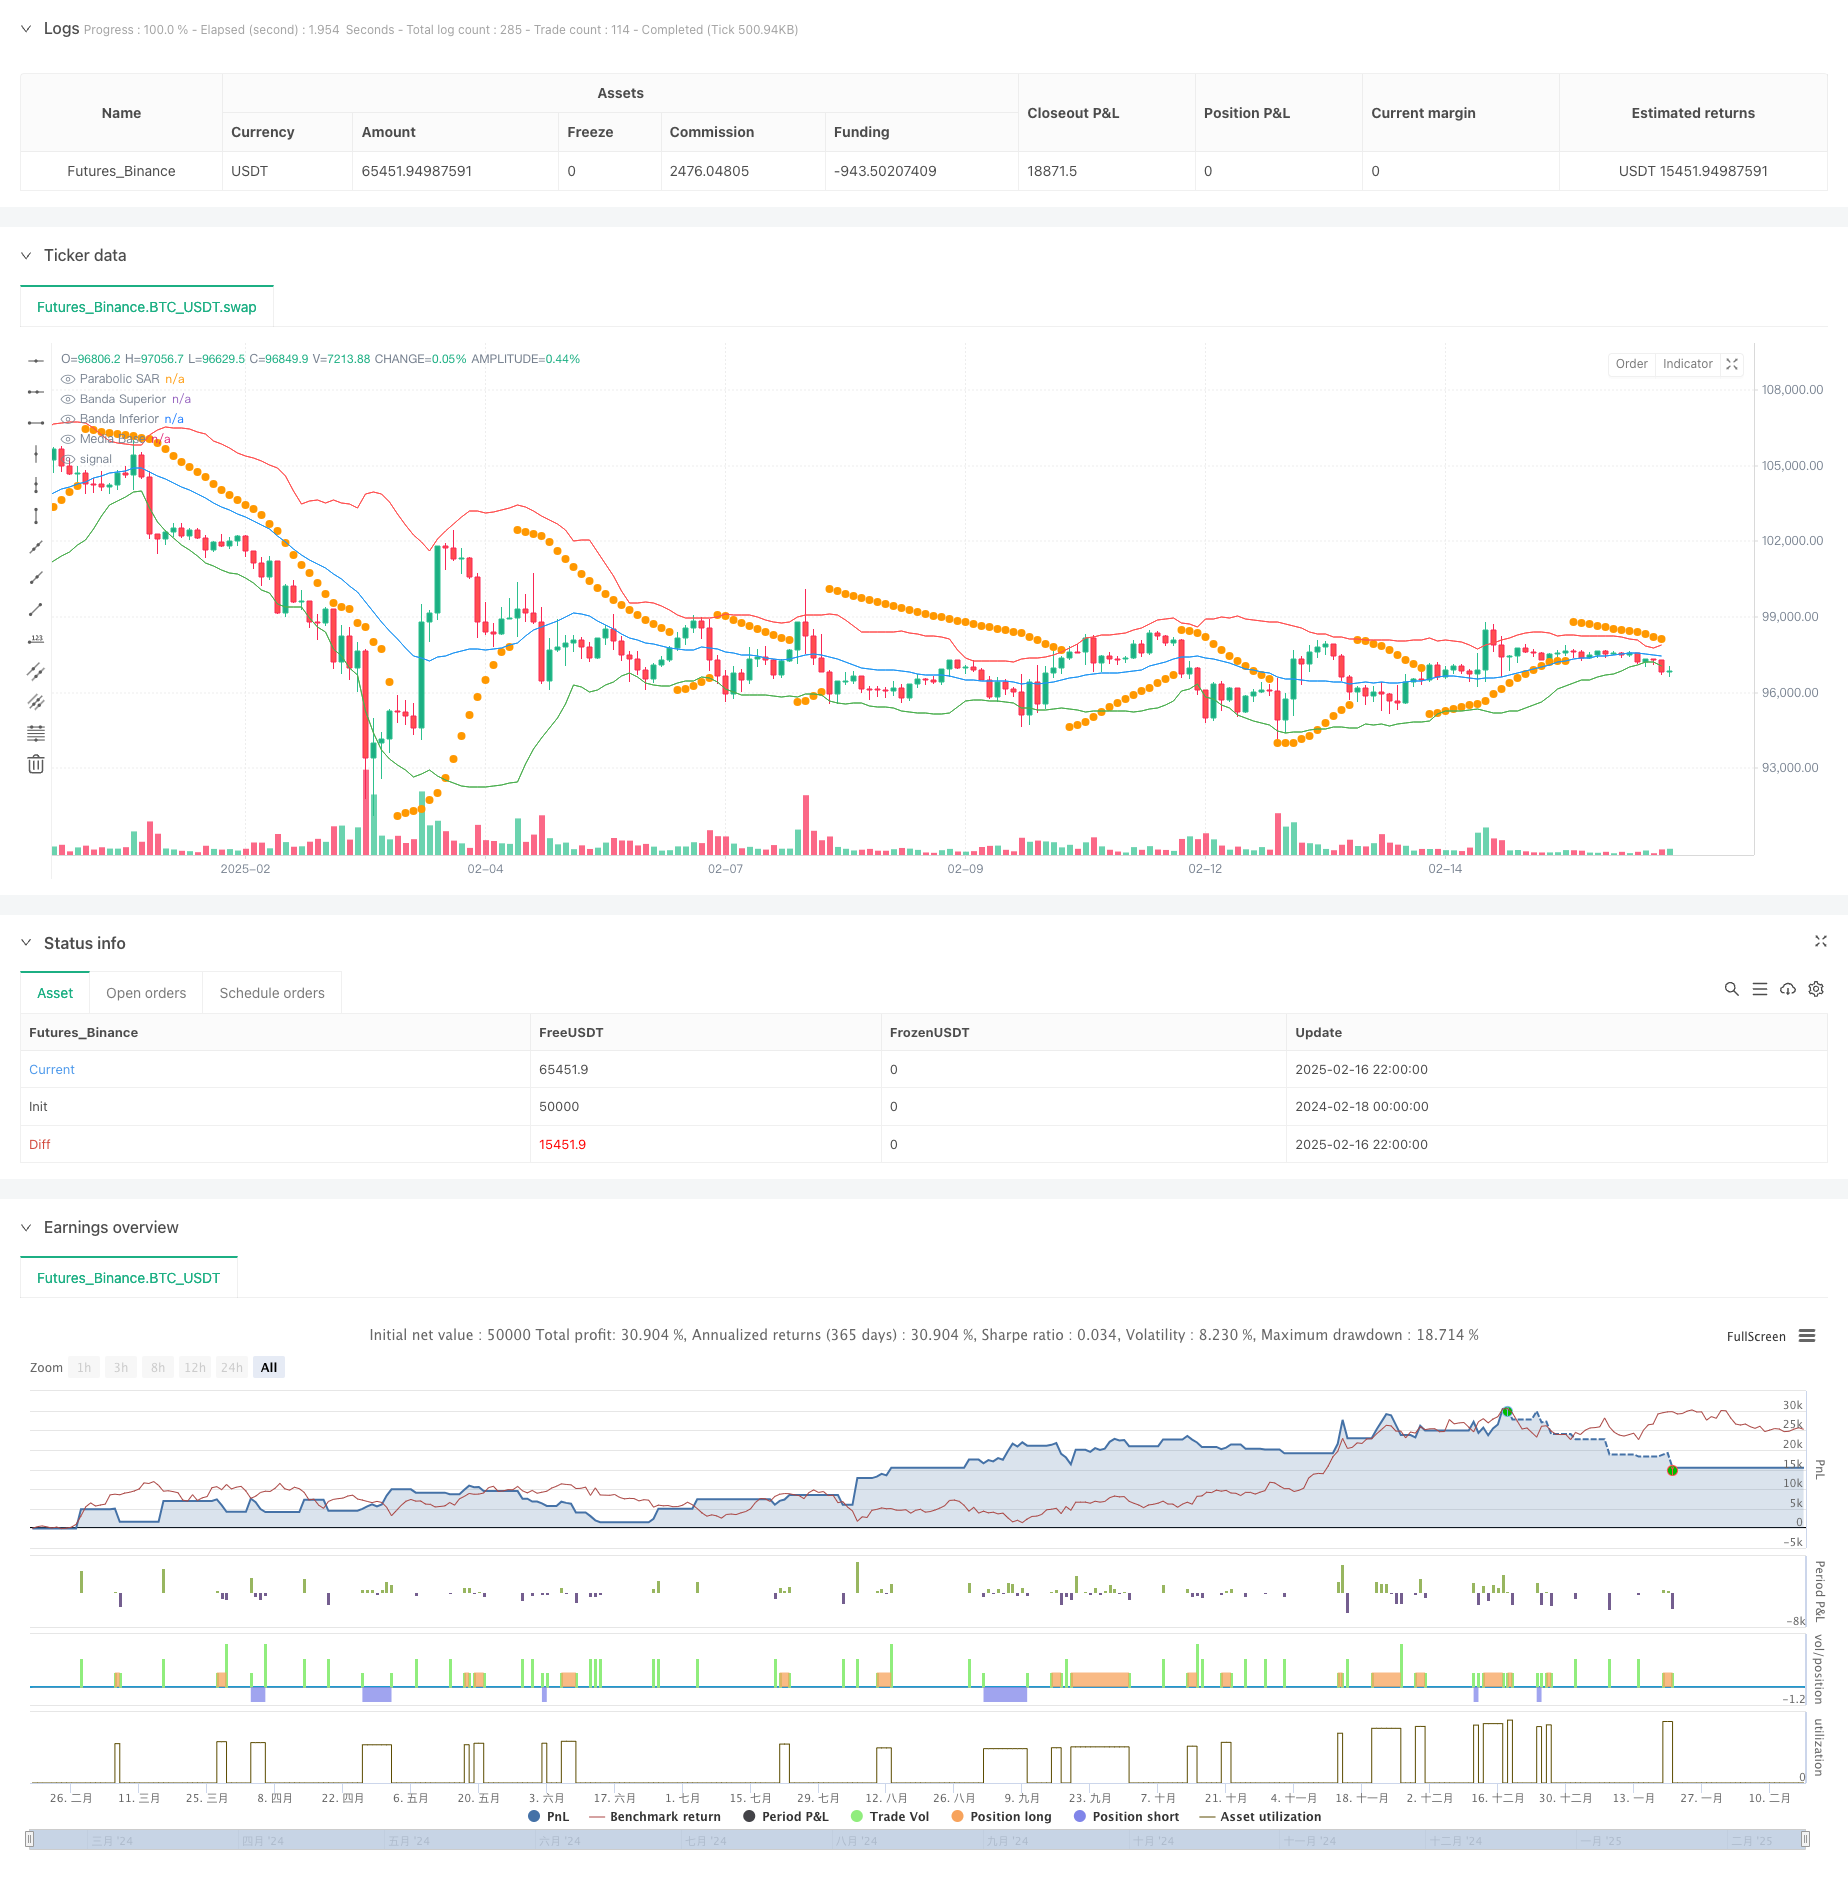
This is a comprehensive trading strategy that combines Bollinger Bands and Parabolic SAR (PSAR) indicators, utilizing a fixed risk-reward ratio for trade management. The strategy operates during intraday trading…
Overview
This is a comprehensive trading strategy that combines Bollinger Bands and Parabolic SAR (PSAR) indicators, utilizing a fixed risk-reward ratio for trade management. The strategy operates during intraday trading hours, identifying trading opportunities through price breakouts of Bollinger Bands and candlestick patterns, while using the PSAR indicator for trend confirmation. The strategy implements dynamic stop-loss and take-profit targets, maintaining a 1:3 risk-reward ratio.
Strategy Principles
The strategy employs multiple technical indicators for trade signal confirmation:
- Uses 20-period Bollinger Bands as the primary price volatility indicator
- Incorporates PSAR indicator (initial value 0.02, maximum 0.2) as a trend confirmation tool
- Calculates candlestick body ratio (body length/total length ≥0.33) to ensure signal reliability
- Executes trades within specified trading window (GMT-5 7:30-16:00)
- Long entry conditions: close above upper band with qualifying candle body ratio
- Short entry conditions: close below lower band with qualifying candle body ratio
Strategy Advantages
- Integration of multiple technical indicators enhances signal reliability
- Fixed risk-reward ratio (1:3) promotes long-term stable returns
- Time filtering prevents interference during low liquidity periods
- Candlestick body ratio filtering reduces false breakouts
- Dynamic stop-loss and take-profit targets adapt to market volatility
- Clear strategy logic facilitates understanding and optimization
Strategy Risks
- Potential slippage in high volatility markets
- Fixed risk-reward ratio might miss some profit opportunities
- Time filtering could miss important market moves
- Multiple indicators may lead to signal lag
- Consecutive losses possible in ranging markets
Strategy Optimization Directions
- Implement adaptive Bollinger Band periods for different market conditions
- Develop dynamic risk-reward ratio mechanism
- Add volume indicators for confirmation
- Optimize PSAR parameters for better trend following
- Incorporate market volatility filters
- Develop smarter time filtering mechanisms
Summary
The strategy creates a complete trading system through the combined use of Bollinger Bands, PSAR indicators, and candlestick analysis. Its core strength lies in the synergy of multiple technical indicators and strict risk management. While inherent risks exist, the suggested optimization directions can further enhance strategy stability and profitability. The strategy is particularly suitable for intraday traders, capable of generating stable returns while maintaining risk control.
Source Pine Script
/*backtest
start: 2024-02-18 00:00:00
end: 2025-02-17 00:00:00
period: 2h
basePeriod: 2h
exchanges: [{"eid":"Futures_Binance","currency":"BTC_USDT"}]
*/

//@version=6
strategy("Estrategia Bollinger con PSAR y TP Máximo/ Mínimo", overlay=true)

// Parámetros de las Bandas de Bollinger
bb_length = input.int(20, title="Periodo de Bandas de Bollinger", minval=1)
bb_stddev = input.float(2.0, title="Desviación Estándar", step=0.1)

// Parámetros del Parabolic SAR
psar_start = input.float(0.02, title="PSAR Factor Inicial", step=0.01)
psar_increment = input.float(0.02, title="PSAR Incremento", step=0.01)
psar_max = input.float(0.2, title="PSAR Máximo", step=0.01)

// Cálculo de Bandas de Bollinger
basis = ta.sma(close, bb_length)
upper_band = basis + bb_stddev * ta.stdev(close, bb_length)
lower_band = basis - bb_stddev * ta.stdev(close, bb_length)

// Cálculo del Parabolic SAR
psar = ta.sar(psar_start, psar_increment, psar_max)

// Cálculo del cuerpo de la vela
body_high = math.max(open, close)
body_low = math.min(open, close)
body_length = body_high - body_low
total_length = high - low
body_ratio = body_length / total_length

// Condiciones de Entrada
long_condition = close > upper_band and body_ratio >= 0.33
short_condition = close < lower_band and body_ratio >= 0.33

// Filtro de tiempo: Operar solo de 7:30 AM a 4:00 PM hora colombiana
start_time = timestamp("GMT-5", year, month, dayofmonth, 7, 30)
end_time = timestamp("GMT-5", year, month, dayofmonth, 16, 0)
time_condition = (time >= start_time) and (time <= end_time)

// Variables para mantener el TP máximo y mínimo
var float max_tp = na
var float min_tp = na
var float dynamic_stop = na

// Condiciones de Entrada y Salida
if (long_condition and time_condition)
    entry_price = close  // Precio de entrada
    stop_loss = low  // SL en el mínimo de la vela
    take_profit = entry_price + 3 * (entry_price - stop_loss)  // TP con relación 1:3
    strategy.entry("Compra", strategy.long)
    strategy.exit("Exit Compra", "Compra", stop=stop_loss, limit=take_profit)

    // Dibujar las etiquetas para SL y TP para la operación larga
    label.new(bar_index, stop_loss, text="SL: " + str.tostring(stop_loss), style=label.style_label_up, color=color.red, textcolor=color.white, size=size.small)
    label.new(bar_index, take_profit, text="TP: " + str.tostring(take_profit), style=label.style_label_down, color=color.green, textcolor=color.white, size=size.small)

if (short_condition and time_condition)
    entry_price = close  // Precio de entrada
    stop_loss = high  // SL en el máximo de la vela
    take_profit = entry_price - 3 * (stop_loss - entry_price)  // TP con relación 1:3
    strategy.entry("Venta", strategy.short)
    strategy.exit("Exit Venta", "Venta", stop=stop_loss, limit=take_profit)

    // Dibujar las etiquetas para SL y TP para la operación corta
    label.new(bar_index, stop_loss, text="SL: " + str.tostring(stop_loss), style=label.style_label_down, color=color.red, textcolor=color.white, size=size.small)
    label.new(bar_index, take_profit, text="TP: " + str.tostring(take_profit), style=label.style_label_up, color=color.green, textcolor=color.white, size=size.small)

// Dibujar Bandas de Bollinger
plot(upper_band, color=color.red, title="Banda Superior")
plot(lower_band, color=color.green, title="Banda Inferior")
plot(basis, color=color.blue, title="Media Base")

// Dibujar Parabolic SAR
plot(psar, style=plot.style_circles, color=color.orange, title="Parabolic SAR")
Published by ChaoZhang on the FMZ strategy square · last modified 2025-02-18. Collected in the Quant Trading Vault. Unvalidated research: re-test with your own data and costs before trusting it.
Build this with AgenKit
A spec is not a trading system. Paste this into your coding agent and AgenKit runs a specialist team — architecture, test-first build, risk gates, review — with paper trading on by default.
/agenkit build a production-grade trading bot with a backtest engine, risk controls and paper trading by default from strategies/Advanced-Quantitative-Trading-Strategy-Combining-Dynamic-Bollinger-Bands-with-PSAR-Indicator.md- npx agenkit install engineering-kit in your project
- Paste the command into your agent and approve each phase
- Get tests, backtest, risk controls and a paper-trading switch
Understand it first
Before you run this, read the lesson behind the idea and how to backtest it honestly. Specs like this one are the survivors of an unknown number of trials; deflate their results accordingly.
Related specs
- Quantitative Strategy PSARZigZagMACDART Based on Multi Indicator CombinationPine Script · Breakout · 1m
- Hybrid Moving Average Breakout Turtle Trading StrategyPine Script · Breakout · 1d
- MACD Bollinger Turtle Trading StrategyPine Script · Breakout · 1d
- Multi Order Breakout Trend Following StrategyPine Script · Breakout · 3h
- Trading Psychology Balancing StrategyPine Script · Breakout · 1h
- Adaptive Bollinger Breakout with Moving Average Quantitative Strategy SystemPine Script · Breakout · 1h