Strategy vault / Trend following
Advanced Quantitative Trend Capture Strategy with Dynamic Range Filter
This strategy is an advanced quantitative trading system that combines moving averages with a dynamic range filter. It identifies market trends by analyzing the relationship between price movements and trading…
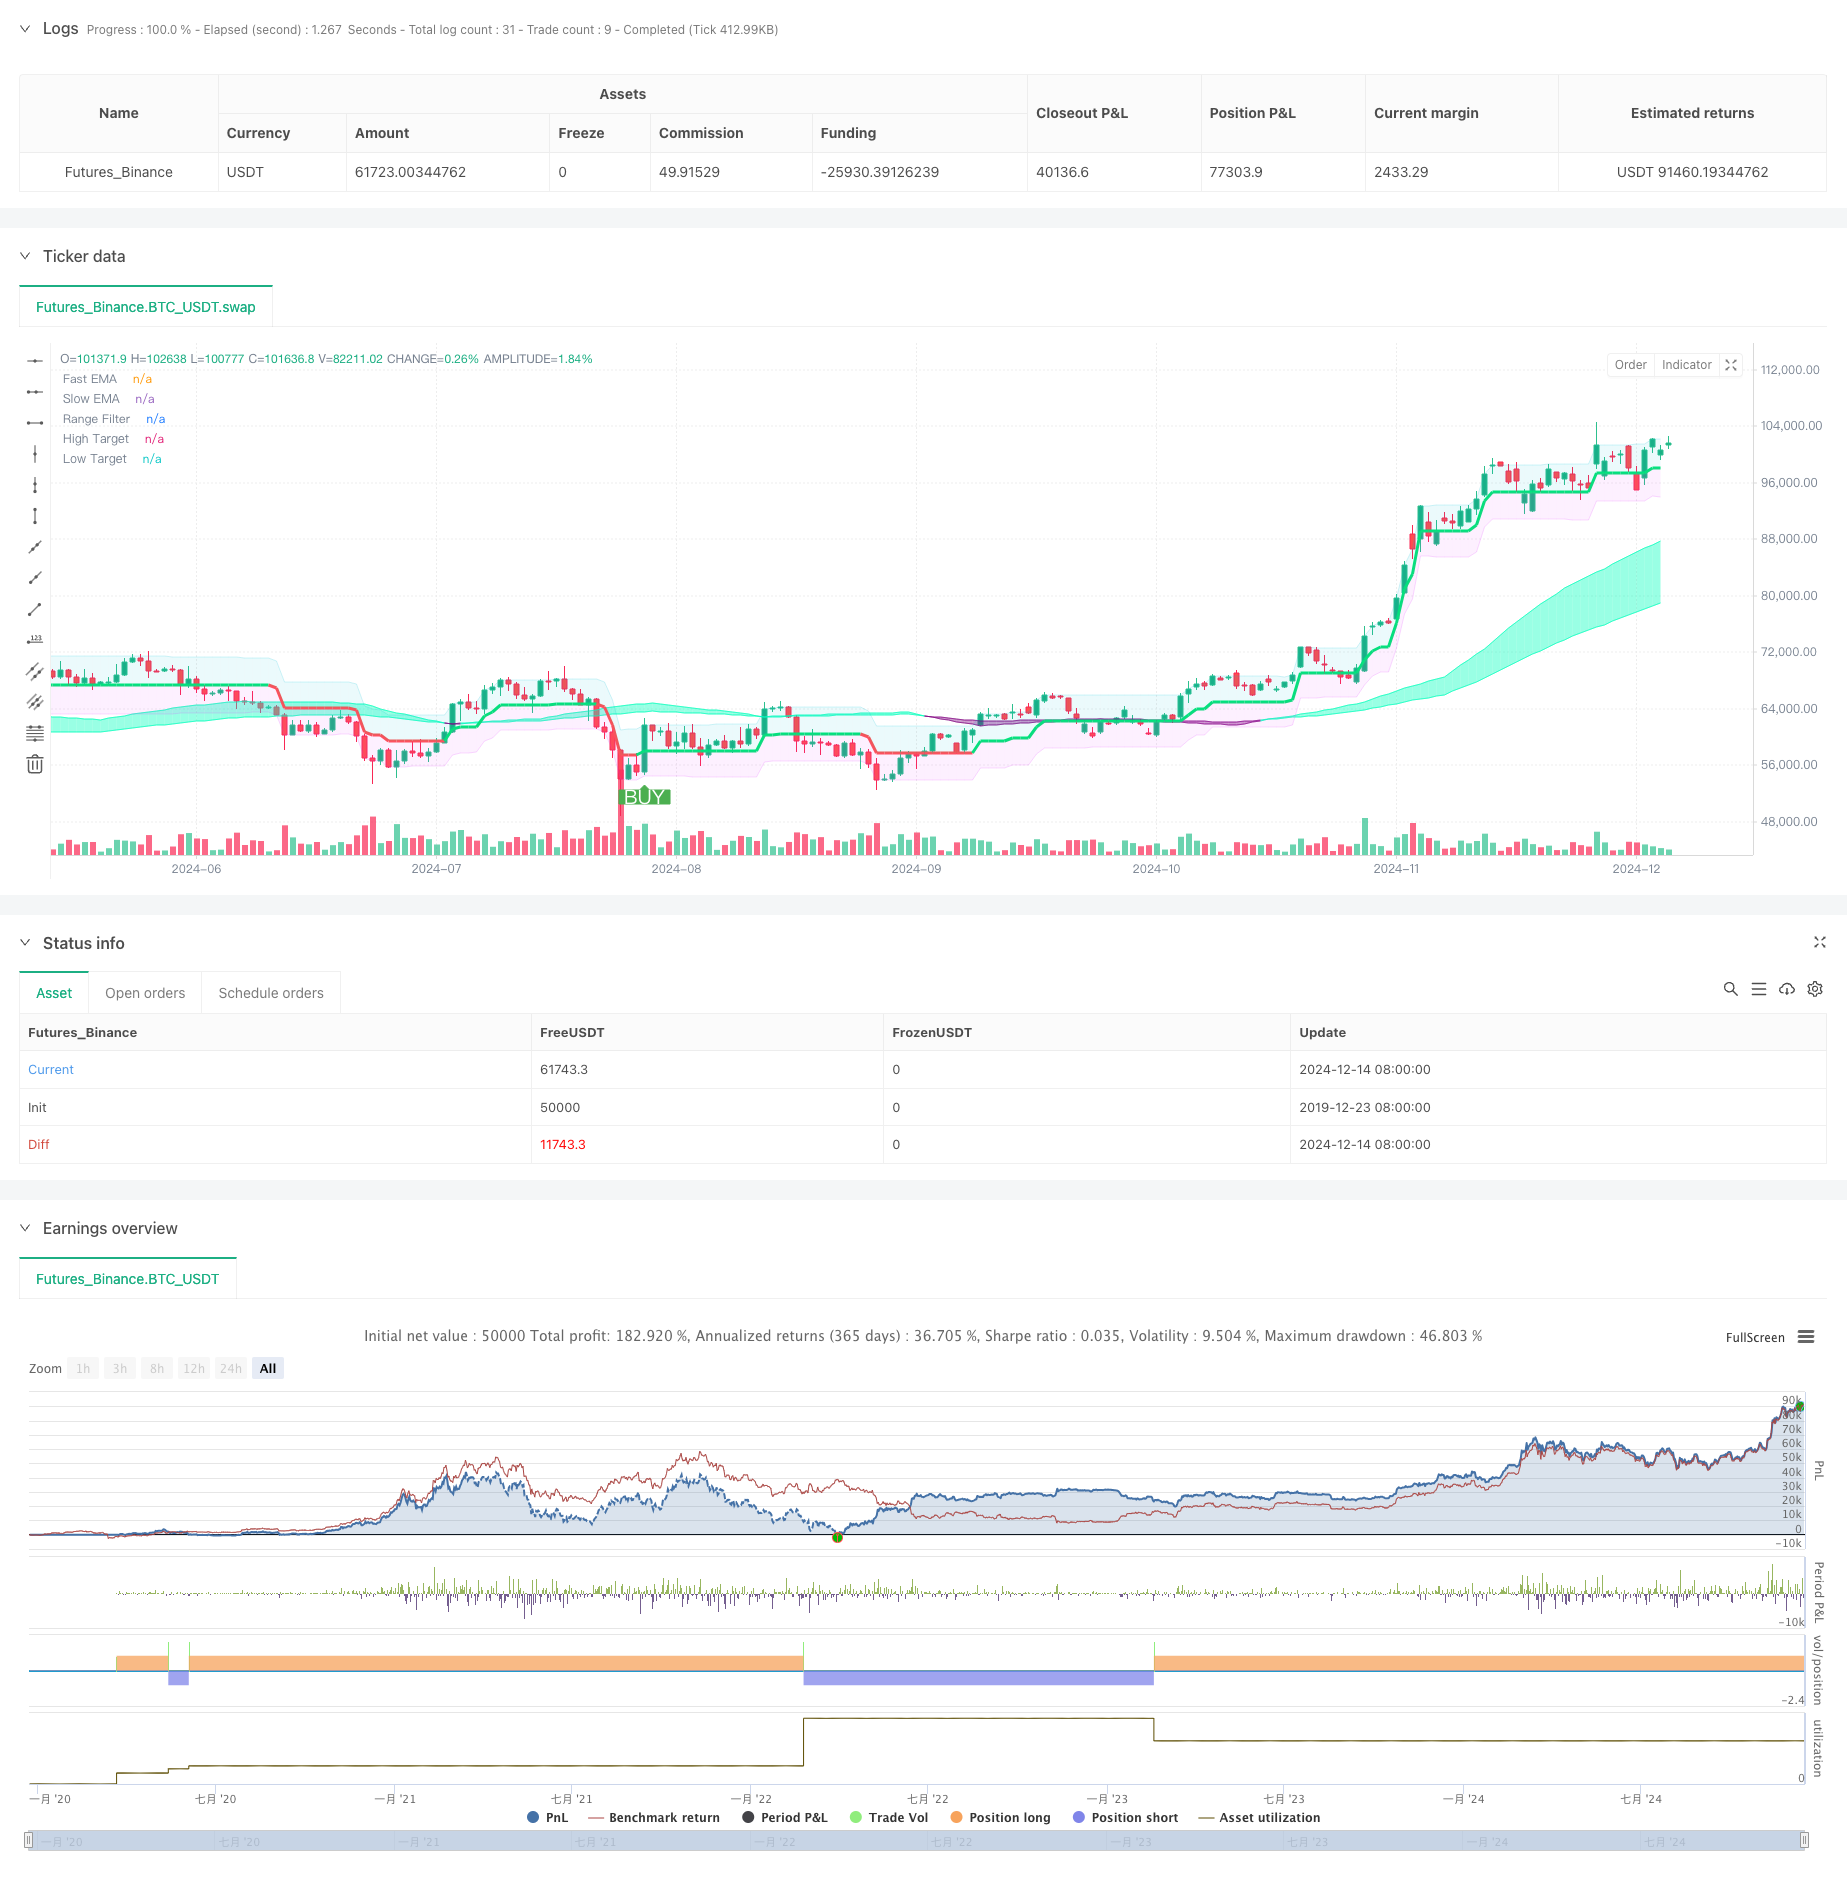
Overview
This strategy is an advanced quantitative trading system that combines moving averages with a dynamic range filter. It identifies market trends by analyzing the relationship between price movements and trading volume, while using a range filter to eliminate false signals and improve trading accuracy. The strategy employs adaptive calculation methods to determine market liquidity boundaries and combines fast and slow moving averages to confirm trend directions.
Strategy Principles
The core logic of the strategy is based on the following key calculations:
- Liquidity Analysis: Evaluates market liquidity by calculating the ratio of volume to price movement and sets dynamic liquidity boundaries.
- Trend Confirmation: Uses 50-period and 100-period Exponential Moving Averages (EMA) to confirm trend direction.
- Range Filtering: Employs a 50-period sampling period and 3x range multiplier to construct dynamic trading ranges.
- Signal Generation: Generates trading signals when price breaks through the range filter and EMA indicators show consistent trends.
Strategy Advantages
- Strong Adaptability: The strategy can dynamically adjust parameters based on market conditions, adapting to different market environments.
- Reliable Signals: Effectively reduces false signals by combining multiple technical indicators and filters.
- Comprehensive Risk Management: Integrates automatic calculation of stop-loss positions for effective risk control.
- Complete Backtesting Functionality: Includes detailed backtesting settings for strategy optimization.
Strategy Risks
- Parameter Sensitivity: Multiple parameters require fine-tuning and are prone to over-optimization.
- Slippage Impact: May face significant slippage risk in highly volatile markets.
- Market Adaptability: May generate frequent false signals in ranging markets.
- Capital Management: Fixed capital allocation method may not suit all market conditions.
Strategy Optimization Directions
- Parameter Adaptation: Introduce adaptive parameter adjustment mechanisms for automatic parameter tuning based on market conditions.
- Market State Recognition: Add market state identification modules to apply different trading strategies under different market conditions.
- Capital Management Optimization: Implement dynamic position sizing based on market volatility.
- Signal Filter Enhancement: Add more technical indicators to filter out false signals.
Summary
The strategy constructs a complete quantitative trading system by combining liquidity analysis, trend following, and range filtering. Its strengths lie in its ability to adapt to market changes and provide reliable trading signals, while requiring attention to parameter optimization and risk management. Through continuous optimization and improvement, the strategy shows promise in maintaining stable performance across different market environments.
Source Pine Script
/*backtest
start: 2019-12-23 08:00:00
end: 2024-12-15 08:00:00
period: 1d
basePeriod: 1d
exchanges: [{"eid":"Futures_Binance","currency":"BTC_USDT"}]
*/

//@version=6
strategy("Killer Coin V2 + Range Filter Strategy", shorttitle="KC-RF Strategy", overlay=true
         )

// === INPUT BACKTEST RANGE ===
useDate = input(true, title='---------------- Use Date ----------------', group="Backtest Settings")
FromMonth = input.int(7, title="From Month", minval=1, maxval=12, group="Backtest Settings")
FromDay = input.int(25, title="From Day", minval=1, maxval=31, group="Backtest Settings")
FromYear = input.int(2019, title="From Year", minval=2017, group="Backtest Settings")
ToMonth = input.int(1, title="To Month", minval=1, maxval=12, group="Backtest Settings")
ToDay = input.int(1, title="To Day", minval=1, maxval=31, group="Backtest Settings")
ToYear = input.int(9999, title="To Year", minval=2017, group="Backtest Settings")
start = timestamp(FromYear, FromMonth, FromDay, 00, 00)
finish = timestamp(ToYear, ToMonth, ToDay, 23, 59)
window() => time >= start and time <= finish

// === KILLER COIN V2 INPUTS ===
outlierThreshold = input.int(10, "Outlier Threshold Length", group="Killer Coin Settings")
fastMovingAverageLength = input.int(50, "Fast MA length", group="Killer Coin Settings")
slowMovingAverageLength = input.int(100, "Slow MA length", group="Killer Coin Settings")

// === RANGE FILTER INPUTS ===
sources = input(close, "Source", group="Range Filter Settings")
isHA = input(false, "Use HA Candles", group="Range Filter Settings")
per = input.int(50, "Sampling Period", minval=1, group="Range Filter Settings")
mult = input.float(3.0, "Range Multiplier", minval=0.1, group="Range Filter Settings")

// === KILLER COIN V2 CALCULATIONS ===
priceMovementLiquidity = volume / math.abs(close - open)
liquidityBoundary = ta.ema(priceMovementLiquidity, outlierThreshold) + ta.stdev(priceMovementLiquidity, outlierThreshold)
var liquidityValues = array.new_float(5)

if ta.crossover(priceMovementLiquidity, liquidityBoundary)
    array.insert(liquidityValues, 0, close)

fastEMA = ta.ema(array.get(liquidityValues, 0), fastMovingAverageLength)
slowEMA = ta.ema(array.get(liquidityValues, 0), slowMovingAverageLength)

// === RANGE FILTER CALCULATIONS ===
src = isHA ? request.security(ticker.heikinashi(syminfo.tickerid), timeframe.period, sources) : sources

// Smooth Average Range
smoothrng(x, t, m) =>
    wper = (t*2) - 1
    avrng = ta.ema(math.abs(x - x[1]), t)
    smoothrng = ta.ema(avrng, wper)*m
    smoothrng

smrng = smoothrng(src, per, mult)

// Range Filter
rngfilt(x, r) =>
    rngfilt = x
    rngfilt := x > nz(rngfilt[1]) ? ((x - r) < nz(rngfilt[1]) ? nz(rngfilt[1]) : (x - r)) : ((x + r) > nz(rngfilt[1]) ? nz(rngfilt[1]) : (x + r))
    rngfilt

filt = rngfilt(src, smrng)

// Filter Direction
upward = 0.0
upward := filt > filt[1] ? nz(upward[1]) + 1 : filt < filt[1] ? 0 : nz(upward[1])
downward = 0.0
downward := filt < filt[1] ? nz(downward[1]) + 1 : filt > filt[1] ? 0 : nz(downward[1])

// Target Bands
hband = filt + smrng
lband = filt - smrng

// === PLOTTING ===
// Killer Coin V2 Plots
bullColor = color.new(#00ffbb, 50)
bearColor = color.new(#800080, 50)
fastPlot = plot(fastEMA, "Fast EMA", color = fastEMA > slowEMA ? bullColor : bearColor)
slowPlot = plot(slowEMA, "Slow EMA", color = fastEMA > slowEMA ? bullColor : bearColor)
fill(fastPlot, slowPlot, color = fastEMA > slowEMA ? bullColor : bearColor)

// Range Filter Plots
filtcolor = upward > 0 ? color.new(color.lime, 0) : downward > 0 ? color.new(color.red, 0) : color.new(color.orange, 0)
filtplot = plot(filt, "Range Filter", color=filtcolor, linewidth=3)
hbandplot = plot(hband, "High Target", color=color.new(color.aqua, 90))
lbandplot = plot(lband, "Low Target", color=color.new(color.fuchsia, 90))
fill(hbandplot, filtplot, color=color.new(color.aqua, 90))
fill(lbandplot, filtplot, color=color.new(color.fuchsia, 90))

// === STRATEGY CONDITIONS ===
// Range Filter Conditions
longCond = ((src > filt) and (src > src[1]) and (upward > 0)) or ((src > filt) and (src < src[1]) and (upward > 0))
shortCond = ((src < filt) and (src < src[1]) and (downward > 0)) or ((src < filt) and (src > src[1]) and (downward > 0))

CondIni = 0
CondIni := longCond ? 1 : shortCond ? -1 : CondIni[1]
longCondition = longCond and CondIni[1] == -1
shortCondition = shortCond and CondIni[1] == 1

// Combined Conditions
finalLongSignal = longCondition and fastEMA > slowEMA and window()
finalShortSignal = shortCondition and fastEMA < slowEMA and window()

// === PLOTTING SIGNALS ===
plotshape(finalLongSignal, "Buy Signal", text="BUY", textcolor=color.white,
         style=shape.labelup, size=size.normal, location=location.belowbar,
         color=color.new(color.green, 0))

plotshape(finalShortSignal, "Sell Signal", text="SELL", textcolor=color.white,
         style=shape.labeldown, size=size.normal, location=location.abovebar,
         color=color.new(color.red, 0))

// === STRATEGY ENTRIES ===
if finalLongSignal
    strategy.entry("Long", strategy.long, stop=hband)

if finalShortSignal
    strategy.entry("Short", strategy.short, stop=lband)

// === ALERTS ===
alertcondition(finalLongSignal, "Strong Buy Signal", "? Buy - Both Indicators Aligned!")
alertcondition(finalShortSignal, "Strong Sell Signal", "? Sell - Both Indicators Aligned!")Published by ChaoZhang on the FMZ strategy square · last modified 2024-12-17. Collected in the Quant Trading Vault. Unvalidated research: re-test with your own data and costs before trusting it.
Build this with AgenKit
A spec is not a trading system. Paste this into your coding agent and AgenKit runs a specialist team — architecture, test-first build, risk gates, review — with paper trading on by default.
/agenkit build a production-grade trading bot with a backtest engine, risk controls and paper trading by default from strategies/Advanced-Quantitative-Trend-Capture-Strategy-with-Dynamic-Range-Filter.md- npx agenkit install engineering-kit in your project
- Paste the command into your agent and approve each phase
- Get tests, backtest, risk controls and a paper-trading switch
Understand it first
Before you run this, read the lesson behind the idea and how to backtest it honestly. Specs like this one are the survivors of an unknown number of trials; deflate their results accordingly.
Related specs
- ATR Dynamic Trend Following and EMA Crossover Trading StrategyPine Script · Trend following · 1d
- Dual EMA Filtered ATR Adaptive Trend Following StrategyPine Script · Trend following · 1h
- Dual Hull Moving Average Trading StrategyPine Script · Trend following · 1d
- Full Crypto Swing ALMA Cross MACD Quantitative StrategyPine Script · Trend following · 1h
- Incremental Order Size Fibonacci Retracement Trend Following StrategyPine Script · Trend following · 1d
- Volatility Trend Tracking StrategyPine Script · Trend following · 1h