Strategy vault / Trend following
Advanced Trend Trading Strategy Based on Bollinger Bands and Candlestick Patterns
This is a trend-following strategy based on Bollinger Bands and candlestick pattern analysis. The strategy primarily identifies potential market reversal points by observing candlestick patterns when price touches…
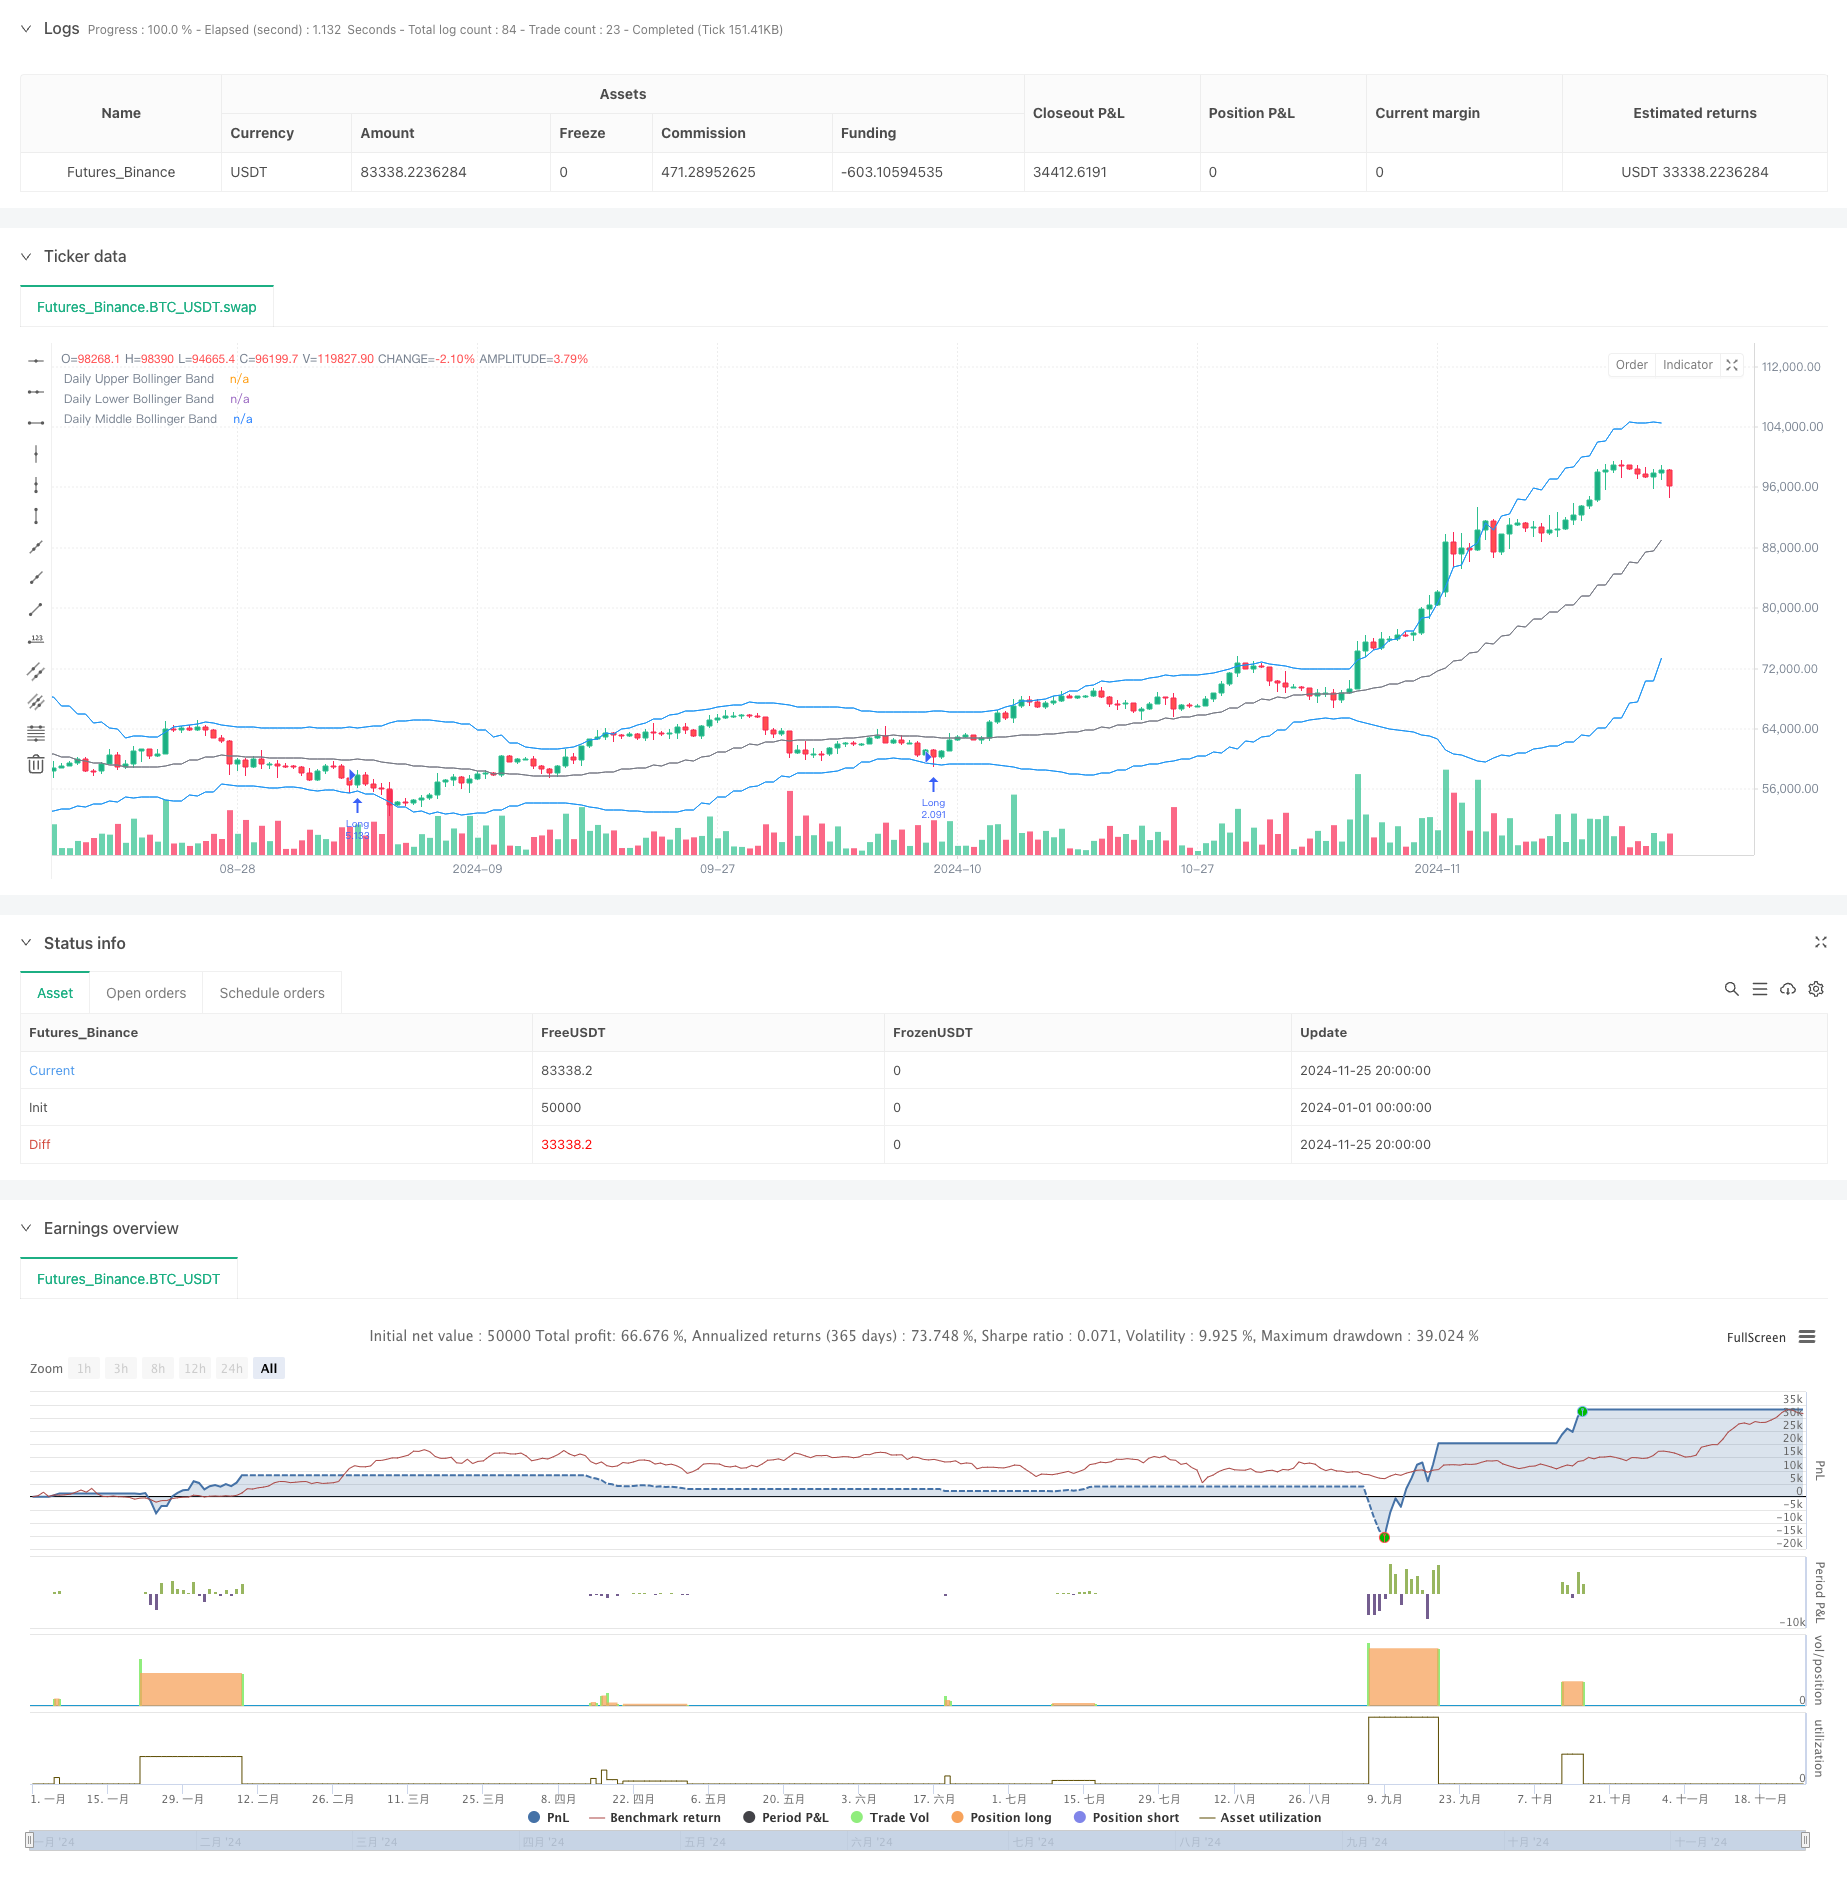
Overview
This is a trend-following strategy based on Bollinger Bands and candlestick pattern analysis. The strategy primarily identifies potential market reversal points by observing candlestick patterns when price touches Bollinger Bands, combined with the ratio relationship between wicks and body. Additionally, the strategy employs a fixed risk model to control exposure per trade and utilizes multiple timeframe analysis to enhance trading accuracy.
Strategy Principles
The core logic of the strategy is based on several key elements: First, it calculates Bollinger Bands over 20 periods to determine price volatility range; Second, when price touches the Bollinger Bands, it analyzes the ratio between upper/lower wicks and body of the candlestick, considering it as a potential reversal signal when the ratio exceeds the set threshold; Third, it calculates key support and resistance levels for stop-loss placement; Finally, it calculates position size for each trade based on a fixed percentage (1%) of the account balance, implementing dynamic risk management. The strategy also offers various entry timing options, including closing price, opening price, daily high, and daily low.
Strategy Advantages
- Precise risk control: Uses fixed percentage risk management model, ensuring controlled risk exposure per trade
- Flexible entry points: Provides multiple entry price options to accommodate different trading styles
- Technical indicator combination: Combines Bollinger Bands with candlestick pattern analysis for improved signal reliability
- Rational stop-loss placement: Sets stop-losses based on key support and resistance levels, aligning with market dynamics
- Comprehensive trade management: Includes order expiration mechanism to avoid false signals
Strategy Risks
- Rapid market fluctuation risk: Wick ratios may generate false signals in volatile markets
- Money management risk: Fixed percentage risk model might lead to undersized positions after consecutive losses
- Stop-loss placement risk: Support and resistance calculations may not be accurate under certain market conditions
- Timeframe dependency: Strategy primarily based on daily timeframe may miss opportunities in smaller timeframes
Strategy Optimization Directions
- Incorporate volume indicators: Add volume analysis for signal confirmation to improve reliability
- Optimize stop-loss mechanism: Consider implementing dynamic stop-loss that adjusts based on market volatility
- Add market environment filters: Include trend strength indicators to adjust strategy parameters in different market conditions
- Improve position management: Consider implementing dynamic position sizing based on market volatility
- Add time filters: Include time filters to avoid trading during highly volatile market sessions
Summary
This strategy combines classical technical analysis tools with modern risk management methods to build a relatively comprehensive trading system. The core advantages lie in its strict risk control and flexible entry mechanisms, while attention needs to be paid to market environment changes and signal reliability verification in practical applications. Through the suggested optimization directions, there is room for further improvement, particularly in signal filtering and risk management aspects.
Source Pine Script
/*backtest
start: 2024-01-01 00:00:00
end: 2024-11-26 00:00:00
period: 12h
basePeriod: 12h
exchanges: [{"eid":"Futures_Binance","currency":"BTC_USDT"}]
*/

//@version=5
strategy("Trade Entry Detector, based on Wick to Body Ratio when price tests Bollinger Bands", overlay=true, default_qty_type=strategy.fixed)

// Input for primary analysis time frame
timeFrame = "D"  // Daily time frame

// Bollinger Band settings
length = input.int(20, title="Bollinger Band Length", minval=1)
mult = input.float(2.0, title="Standard Deviation Multiplier", minval=0.1)
source = input(close, title="Source")

// Entry ratio settings
wickToBodyRatio = input.float(1.0, title="Minimum Wick-to-Body Ratio", minval=0)

// Order Fill Timing Option
fillOption = input.string("Daily Close", title="Order Fill Timing", options=["Daily Close", "Daily Open", "HOD", "LOD"])

// Account and risk settings
accountBalance = 100000  // Account balance in dollars
riskPercentage = 1.0     // Risk percentage per trade
riskAmount = (riskPercentage / 100) * accountBalance // Fixed 1% risk amount

// Request daily data for calculations
dailyHigh = request.security(syminfo.tickerid, timeFrame, high)
dailyLow = request.security(syminfo.tickerid, timeFrame, low)
dailyClose = request.security(syminfo.tickerid, timeFrame, close)
dailyOpen = request.security(syminfo.tickerid, timeFrame, open)

// Calculate Bollinger Bands on the daily time frame
dailyBasis = request.security(syminfo.tickerid, timeFrame, ta.sma(source, length))
dailyDev = mult * request.security(syminfo.tickerid, timeFrame, ta.stdev(source, length))
dailyUpperBand = dailyBasis + dailyDev
dailyLowerBand = dailyBasis - dailyDev

// Calculate the body and wick sizes on the daily time frame
dailyBodySize = math.abs(dailyOpen - dailyClose)
dailyUpperWickSize = dailyHigh - math.max(dailyOpen, dailyClose)
dailyLowerWickSize = math.min(dailyOpen, dailyClose) - dailyLow

// Conditions for a candle with an upper wick or lower wick that touches the Bollinger Bands
upperWickCondition = (dailyUpperWickSize / dailyBodySize >= wickToBodyRatio) and (dailyHigh > dailyUpperBand)
lowerWickCondition = (dailyLowerWickSize / dailyBodySize >= wickToBodyRatio) and (dailyLow < dailyLowerBand)

// Define the swing high and swing low for stop loss placement
var float swingLow = na
var float swingHigh = na

if (ta.pivothigh(dailyHigh, 5, 5))
    swingHigh := dailyHigh[5]

if (ta.pivotlow(dailyLow, 5, 5))
    swingLow := dailyLow[5]

// Determine entry price based on chosen fill option
var float longEntryPrice = na
var float shortEntryPrice = na

if lowerWickCondition
    longEntryPrice := fillOption == "Daily Close" ? dailyClose :
                      fillOption == "Daily Open" ? dailyOpen :
                      fillOption == "HOD" ? dailyHigh : dailyLow

if upperWickCondition
    shortEntryPrice := fillOption == "Daily Close" ? dailyClose :
                       fillOption == "Daily Open" ? dailyOpen :
                       fillOption == "HOD" ? dailyHigh : dailyLow

// Execute the long and short entries with expiration
var int longOrderExpiry = na
var int shortOrderExpiry = na

if not na(longEntryPrice)
    longOrderExpiry := bar_index + 2  // Order expires after 2 days

if not na(shortEntryPrice)
    shortOrderExpiry := bar_index + 2  // Order expires after 2 days

// Check expiration and execute orders
if (longEntryPrice and bar_index <= longOrderExpiry and high >= longEntryPrice)
    longStopDistance = close - nz(swingLow, close)
    longPositionSize = longStopDistance > 0 ? riskAmount / longStopDistance : na
    if (not na(longPositionSize))
        strategy.entry("Long", strategy.long, qty=longPositionSize)
    longEntryPrice := na  // Reset after entry

if (shortEntryPrice and bar_index <= shortOrderExpiry and low <= shortEntryPrice)
    shortStopDistance = nz(swingHigh, close) - close
    shortPositionSize = shortStopDistance > 0 ? riskAmount / shortStopDistance : na
    if (not na(shortPositionSize))
        strategy.entry("Short", strategy.short, qty=shortPositionSize)
    shortEntryPrice := na  // Reset after entry

// Exit logic: hit the opposing Bollinger Band
if (strategy.position_size > 0) // Long position
    strategy.exit("Exit Long", "Long", limit=dailyUpperBand)
else if (strategy.position_size < 0) // Short position
    strategy.exit("Exit Short", "Short", limit=dailyLowerBand)

if (strategy.position_size > 0) // Long position
    strategy.exit("Stop Loss Long", "Long", stop=swingLow)
else if (strategy.position_size < 0) // Short position
    strategy.exit("Stop Loss Short", "Short", stop=swingHigh)

// Plot daily Bollinger Bands and levels on the chosen time frame
plot(dailyUpperBand, color=color.blue, linewidth=1, title="Daily Upper Bollinger Band")
plot(dailyLowerBand, color=color.blue, linewidth=1, title="Daily Lower Bollinger Band")
plot(dailyBasis, color=color.gray, linewidth=1, title="Daily Middle Bollinger Band")
Published by ChaoZhang on the FMZ strategy square · last modified 2024-11-27. Collected in the Quant Trading Vault. Unvalidated research: re-test with your own data and costs before trusting it.
Build this with AgenKit
A spec is not a trading system. Paste this into your coding agent and AgenKit runs a specialist team — architecture, test-first build, risk gates, review — with paper trading on by default.
/agenkit build a production-grade trading bot with a backtest engine, risk controls and paper trading by default from strategies/Advanced-Trend-Trading-Strategy-Based-on-Bollinger-Bands-and-Candlestick-Patterns.md- npx agenkit install engineering-kit in your project
- Paste the command into your agent and approve each phase
- Get tests, backtest, risk controls and a paper-trading switch
Understand it first
Before you run this, read the lesson behind the idea and how to backtest it honestly. Specs like this one are the survivors of an unknown number of trials; deflate their results accordingly.
Related specs
- Bollinger Bands Precise Crossover Quantitative StrategyPine Script · Trend following · 1h
- Going with the Trend Moving Average Crossover StrategyPine Script · Trend following · 1d
- Bollinger Bands and Fibonacci Trading StrategyPine Script · Trend following · 45m
- Multi Band Statistical Trend Analysis StrategyPine Script · Trend following · 1h
- Bollinger Band Crossover with Slippage and Price Impact Combined StrategyPine Script · Trend following · 1d
- Dual track Oscillator Pattern StrategyPine Script · Trend following · 1d