Advantage Moving Average Breakout Trend Following System
This is a classic trend following system. It uses moving average crossovers to determine trend direction and enters when price breaks out of Donchian Channels. The Donchian Channel parameter is set to 50 days to…
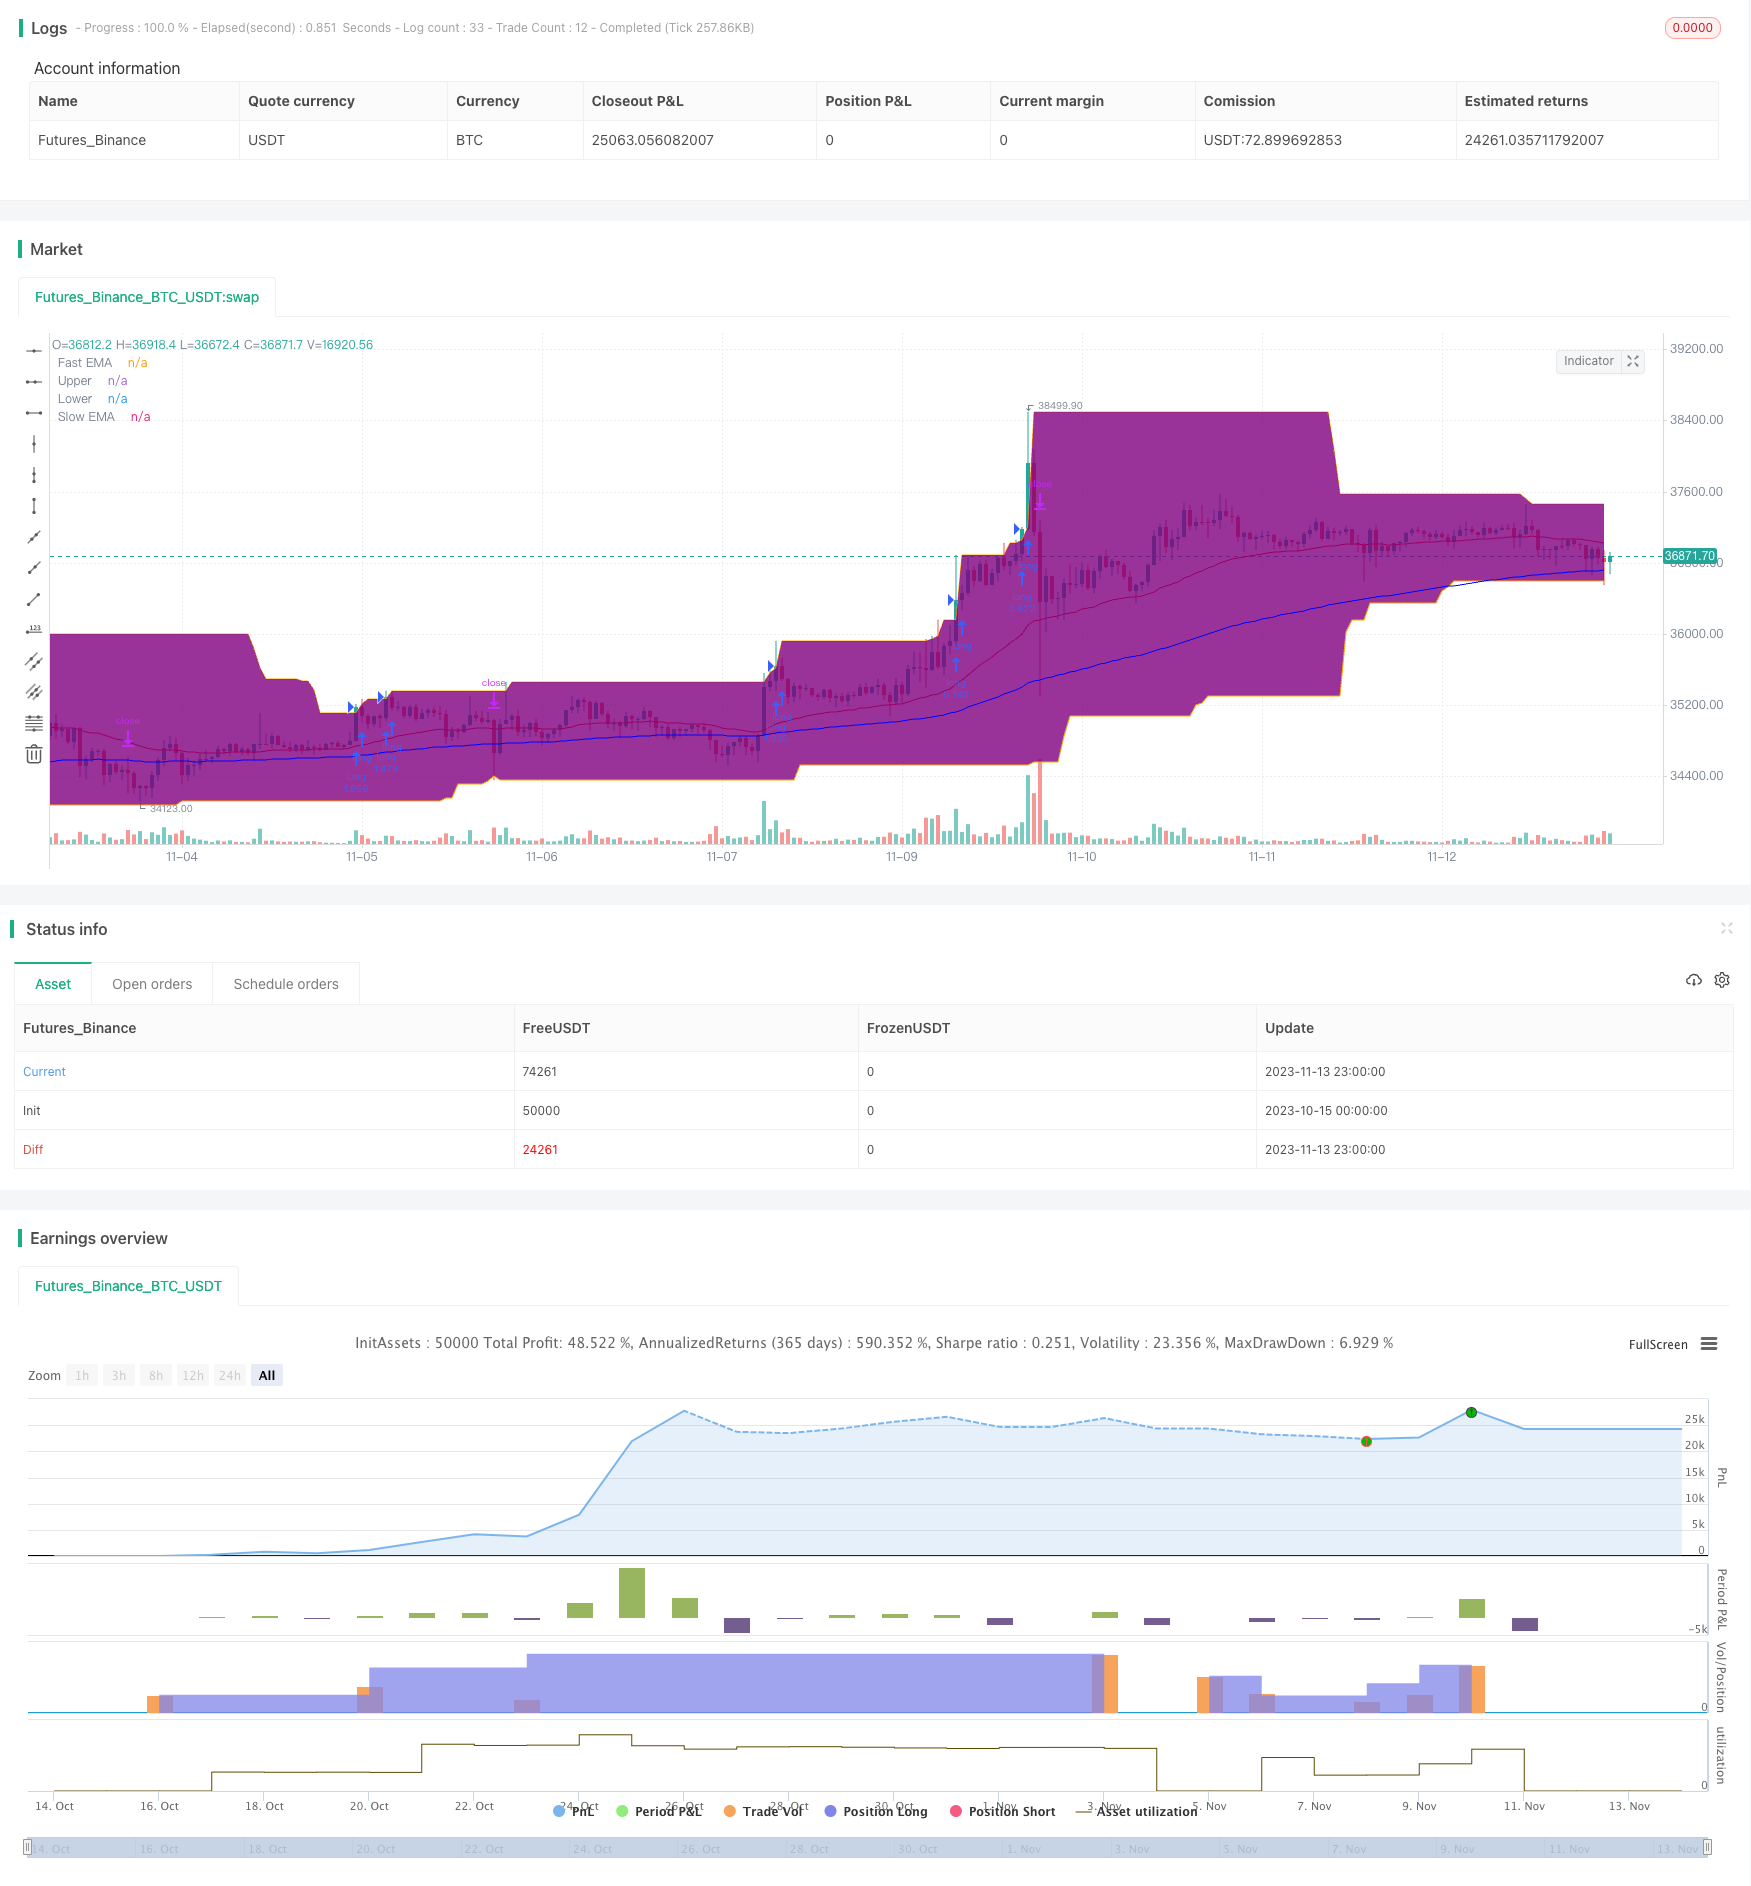
Overview
This is a classic trend following system. It uses moving average crossovers to determine trend direction and enters when price breaks out of Donchian Channels. The Donchian Channel parameter is set to 50 days to filter out short-term market noise. The moving averages are 40-day and 120-day exponential moving averages, which can better capture mid- to long-term trends. The stop loss is set at 4x ATR below price to effectively control loss on individual trades.
Strategy Logic
The strategy is mainly based on the following points:
40-day and 120-day exponential moving averages are used to construct a trend determination indicator. When the fast line crosses above the slow line from below, it's a golden cross signal, indicating an uptrend. When the fast line crosses below the slow line from above, it's a death cross signal, indicating a downtrend.
The Donchian Channel parameter is set to 50 days to filter out market noise. Go long only when price breaks out above the upper band, and go short only when price breaks out below the lower band to avoid being trapped.
The stop loss is set at 4x ATR below price. ATR can effectively measure market volatility and risk. Setting the stop loss at a multiple of it can control the loss on individual trades.
Exponential moving averages fit better to current price trends, while simple moving averages are too smooth.
The 50-day channel period works well with the 40-day and 120-day moving averages to effectively filter out false breakouts.
Advantage Analysis
The advantages of this strategy include:
The moving average combination can effectively determine the market trend direction. The 40-day MA captures short-term trends while the 120-day MA judges longer-term trends.
The Donchian Channel filters out noise and avoids chasing tops and bottoms. Only entering on channel breakouts effectively avoids trading the consolidation areas in the middle.
The stop loss setting is reasonable to control loss on individual trades and avoid account blowups. Controlling single trade loss ensures profit sustainability.
Exponential moving averages fit better to price change tendencies, allowing longer holding periods fitting the trend trading idea.
The moving average parameters strike a balance between trend capture sensitivity and noise filter stability.
Risk Analysis
The risks of this strategy include:
Long holding period risk: As a trend following strategy, large losses may occur during prolonged sideways ranges or trend reversals.
False breakout risk: There may be some percentage of false breakouts when price touches near the channel bands, causing unnecessary trades.
Parameter setting risk: The settings for moving averages and channels are subjective. Different markets need adjusted combinations, otherwise system stability is affected.
Stop loss too tight risk: Setting the stop loss too tight may result in too many stop outs, impacting profitability.
Solutions:
- Cautiously determine holding periods to avoid long holding period risks.
- Optimize parameters to make breakout signals more stable and reliable.
- Test data from different markets and optimize parameter combinations.
- Loosen stops reasonably to prevent overly frequent stop outs.
Optimization Directions
The strategy can be optimized in the following aspects:
Test different moving average combinations to find the optimal parameters. Various simple, exponential, Hull moving averages can be tested.
Optimize channel period and settings to make breakout signals more effective. Optimize based on market fluctuation frequency.
Optimize stop loss strategy. Adopt trailing stops during trending periods and fixed stops after trends end.
Add confirmation indicators like MACD, KD to improve signal accuracy.
Introduce position sizing strategies. Pyramid during trending periods to optimize profits.
Select parameter combinations according to different product characteristics to make the system more robust.
Conclusion
Overall this is a typical and simple trend following system. The core lies in using moving averages and channel breakouts. The stop loss strategy is also classic and practical. The strategy can work as a basic framework for quant system development, and can also be directly deployed for relatively stable profits. Further optimization through testing can improve system stability and profitability. In summary, the strategy features ease of use and versatility, making it suitable as a fundamental quantitative trading strategy.
Parameters
| Name | Default | What it controls |
|---|---|---|
| v_input_3_close | 0 | Source Fast MA: close | high | low | open | hl2 | hlc3 | hlcc4 | ohlc4 |
| v_input_4_close | 0 | Source Slow MA: close | high | low | open | hl2 | hlc3 | hlcc4 | ohlc4 |
| v_input_1 | timestamp(01 Jan 2017 00:00 +0000) | (?backtest window)Backtest Start Date |
| v_input_2 | timestamp(01 Jan 2100 00:00 +0000) | Backtest End Date |
| v_input_int_1 | 40 | (?Moving Average Inputs)Length Fast EMA |
| v_input_int_2 | 120 | Length Slow EMA |
| v_input_color_1 | red | Color Fast EMA |
| v_input_color_2 | blue | Color Slow EMA |
| v_input_int_3 | 50 | (?Donchian Channels Inputs)Length Upper Channel |
| v_input_int_4 | 50 | Length Lower Channel |
| v_input_color_3 | purple | Fill Color |
| v_input_color_4 | orange | Color Upper Channel |
| v_input_color_5 | orange | Color Lower Channel |
| v_input_int_5 | 14 | (?ATR Inputs)ATR Period |
| v_input_5 | 0.01 | Risk Per Trade |
| v_input_6 | 2 | ATR Multiplier |
Source Pine Script
/*backtest
start: 2023-10-15 00:00:00
end: 2023-11-14 00:00:00
period: 1h
basePeriod: 15m
exchanges: [{"eid":"Futures_Binance","currency":"BTC_USDT"}]
*/

// This source code is subject to the terms of the Mozilla Public License 2.0 at https://mozilla.org/MPL/2.0/
// © Robrecht99

//@version=5
strategy("Long Term Trend Following System", overlay=true, margin_long=0, margin_short=0, pyramiding=4)

// Backtest Range //

Start = input(defval = timestamp("01 Jan 2017 00:00 +0000"), title = "Backtest Start Date", group = "backtest window")
Finish = input(defval = timestamp("01 Jan 2100 00:00 +0000"), title = "Backtest End Date", group = "backtest window")

//Moving Averages //

len1 = input.int(40, minval=1, title="Length Fast EMA", group="Moving Average Inputs")
len2 = input.int(120, minval=1, title="Length Slow EMA", group="Moving Average Inputs")
src1 = input(close, title="Source Fast MA")
src2 = input(close, title="Source Slow MA")
maFast = input.color(color.new(color.red, 0), title = "Color Fast EMA", group = "Moving Average Inputs", inline = "maFast")
maSlow = input.color(color.new(color.blue, 0), title = "Color Slow EMA", group = "Moving Average Inputs", inline = "maSlow")
fast = ta.ema(src1, len1)
slow = ta.ema(src2, len2)
plot(fast, color=maFast, title="Fast EMA")
plot(slow, color=maSlow, title="Slow EMA")

// Donchian Channels //

Length1 = input.int(title="Length Upper Channel", defval=50, minval=1, group="Donchian Channels Inputs")
Length2 = input.int(title="Length Lower Channel", defval=50, minval=1, group="Donchian Channels Inputs")
h1 = ta.highest(high[1], Length1)
l1 = ta.lowest(low[1], Length2)
fillColor = input.color(color.new(color.purple, 95), title = "Fill Color", group = "Donchian Channels Inputs")
upperColor = input.color(color.new(color.orange, 0), title = " Color Upper Channel", group = "Donchian Channels Inputs", inline = "upper")
lowerColor = input.color(color.new(color.orange, 0), title = " Color Lower Channel", group = "Donchian Channels Inputs", inline = "lower")
u = plot(h1, "Upper", color=upperColor)
l = plot(l1, "Lower", color=upperColor)
fill(u, l, color=fillColor)
strategy.initial_capital = 50000
//ATR and Position Size //

length = input.int(title="ATR Period", defval=14, minval=1, group="ATR Inputs")
risk = input(title="Risk Per Trade", defval=0.01, group="ATR Inputs")
multiplier = input(title="ATR Multiplier", defval=2, group="ATR Inputs")
atr = ta.atr(length)
amount = (risk * strategy.initial_capital / (multiplier * atr))

// Buy and Sell Conditions //

entrycondition1 = ta.crossover(fast, slow)
entrycondition2 = fast > slow
sellcondition1 = ta.crossunder(fast, slow)
sellcondition2 = slow > fast

// Buy and Sell Signals //

if (close > h1 and entrycondition2)
    strategy.entry("long", strategy.long, qty=amount)
    stoploss = close - atr * 4
    strategy.exit("exit sl", stop=stoploss, trail_offset=stoploss)
if (sellcondition1 and sellcondition2)
    strategy.close(id="long")

if (close < l1 and sellcondition2)
    strategy.entry("short", strategy.short, qty=amount)
    stoploss = close + atr * 4
    strategy.exit("exit sl", stop=stoploss, trail_offset=stoploss)
if (entrycondition1 and entrycondition2)
strategy.close(id="short")Published by ChaoZhang on the FMZ strategy square · last modified 2023-11-15. Collected in the Quant Trading Vault. Unvalidated research: re-test with your own data and costs before trusting it.
Build this with AgenKit
A spec is not a trading system. Paste this into your coding agent and AgenKit runs a specialist team — architecture, test-first build, risk gates, review — with paper trading on by default.
/agenkit build a production-grade trading bot with a backtest engine, risk controls and paper trading by default from strategies/Advantage-Moving-Average-Breakout-Trend-Following-System.md- npx agenkit install engineering-kit in your project
- Paste the command into your agent and approve each phase
- Get tests, backtest, risk controls and a paper-trading switch
Understand it first
Before you run this, read the lesson behind the idea and how to backtest it honestly. Specs like this one are the survivors of an unknown number of trials; deflate their results accordingly.
Related specs
- Donchian Channel and Larry Williams Large Trade Index StrategyPine Script · Breakout · 1m
- Momentum Breakout Trading Strategy 435896Pine Script · Breakout · 1d
- Multi Indicator Trend Breakout Strategy with Dynamic Stop LossPine Script · Breakout · 1d
- Trend Following Strategy with MACD and Donchian ChannelPine Script · Breakout · 1h
- Integrated Ichimoku Keltner Trading System Based on Moving Average StrategyPine Script · Breakout · 1h
- Dynamic Oscillation Breakout StrategyPine Script · Breakout · 1d