Strategy vault / Machine learning
AI Powered Volatility Price System Divergence Trading Strategy
This strategy is an advanced trend-following trading system incorporating artificial intelligence technology, primarily integrating VPS (Volatility Price System) divergence indicators and WOW trend methodology. It…
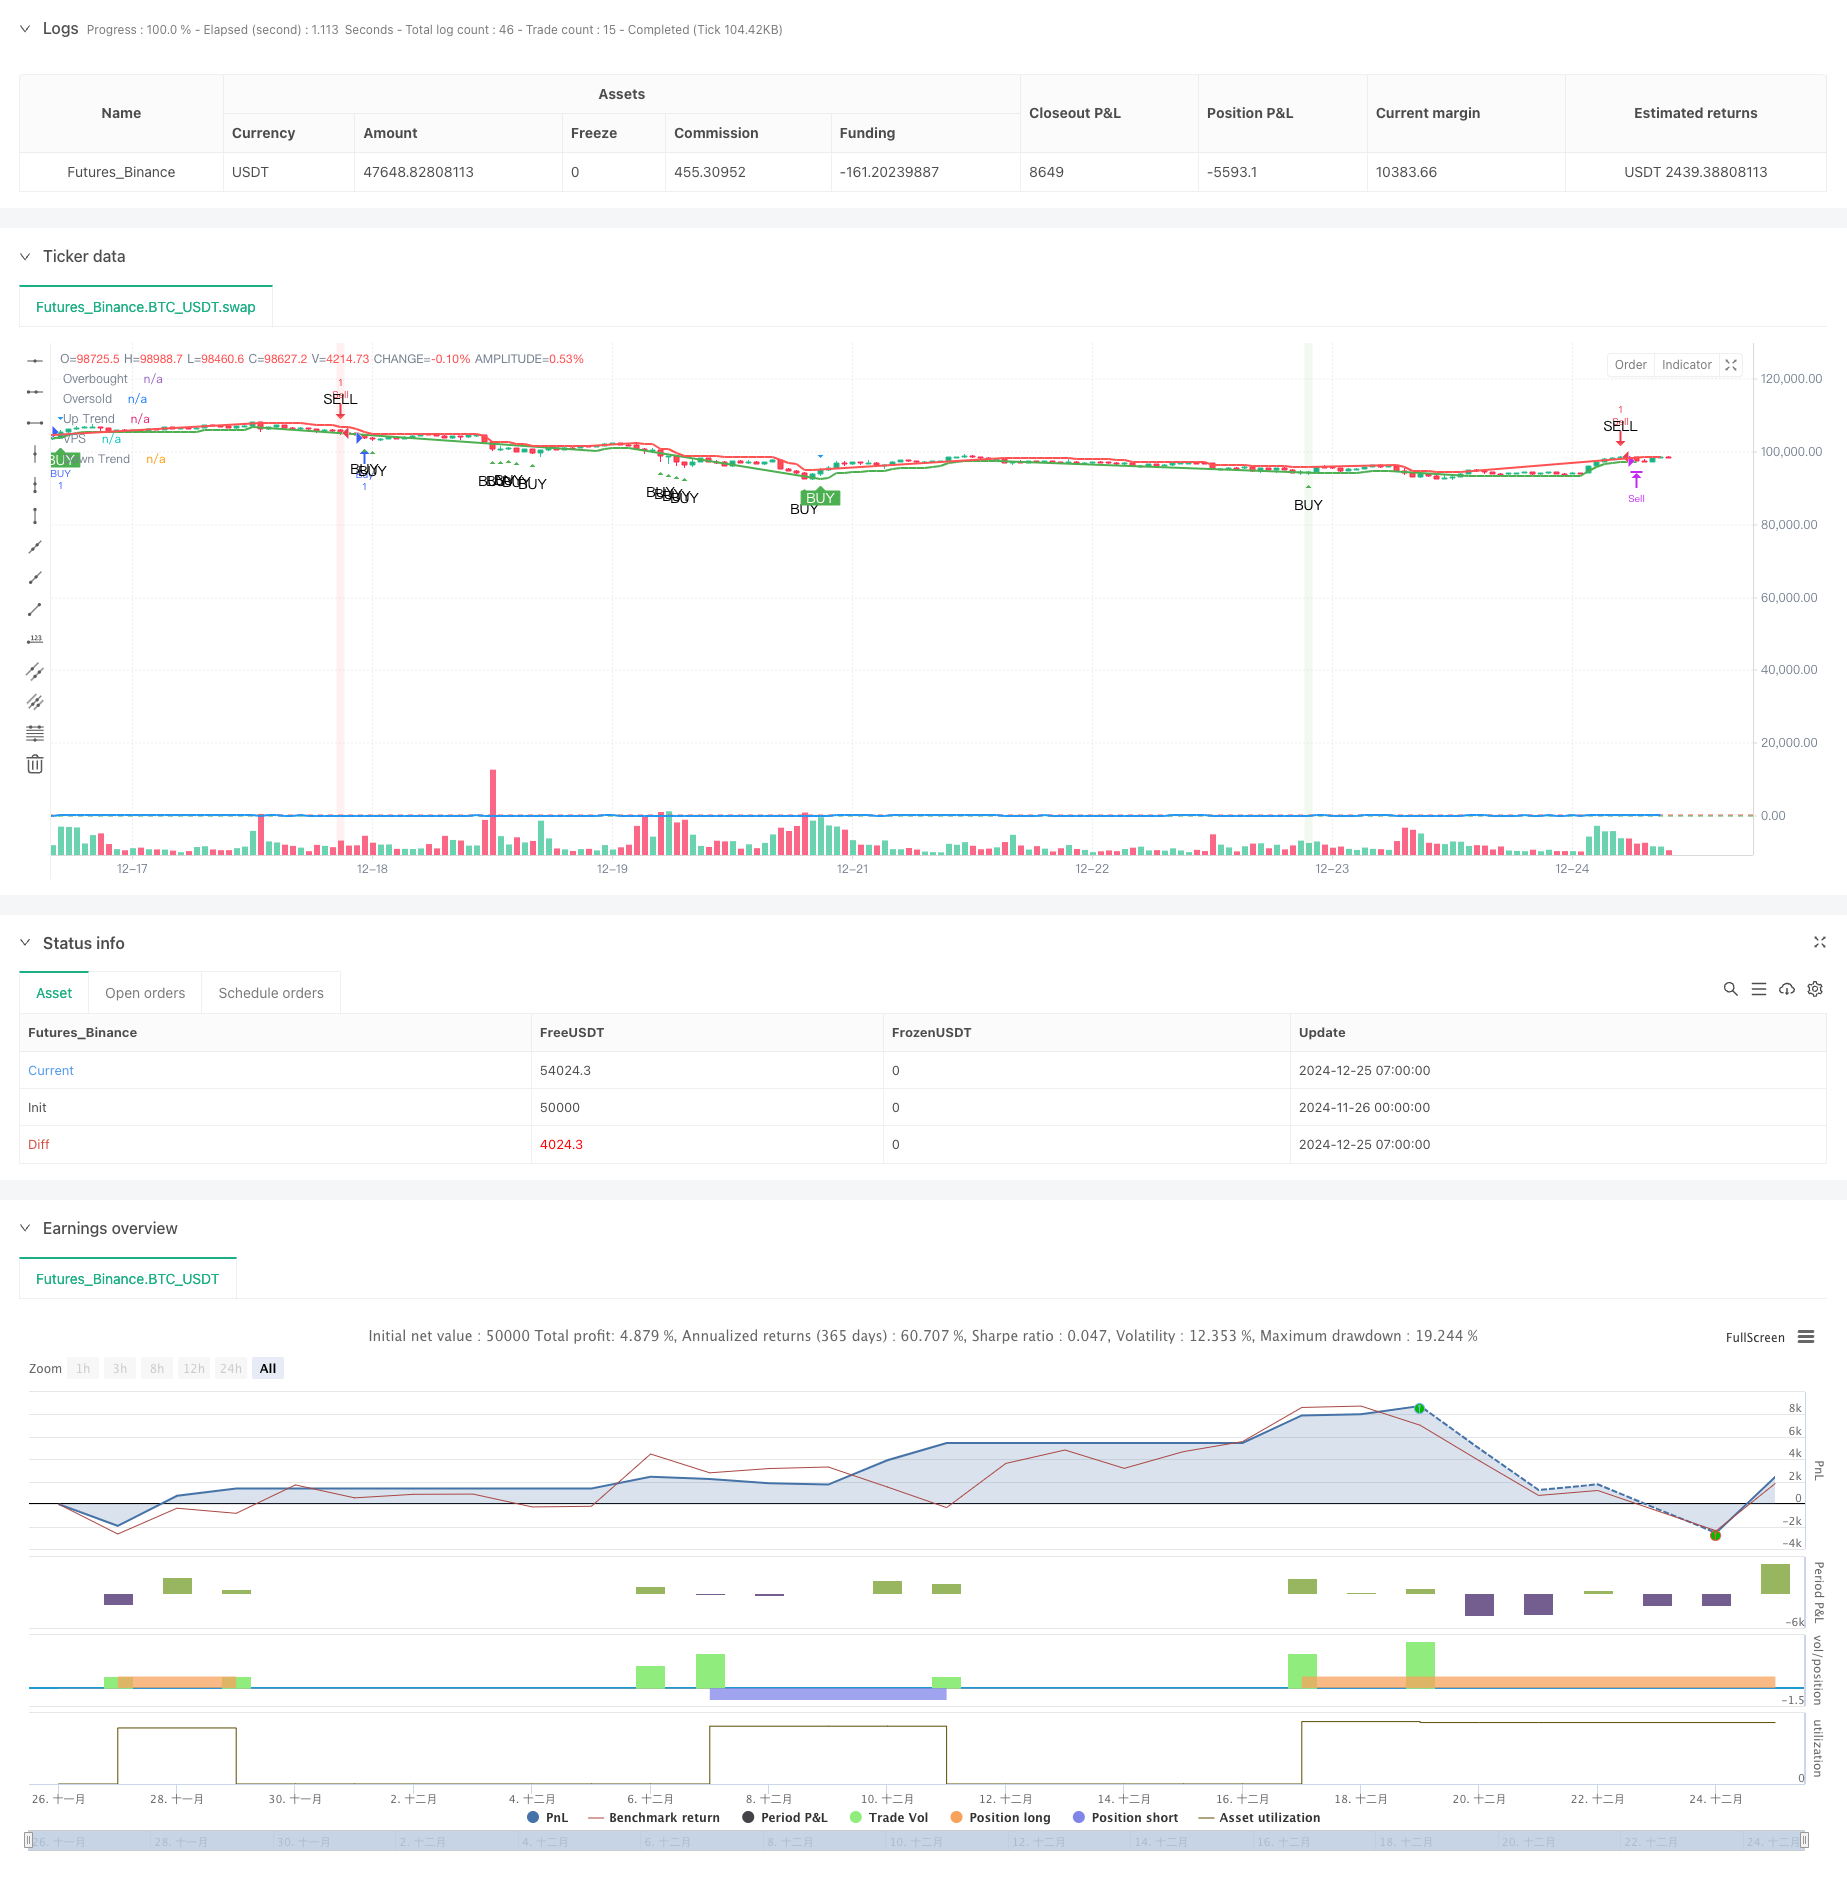
Overview
This strategy is an advanced trend-following trading system incorporating artificial intelligence technology, primarily integrating VPS (Volatility Price System) divergence indicators and WOW trend methodology. It utilizes VPS to identify market volatility and trend strength while combining RSI divergence to detect potential price reversal points. The strategy can provide precise entry signals for both long and short trades, enhancing market prediction accuracy by leveraging both trend momentum and divergence analysis.
Strategy Principles
The strategy operates based on three core components:
- WOW trend indicator for confirming trend changes (from bullish to bearish or vice versa)
- VPS conditions for verifying volatility and trend strength
- RSI divergence analysis for identifying potential reversal points
The system first calculates dynamic support and resistance channels based on ATR, combined with VPS length parameter (default 11) to evaluate market conditions. When price breaks through overbought (78) or oversold (27) levels, the system triggers trading signals. Additionally, the strategy monitors divergence between price and VPS indicator to further confirm trade direction.
Strategy Advantages
- Multi-dimensional Analysis: Provides a more comprehensive market perspective by combining trend following, volatility, and divergence analysis
- Strong Adaptability: Uses dynamic ATR channels that automatically adjust to market volatility
- Comprehensive Risk Management: Built-in profit-taking and stop-loss mechanisms with automatic position closing based on preset profit targets
- Signal Confirmation Mechanism: Requires multiple conditions to be met simultaneously for trade triggers, reducing false signals
- Bi-directional Trading Capability: Can capture both long and short trading opportunities, fully utilizing market volatility
Strategy Risks
- Market Noise: May generate false signals in sideways or low volatility environments
- Parameter Sensitivity: Strategy performance highly dependent on indicator parameter settings (e.g., VPS length, overbought/oversold levels)
- Slippage Risk: May face significant slippage impact in short timeframes (e.g., 5-minute)
- Signal Delay: Multiple confirmation mechanisms may lead to relatively delayed entry timing
- Money Management: Fixed capital allocation method may perform differently under various market conditions
Strategy Optimization Directions
- Dynamic Parameter Adjustment: Introduce adaptive parameter mechanisms to dynamically adjust VPS length and overbought/oversold thresholds based on market conditions
- Market Environment Filtering: Add market environment recognition module to pause trading during unfavorable market conditions
- Stop-Loss Optimization: Design more flexible stop-loss mechanisms based on ATR to improve risk control precision
- Time Period Optimization: Adjust strategy parameters and trading rules for different trading sessions
- Capital Management Optimization: Introduce dynamic position management to adjust trading size based on market volatility and profit/loss status
Summary
This is a comprehensive trading strategy that integrates multiple technical indicators and analytical methods. By combining artificial intelligence technology with traditional technical analysis, the strategy can provide high trading accuracy while maintaining robustness. The core advantages lie in its multi-layered signal confirmation mechanism and comprehensive risk management system, while the main areas for optimization are in dynamic parameter adjustment and market environment recognition. Through continuous optimization and improvement, this strategy has the potential to maintain stable performance across different market conditions.
Source Pine Script
/*backtest
start: 2024-11-26 00:00:00
end: 2024-12-25 08:00:00
period: 1h
basePeriod: 1h
exchanges: [{"eid":"Futures_Binance","currency":"BTC_USDT"}]
*/

//@version=6
strategy("AI+VPS Vijay Prasad Strategy", overlay=true)

// --- VPS Divergence Strategy Inputs ---
vps_length = input.int(11, title="VPS Length")
vps_overbought = input.int(78, title="VPS Overbought Level")  // Overbought level for VPS
vps_oversold = input.int(27, title="VPS Oversold Level")  // Oversold level for VPS

// Calculate VPS (Relative Strength Index alternative) - here using a custom divergence condition
vps = ta.rsi(close, vps_length)

// Plot VPS on the chart
plot(vps, title="VPS", color=color.blue, linewidth=2)
hline(vps_overbought, "Overbought", color=color.red, linewidth=1)
hline(vps_oversold, "Oversold", color=color.green, linewidth=1)

// Define Buy and Sell Conditions based on Overbought/Oversold VPS
vps_buy_condition = vps < vps_oversold  // Buy signal when VPS is oversold
vps_sell_condition = vps > vps_overbought  // Sell signal when VPS is overbought

// Define Bullish and Bearish Divergence conditions
bullish_divergence = (low[1] < low[2] and vps[1] > vps[2] and low < low[1] and vps > vps[1])
bearish_divergence = (high[1] > high[2] and vps[1] < vps[2] and high > high[1] and vps < vps[1])

// Combine Buy and Sell signals:
// Buy when VPS is oversold or Bullish Divergence occurs
vps_buy_condition_final = vps_buy_condition or bullish_divergence
// Sell when VPS is overbought or Bearish Divergence occurs
vps_sell_condition_final = vps_sell_condition or bearish_divergence

// Plot Buy and Sell Signals
plotshape(series=vps_buy_condition_final, title="VPS Buy Signal", location=location.belowbar, color=color.green, style=shape.triangleup, text="BUY")
plotshape(series=vps_sell_condition_final, title="VPS Sell Signal", location=location.abovebar, color=color.red, style=shape.triangledown, text="SELL")

// VPS Divergence Highlight
bgcolor(bullish_divergence ? color.new(color.green, 90) : na)  // Highlight background for Bullish Divergence
bgcolor(bearish_divergence ? color.new(color.red, 90) : na)  // Highlight background for Bearish Divergence

// Strategy: Buy and Sell with target
if vps_buy_condition_final
    strategy.entry("Buy", strategy.long)

if vps_sell_condition_final
    strategy.entry("Sell", strategy.short)

// Capital settings for the strategy (for backtesting purposes)
capital_per_trade = input.float(1000, title="Capital per Trade (INR)", minval=1)
buy_target_inr = 1500  // Profit target for Buy in INR
sell_target_inr = 1000  // Profit target for Sell in INR

trade_value = close * (capital_per_trade / close)  // Value of one contract at current price

// Profit threshold calculation
buy_profit_target = buy_target_inr / trade_value  // Profit in price movement for Buy
sell_profit_target = sell_target_inr / trade_value  // Profit in price movement for Sell

// Exit based on profit targets
if strategy.position_size > 0
    profit_inr = (close - strategy.position_avg_price) * strategy.position_size
    if profit_inr >= buy_target_inr
        strategy.close("Buy", comment="Profit Target Reached")

if strategy.position_size < 0
    profit_inr = (strategy.position_avg_price - close) * -strategy.position_size
    if profit_inr >= sell_target_inr
        strategy.close("Sell", comment="Profit Target Reached")

// --- WoW Trends + VPS (Vijay Prasad Strategy) Logic ---
Periods = input.int(title="ATR Period", defval=10)
src = input.source(close, title="Source")
Multiplier = input.float(title="ATR Multiplier", step=0.1, defval=1.7)
changeATR = input.bool(title="Change ATR Calculation Method ?", defval=true)
showsignals = input.bool(title="Show Buy/Sell Signals ?", defval=true)

// --- ATR Calculation ---
atr2 = ta.sma(ta.tr, Periods)
atr = changeATR ? ta.atr(Periods) : atr2
up = src - (Multiplier * atr)
up1 = na(up[1]) ? up : up[1]
up := close[1] > up1 ? math.max(up, up1) : up
dn = src + (Multiplier * atr)
dn1 = na(dn[1]) ? dn : dn[1]
dn := close[1] < dn1 ? math.min(dn, dn1) : dn

// --- WoW Trends Logic ---
var trend = 1
trend := na(trend[1]) ? 1 : trend
trend := trend == -1 and close > dn1 ? 1 : trend == 1 and close < up1 ? -1 : trend

// --- VPS Logic (Vijay Prasad Strategy) ---
vpsVolatilityCondition = (high - low) > (1.5 * ta.sma(ta.tr, 20))  // VPS condition based on volatility
vpsTrendCondition = trend == 1  // VPS condition to check if trend is up
vpsSignal = vpsVolatilityCondition and vpsTrendCondition  // Combine both VPS conditions

// --- Buy/Sell Signal Logic ---
buySignal = trend == 1 and trend[1] == -1  // Signal to Buy (when trend switches to up)
sellSignal = trend == -1 and trend[1] == 1  // Signal to Sell (when trend switches to down)

// --- Combined Buy/Sell Signal Logic (WoW Trends + VPS) ---
combinedBuySignal = buySignal and vpsSignal
combinedSellSignal = sellSignal and vpsSignal

// --- Plot WoW Trends Lines using plot() ---
plot(trend == 1 ? up : na, title="Up Trend", color=color.green, linewidth=2)
plot(trend == -1 ? dn : na, title="Down Trend", color=color.red, linewidth=2)

// --- Plot VPS Signals ---
plotshape(vpsSignal and showsignals, title="VPS Signal", text="VPS", location=location.abovebar, style=shape.triangledown, size=size.small, color=color.blue, textcolor=color.white)

// --- Plot Combined Buy/Sell Signals ---
plotshape(combinedBuySignal and showsignals, title="Combined Buy Signal", text="BUY", location=location.belowbar, style=shape.labelup, size=size.small, color=color.green, textcolor=color.white)
plotshape(combinedSellSignal and showsignals, title="Combined Sell Signal", text="SELL", location=location.abovebar, style=shape.labeldown, size=size.small, color=color.red, textcolor=color.white)

// --- Strategy Entries ---
if (combinedBuySignal)
    strategy.entry("BUY", strategy.long)

if (combinedSellSignal)
    strategy.entry("SELL", strategy.short)

// --- Highlight Bars for Buy/Sell Signals ---
barcolor(combinedBuySignal ? color.green : na, offset=-1)
barcolor(combinedSellSignal ? color.red : na, offset=-1)
Published by ChaoZhang on the FMZ strategy square · last modified 2024-12-27. Collected in the Quant Trading Vault. Unvalidated research: re-test with your own data and costs before trusting it.
Build this with AgenKit
A spec is not a trading system. Paste this into your coding agent and AgenKit runs a specialist team — architecture, test-first build, risk gates, review — with paper trading on by default.
/agenkit build a production-grade trading bot with a backtest engine, risk controls and paper trading by default from strategies/AI-Powered-Volatility-Price-System-Divergence-Trading-Strategy.md- npx agenkit install engineering-kit in your project
- Paste the command into your agent and approve each phase
- Get tests, backtest, risk controls and a paper-trading switch
Understand it first
Before you run this, read the lesson behind the idea and how to backtest it honestly. Specs like this one are the survivors of an unknown number of trials; deflate their results accordingly.
Related specs
- High Frequency Hybrid Technical Analysis Quantitative StrategyPine Script · Machine learning · 15m
- Liquidity Dynamic Risk Management Multi Factor Trading StrategyPine Script · Machine learning · 1h
- AI Driven Dynamic Volatility Adaptive Trend Breakout Trading StrategyPine Script · Machine learning · 2d
- Multi Indicator Dynamic Adaptive Quantitative Trading StrategyPine Script · Machine learning · 1h
- kNN based Trend Following StrategyPine Script · Machine learning · 1h
- Bollinger Bands Fibonacci Retracement Trading StrategyPine Script · Machine learning · 2h