Strategy vault / Mean reversion
An Analysis of Quantitative Trading Strategy Based on Gaussian Error Function
This strategy is a quantitative trading strategy based on P-Signal indicator calculated by Gaussian error function to measure price changes. It uses P-Signal to determine price trend and turning points for entries…
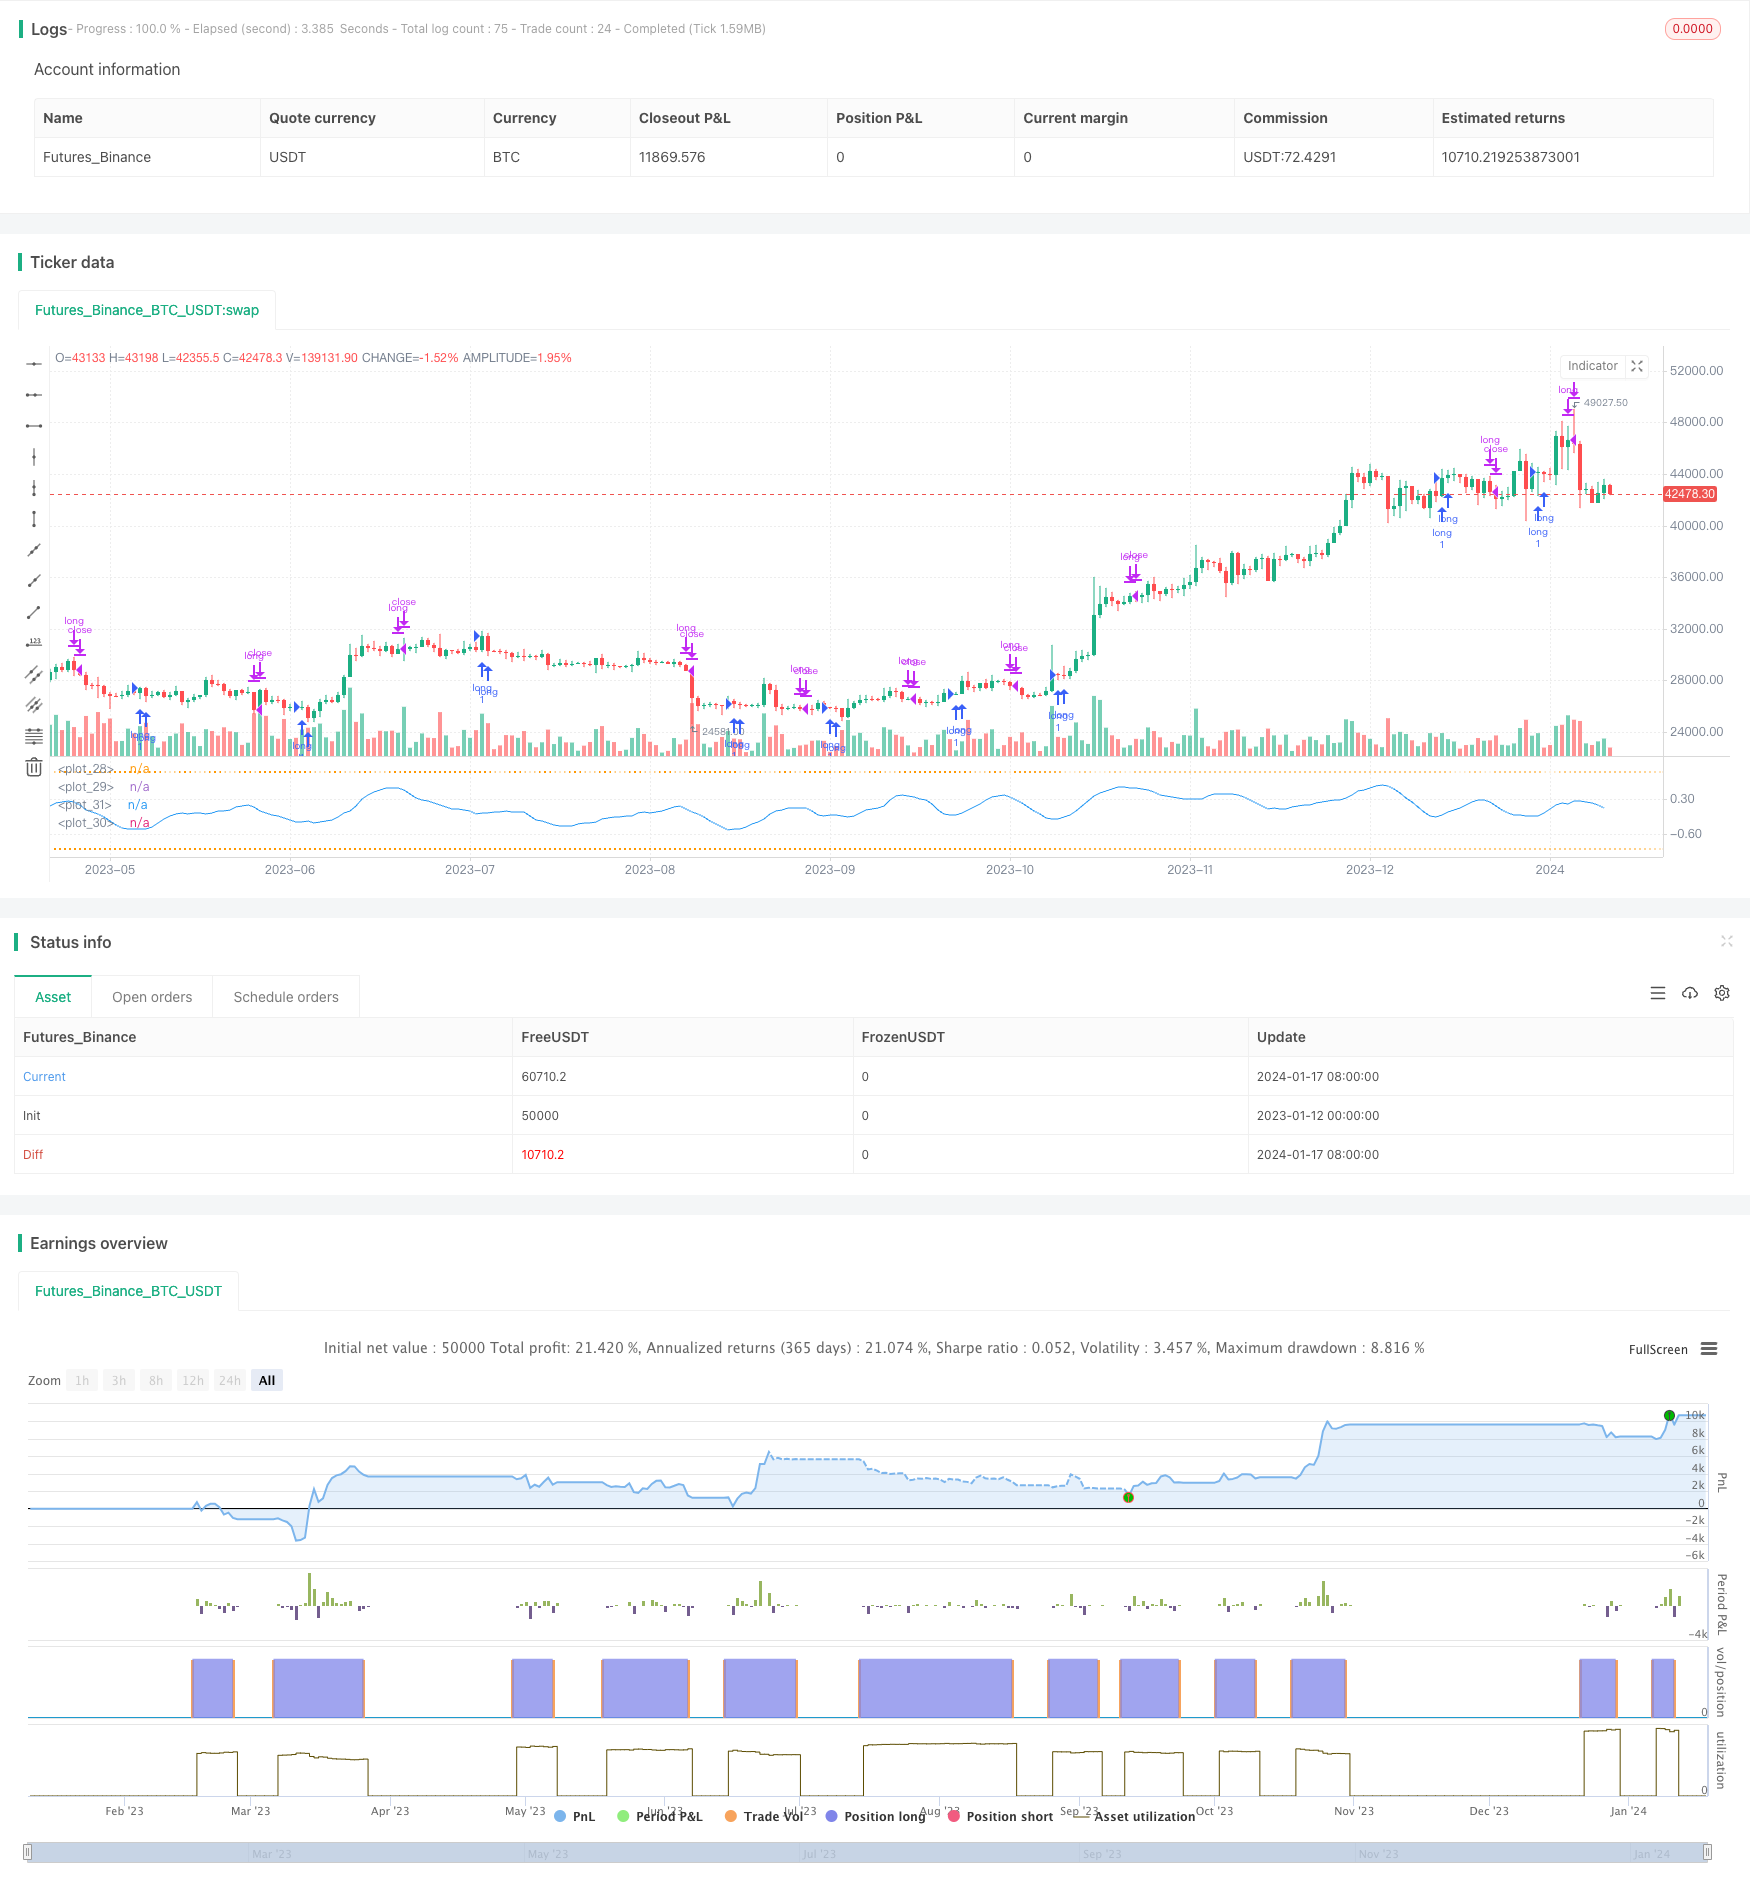
Overview
This strategy is a quantitative trading strategy based on P-Signal indicator calculated by Gaussian error function to measure price changes. It uses P-Signal to determine price trend and turning points for entries and exits.
Strategy Logic
The core indicator of this strategy is P-Signal. The calculation formula of P-Signal is:
fPSignal(ser, int) =>
    nStDev = stdev(ser, int)
    nSma = sma(ser, int)
    fErf(nStDev > 0 ? nSma/nStDev/sqrt(2) : 1.0)
Here ser represents the price series, int represents the parameter nPoints, which is the number of bars to look back. This formula consists of three parts:
- nStDev is the standard deviation of price;
- nSma is the simple moving average of price;
- fErf is the Gaussian error function.
The meaning of the whole formula is to take the moving average of price divided by the standard deviation of price, then divided by sqrt(2) for standardization, and finally mapped to (-1, 1) range by the Gaussian error function. That is, if the price fluctuation is greater than the average, P-Signal is close to 1; if the price fluctuation is less than the average, P-Signal is close to -1.
The strategy uses the value of P-Signal and the sign of its change to determine entries and exits:
strategy.entry("long", strategy.long, 1, when = nPSignal < 0 and ndPSignal > 0)

strategy.close("long", when = nPSignal > 0 and ndPSignal < 0)
It goes long when P-Signal is less than 0 and change to positive. It closes position when P-Signal is greater than 0 and change to negative.
Advantages
The advantages of this strategy include:
- Using Gaussian error function to fit price distribution. Gaussian error function can fit normal distribution very well, which is in line with most financial time series distributions.
- Automatically adjusting parameters by standard deviation of price. This makes the strategy more robust across different market conditions.
- P-Signal combines the advantages of trend following and mean reversion. It considers both price fluctuation trend and reversal points, which helps capturing opportunities in both trend trading and reversal trading.
Risks
There are also some risks with this strategy:
- High frequency trading risk. As a typical high frequency trading strategy, it may generate more trades, thus bearing higher transaction costs and slippage risks.
- Underperformance in ranging markets. P-Signal may produce many false signals when price has no clear trend or pattern.
- Difficult parameter optimization. Complex relationship between multiple parameters makes parameter optimization challenging.
To reduce those risks, some measures can be taken into consideration: adding filters to reduce trade frequency; optimizing parameter combination and transaction costs setting; live testing and choosing suitable products.
Enhancement
There is room for further enhancement:
- Adding filters to avoid false signals, eg. AND/OR with other indicators to filter out some noise.
- Optimizing parameter combination. Adjusting the size of nPoints across different products and timeframes to improve stability.
- Considering dynamic parameters. Adaptively adjusting nPoints according to market volatility may improve robustness.
- Incorporating machine learning methods. Using AI algorithms on parameters, filters and cross-product timing optimization.
Conclusion
In conclusion, the core idea of this strategy is innovative, fitting price distribution with Gaussian function and automatically adjusting parameters. But as a high frequency trading strategy, it requires further testing and optimization on risk control and parameter tuning before stable profitability in live trading, especially as a high frequency trading strategy.
Parameters
| Name | Default | What it controls |
|---|---|---|
| v_input_1 | 9 | (?Parameters of observation.)Number of Bars |
Source Pine Script
/*backtest
start: 2023-01-12 00:00:00
end: 2024-01-18 00:00:00
period: 1d
basePeriod: 1h
exchanges: [{"eid":"Futures_Binance","currency":"BTC_USDT"}]
*/

// **********************************************************************************************************
// This source code is subject to the terms of the Mozilla Public License 2.0 at https://mozilla.org/MPL/2.0/
// P-Signal Strategy © Kharevsky
// @version=4
// **********************************************************************************************************
strategy("P-Signal Strategy", precision = 3)
// Parameters and const of P-Signal.
nPoints = input(title = "Number of Bars", type = input.integer, defval = 9, minval = 4, maxval = 100, group = "Parameters of observation.")
int nIntr = nPoints - 1
// Horner's method for the error (Gauss) & P-Signal functions.
fErf(x) =>
    nT = 1.0/(1.0 + 0.5*abs(x))
    nAns = 1.0 - nT*exp(-x*x - 1.26551223 +
     nT*( 1.00002368 + nT*( 0.37409196 + nT*( 0.09678418 +
     nT*(-0.18628806 + nT*( 0.27886807 + nT*(-1.13520398 +
     nT*( 1.48851587 + nT*(-0.82215223 + nT*( 0.17087277 ))))))))))
    x >= 0 ? nAns : -nAns
fPSignal(ser, int) =>
    nStDev = stdev(ser, int)
    nSma = sma(ser, int)
    fErf(nStDev > 0 ? nSma/nStDev/sqrt(2) : 1.0)
// Strat.
float nPSignal = sma(fPSignal(change(ohlc4), nIntr), nIntr)
float ndPSignal = sign(nPSignal[0] - nPSignal[1])
strategy.entry("long", strategy.long, 1, when = nPSignal < 0 and ndPSignal > 0)
strategy.close("long", when = nPSignal > 0 and ndPSignal < 0)
// Plotting.
hline(+1.0, color = color.new(color.orange,70), linestyle = hline.style_dotted)
hline(-1.0, color = color.new(color.orange,70), linestyle = hline.style_dotted)
plot(nPSignal, color = color.blue, style = plot.style_line)
plot(strategy.position_size, color = color.white, style = plot.style_cross)
// Alerts.
if(strategy.position_size[0] > strategy.position_size[1])
    alert("P-Signal strategy opened the long position: " + syminfo.tickerid + " " + timeframe.period, alert.freq_once_per_bar)
if(strategy.position_size[0] < strategy.position_size[1])
    alert("P-Signal strategy closed the long position: " + syminfo.tickerid + " " + timeframe.period, alert.freq_once_per_bar)
// The end.
Published by ChaoZhang on the FMZ strategy square · last modified 2024-01-19. Collected in the Quant Trading Vault. Unvalidated research: re-test with your own data and costs before trusting it.
Build this with AgenKit
A spec is not a trading system. Paste this into your coding agent and AgenKit runs a specialist team — architecture, test-first build, risk gates, review — with paper trading on by default.
/agenkit build a production-grade trading bot with a backtest engine, risk controls and paper trading by default from strategies/An-Analysis-of-Quantitative-Trading-Strategy-Based-on-Gaussian-Error-Function.md- npx agenkit install engineering-kit in your project
- Paste the command into your agent and approve each phase
- Get tests, backtest, risk controls and a paper-trading switch
Understand it first
Before you run this, read the lesson behind the idea and how to backtest it honestly. Specs like this one are the survivors of an unknown number of trials; deflate their results accordingly.
Related specs
- 3 10 Oscillator Profile Flagging StrategyPine Script · Mean reversion · 1d
- A Trend Reversal Strategy Based on Moving Averages Price Patterns and VolumePine Script · Mean reversion · 1d
- Adaptive Mean Reversion Trading Strategy Based on Chande Momentum OscillatorPine Script · Mean reversion · 1d
- Adaptive Trading Strategy Combining Dynamic Trend Reversal and Stochastic IndicatorPine Script · Mean reversion · 1d
- Advanced 15 Minute Chart Trading Signal StrategyPine Script · Mean reversion · 3h
- Advanced Momentum EMA Trend Following with RSI Overbought Oversold Trading StrategyPine Script · Mean reversion · 1d