Strategy vault / Trend following
An Efficient Trading Strategy Based on Dual Moving Average Crossover and Stop Loss
EfficiVision Trader is an efficient trading strategy based on the crossover of two moving averages (MA) with different periods and a stop loss mechanism. The strategy uses these two moving averages to determine the…
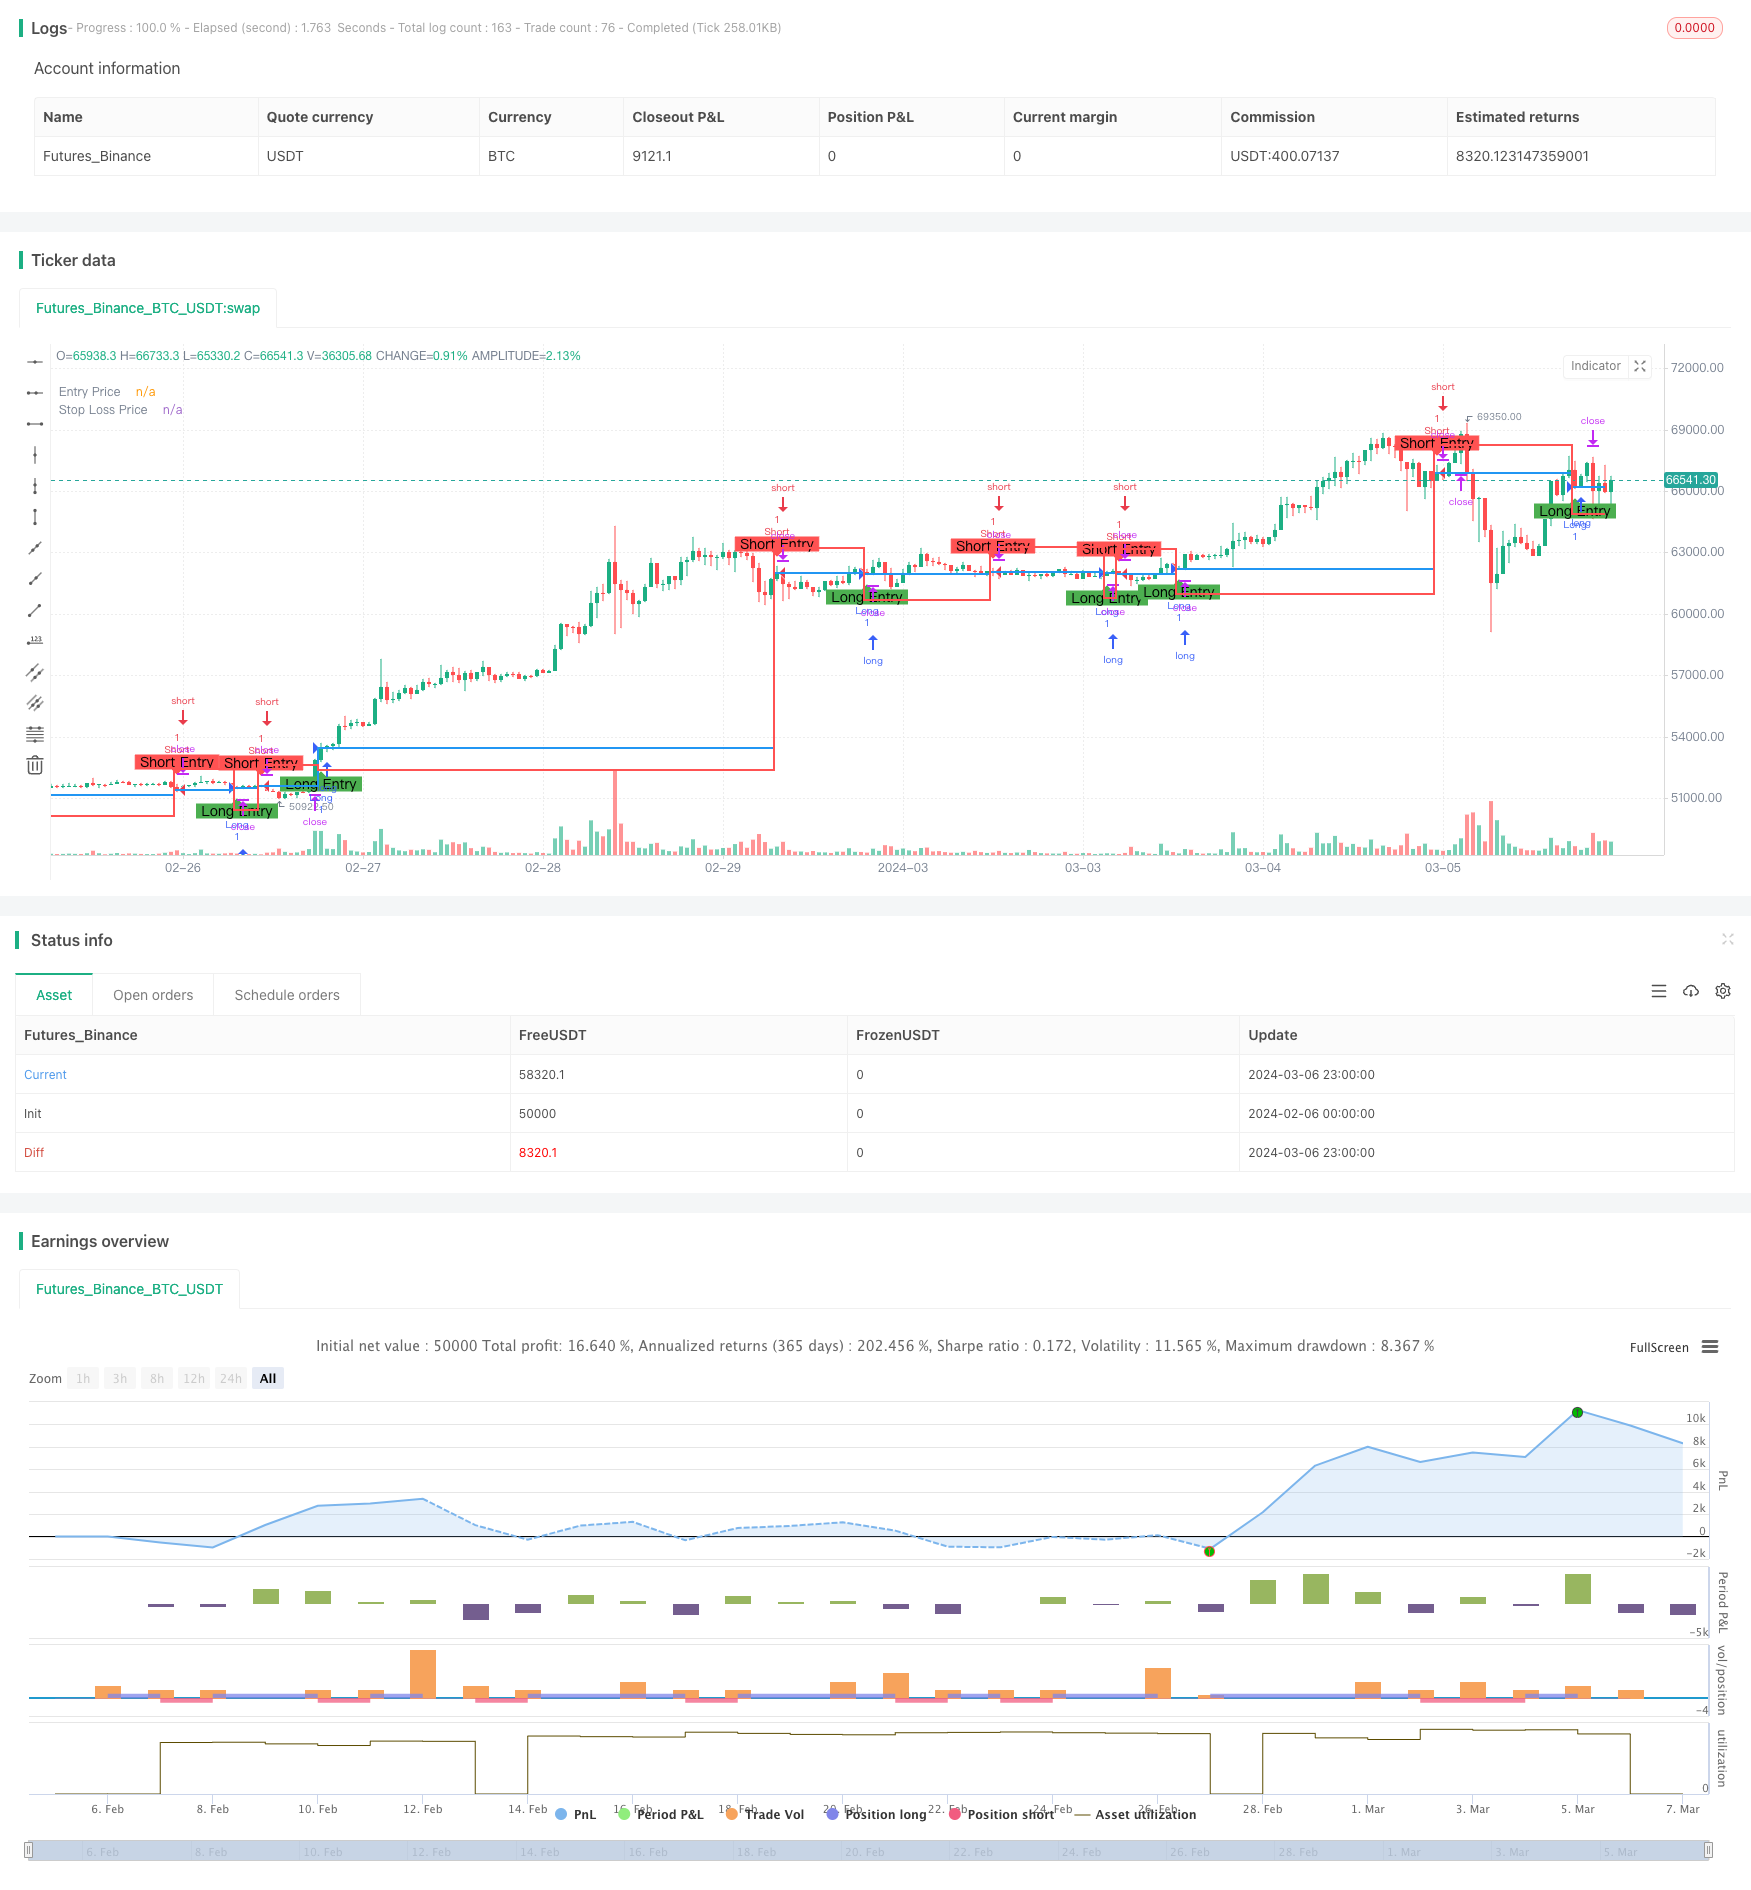
Overview
EfficiVision Trader is an efficient trading strategy based on the crossover of two moving averages (MA) with different periods and a stop loss mechanism. The strategy uses these two moving averages to determine the market trend and decides the entry direction based on the crossover. At the same time, the strategy employs a stop loss mechanism to control risk by setting a stop loss price.
Strategy Principle
The core principle of EfficiVision Trader is to use two moving averages with different periods (in this strategy, 10-day MA and 20-day MA) to determine the market trend. When the short-term MA (10-day MA) crosses above the long-term MA (20-day MA), it indicates an upward trend in the market, and the strategy will open a long position. Conversely, when the short-term MA crosses below the long-term MA, it indicates a downward trend, and the strategy will open a short position.
To control risk, the strategy incorporates a stop loss mechanism. When opening a position, the strategy calculates the stop loss price based on the current price and a predefined stop loss percentage (default is 2% in this strategy). If the market price reaches the stop loss price, the strategy will automatically close the position to minimize further losses.
In summary, EfficiVision Trader captures market trends through MA crossovers and controls risk through a stop loss mechanism, achieving efficient trading.
Advantage Analysis
Simple and effective: EfficiVision Trader uses the simple principle of dual moving average crossover to determine market trends, which is easy to understand and implement, and has good practicality.
Trend following: By using MA crossovers to identify trends, the strategy can help follow market trends and improve trading success rates.
Risk control: The stop loss mechanism effectively controls the maximum loss of a single trade, reducing the overall risk of the strategy.
Adaptability: The strategy can adapt to different market environments and trading instruments by adjusting parameters such as MA periods and stop loss percentages.
Risk Analysis
Market volatility risk: In cases of high market volatility, frequent MA crossovers may lead to excessive trading signals, increasing trading costs and risks.
Parameter optimization risk: The performance of the strategy depends on the choice of parameters such as MA periods and stop loss percentages. Inappropriate parameters may lead to poor strategy performance.
Trend reversal risk: During market trend reversals, the strategy may experience consecutive losing trades.
Black swan event risk: In the face of unpredictable extreme market events, the strategy may suffer significant losses.
To address these risks, the following optimizations and improvements can be made:
Introduce adaptive MA periods that dynamically adjust based on market volatility to reduce frequent trading.
Use multiple parameter sets for backtesting and select the best-performing combination, and periodically optimize parameters.
During trend reversals, reduce positions or suspend trading to mitigate losses.
Set reasonable risk limits to control the strategy's maximum drawdown and net value decline, and intervene manually when necessary.
Optimization Directions
Multi-timeframe analysis: Combine MA crossover signals from different timeframes to improve the accuracy of trend identification.
Introduce other technical indicators: Incorporate indicators such as RSI and MACD to build a multi-factor trading model and enhance the robustness of the strategy.
Dynamic stop loss: Dynamically adjust the stop loss percentage based on market volatility, using a wider stop loss when the trend is clear and a tighter stop loss when the trend is uncertain.
Position management: Dynamically adjust position sizes based on the strength of market trends and the strategy's net value, increasing positions when trends are strong and reducing positions when trends weaken or net value declines.
Machine learning optimization: Use machine learning algorithms to train on historical data, find optimal parameter combinations and trading rules, and continuously improve the strategy's performance.
These optimization directions can help EfficiVision Trader achieve more robust and efficient trading performance in different market environments while reducing overall risk.
Summary
EfficiVision Trader is an efficient trading strategy based on the crossover of two moving averages and a stop loss mechanism. It uses moving averages with different periods to determine market trends, decides entry direction based on MA crossovers, and employs a stop loss mechanism to control the risk of individual trades. The strategy is simple to use, adaptable, and can be optimized by fine-tuning parameters and introducing other technical indicators to improve its robustness and profitability.
However, in practical application, EfficiVision Trader also faces risks such as market volatility, parameter optimization, trend reversals, and black swan events. To better cope with these risks, we can optimize the strategy in multiple aspects, such as introducing adaptive MA periods, multi-timeframe analysis, dynamic stop loss, and position management. In addition, using machine learning algorithms to optimize the strategy is a promising direction.
Overall, EfficiVision Trader is a trading strategy with good potential. Through continuous optimization and improvement, it is expected to achieve stable profitability in various market environments. At the same time, we must fully recognize the risks and uncertainties of the trading market, apply the strategy cautiously, and make reasonable decisions based on our own risk preferences and trading goals.
Parameters
| Name | Default | What it controls |
|---|---|---|
| v_input_1 | 2 | Stop Loss Percentage |
Source Pine Script
/*backtest
start: 2024-02-06 00:00:00
end: 2024-03-07 00:00:00
period: 1h
basePeriod: 15m
exchanges: [{"eid":"Futures_Binance","currency":"BTC_USDT"}]
*/

//@version=5
strategy("EfficiVision Trader Strategy", overlay=true)

// Input parameters
// Define the conditions for entering a long trade and a short trade
longCondition = ta.crossover(ta.sma(close, 10), ta.sma(close, 20)) // Long condition: 10 SMA crosses above 20 SMA
shortCondition = ta.crossunder(ta.sma(close, 10), ta.sma(close, 20)) // Short condition: 10 SMA crosses below 20 SMA
stopLossPerc = input(2.0, title="Stop Loss Percentage") // Percentage for calculating stop loss

var float entryPrice = na // Price at which the trade is entered
var float stopLossPrice = na // Price at which the stop loss is set

// Calculate stop loss based on the current price and the stop loss percentage
if (longCondition)
    entryPrice := close
    stopLossPrice := close * (1 - stopLossPerc / 100) // Calculate stop loss for long trades
if (shortCondition)
    entryPrice := close
    stopLossPrice := close * (1 + stopLossPerc / 100) // Calculate stop loss for short trades

// Enter long trade when long condition is met
if (longCondition)
    strategy.entry("Long", strategy.long)

// Enter short trade when short condition is met
if (shortCondition)
    strategy.entry("Short", strategy.short)

// Exit long trade when stop loss price is reached
strategy.exit("Exit Long", "Long", stop=stopLossPrice)

// Exit short trade when stop loss price is reached
strategy.exit("Exit Short", "Short", stop=stopLossPrice)

// Plot entry and stop-loss levels on the chart
plotshape(series=longCondition, location=location.belowbar, color=color.green, style=shape.labelup, text="Long Entry")
plotshape(series=shortCondition, location=location.abovebar, color=color.red, style=shape.labeldown, text="Short Entry")
plot(entryPrice, color=color.blue, style=plot.style_stepline, linewidth=2, title="Entry Price")
plot(stopLossPrice, color=color.red, style=plot.style_stepline, linewidth=2, title="Stop Loss Price")
Published by ChaoZhang on the FMZ strategy square · last modified 2024-03-08. Collected in the Quant Trading Vault. Unvalidated research: re-test with your own data and costs before trusting it.
Build this with AgenKit
A spec is not a trading system. Paste this into your coding agent and AgenKit runs a specialist team — architecture, test-first build, risk gates, review — with paper trading on by default.
/agenkit build a production-grade trading bot with a backtest engine, risk controls and paper trading by default from strategies/An-Efficient-Trading-Strategy-Based-on-Dual-Moving-Average-Crossover-and-Stop-Loss.md- npx agenkit install engineering-kit in your project
- Paste the command into your agent and approve each phase
- Get tests, backtest, risk controls and a paper-trading switch
Understand it first
Before you run this, read the lesson behind the idea and how to backtest it honestly. Specs like this one are the survivors of an unknown number of trials; deflate their results accordingly.
Related specs
- ADX MA and EMA Long Only Trend Tracking StrategyPine Script · Trend following · 1d
- ATR and Moving Average Crossover Hybrid StrategyPine Script · Trend following · 1h
- Adaptive FVG Detection and MA Trend Trading Strategy with Dynamic ResistancePine Script · Trend following · 1d
- Adaptive Risk Management Strategy Based on Dynamic ATR and Moving Average CrossoverPine Script · Trend following · 2h
- Adaptive Trading Strategy Based on Stochastic RSI Dual Line CrossoverPine Script · Trend following · 4h
- Adaptive Volatility Based Trend Following Short Strategy with Time Delay and Stop Loss ProtectionPine Script · Trend following · 2m