Strategy vault / Mean reversion
An Oscillating Momentum Reversal Moving Average Crossover Strategy
This strategy is a momentum reversal trading strategy based on the MACD indicator. It generates the MACD indicator by calculating the difference between fast and slow moving average lines. When the MACD indicator…
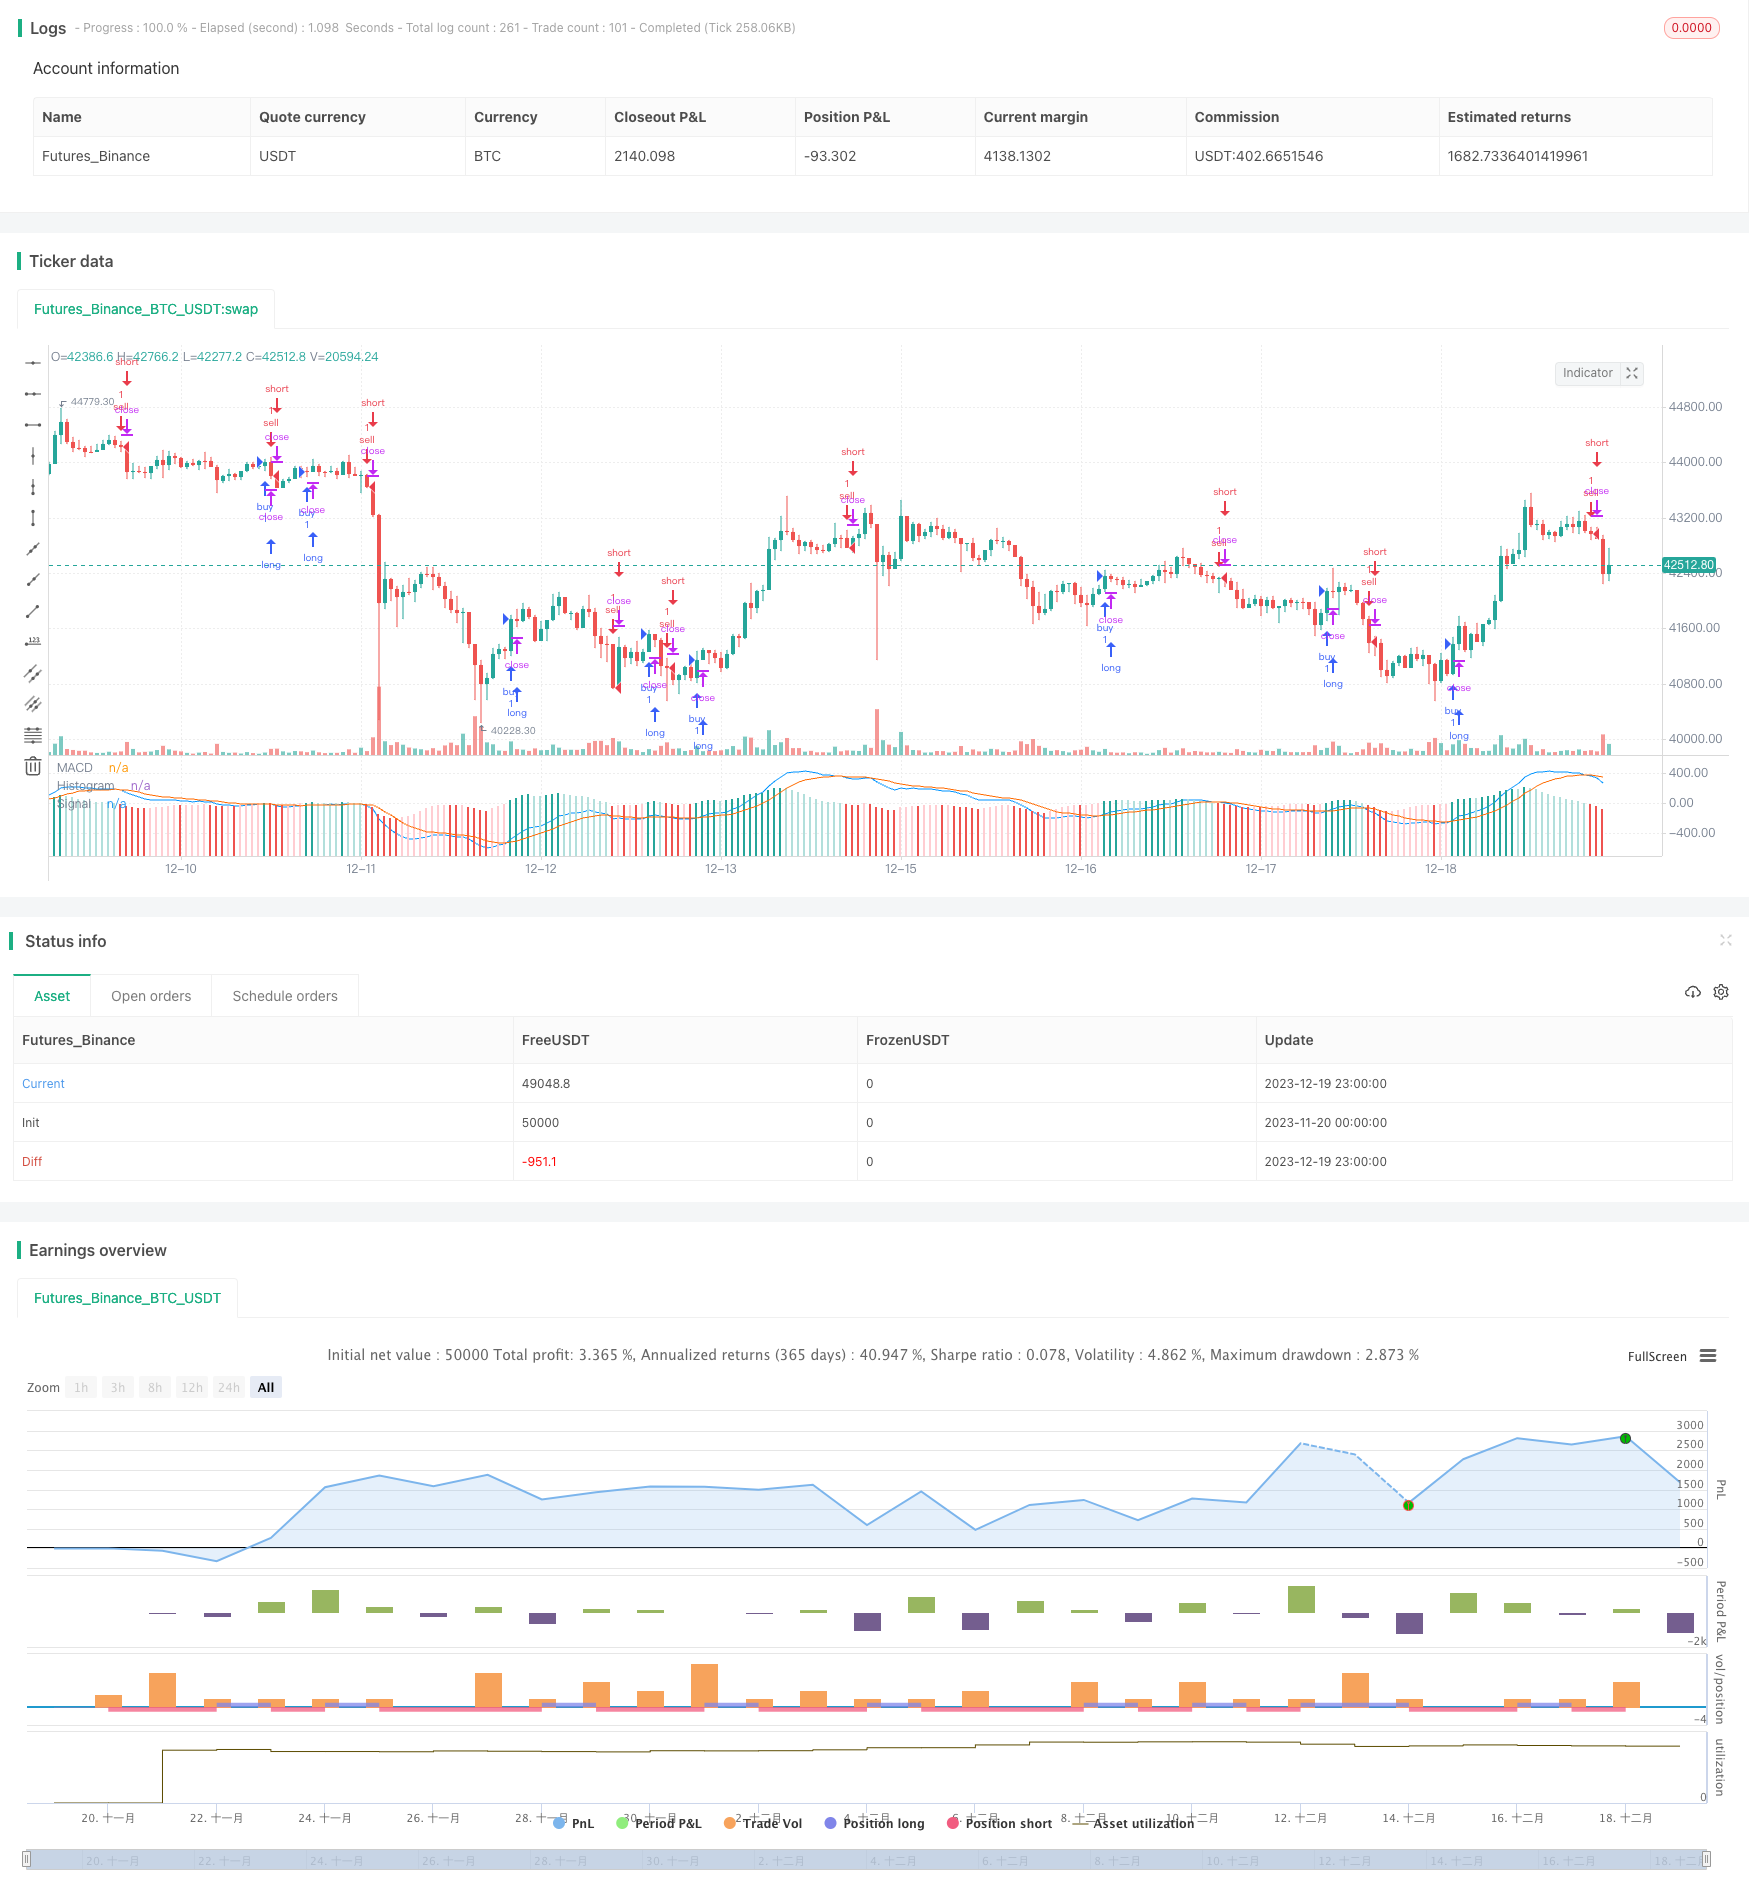
Overview
This strategy is a momentum reversal trading strategy based on the MACD indicator. It generates the MACD indicator by calculating the difference between fast and slow moving average lines. When the MACD indicator turns from positive to negative, a sell signal is generated. When the MACD indicator turns from negative to positive, a buy signal is generated. This strategy also incorporates the signal line of the MACD indicator for additional smoothing to filter out some noisy trading signals.
Strategy Principle
The core indicator of this strategy is the MACD, which consists of fast moving average, slow moving average and signal line. First, fast EMA with a period of 12 days and slow EMA with a period of 26 days are calculated, then the difference between them is computed as the MACD indicator. The MACD indicator reflects the trend of price changes based on the momentum concept. When the fast EMA rises faster than the slow EMA, it indicates an upward trend of the price, and the MACD is positive. On the contrary, when the stock price is in a downward trend, the MACD is negative.
To filter noise, this strategy introduces a signal line indicator to smooth the MACD additionally. The signal line parameter is set to 9-day EMA. Finally, the difference between the MACD and signal line is calculated as trading signals. When the difference changes from positive to negative, a sell signal is generated. When the difference changes from negative to positive, a buy signal is generated.
Advantage Analysis
The main advantages of this strategy are:
Using the MACD indicator to determine price reversal points, it can capture short-term reversal opportunities of stock prices.
Incorporating signal line smoothing filters out some noisy trading signals and reduces false signals.
Flexible parameter settings allow traders to adjust parameters according to actual market conditions.
The logic is simple and clear, easy to understand and implement, suitable for beginners to learn and research.
Diverse combinations of indicators and signals provide large room for strategy optimization and strong scalability.
Risk Analysis
There are also some risks in this strategy:
Tracking short-term reversals may increase trading frequency and transaction costs.
MACD indicator can easily generate false signals during long term unilateral rises or falls in prices.
Delayed signal generation due to improper parameter settings may miss the best entry point.
This relatively simple strategy may underperform in complex market conditions.
To mitigate the above risks, improvements can be made in the following ways:
Optimize parameters to reduce trading frequency, e.g. increase signal line cycle.
Add filtering conditions to avoid being trapped during long term trends, e.g. combine other tracking indicators to determine long and short term trends.
Use limit orders to track optimal pricing.
Add more factors to determine market conditions and avoid trading in abnormal markets.
Optimization Directions
The strategy can be optimized in the following aspects:
Optimize MACD parameters and signal line parameters to find the best parameter combination.
Add other auxiliary indicators to determine long and short term trends and avoid trading against trends, e.g. Moving Average, Bollinger Bands etc.
Incorporate trading volume indicators such as On Balance Volume to avoid false breakouts.
Set parameters according to different stock characteristics to make the strategy more adaptive.
Add stop loss and take profit price settings to control single loss and profit levels.
Evaluate stock quality factors like financial metrics, rating changes etc. and select the optimal stock pool.
These optimization measures can enhance the stability, win rate and profit level of the strategy. It also lays the foundation for continued strategy development and improvement.
Summary
This is a typical short-term reversal trading strategy. It uses simple and clear MACD indicators to reflect changes in stock momentum and signal lines to determine specific entry points. With proper parameter settings, it can seize short-term price reversal opportunities to obtain excess returns.
Of course, any single indicator and simple strategy can hardly perfectly adapt to various complex market conditions. Investors should pay attention to risks and choose strategies according to their own conditions and risk appetite. Meanwhile, they should also keep an eye on market conditions, optimize strategy parameters and trading rules. Only through continuous learning and improvement can one obtain long-term stable investment returns.
Parameters
| Name | Default | What it controls |
|---|---|---|
| v_input_1 | 2017 | Year |
| v_input_2 | 12 | Fast Length |
| v_input_3 | 26 | Slow Length |
| v_input_4 | false | Buy histogram value |
| v_input_5 | false | Sell histogram value |
| v_input_6_close | 0 | Source: close | high | low | open | hl2 | hlc3 | hlcc4 | ohlc4 |
| v_input_7 | 9 | Signal Smoothing |
| v_input_8 | false | Simple MA(Oscillator) |
| v_input_9 | false | Simple MA(Signal Line) |
Source Pine Script
/*backtest
start: 2023-11-20 00:00:00
end: 2023-12-20 00:00:00
period: 1h
basePeriod: 15m
exchanges: [{"eid":"Futures_Binance","currency":"BTC_USDT"}]
*/

//@version=4
//study(title="MACD Strategy by Sedkur", shorttitle="MACD Strategy by Sedkur")
strategy (title="MACD Strategy by Sedkur", shorttitle="MACD Strategy by Sedkur")


// Getting inputs
dyear = input(title="Year", type=input.integer, defval=2017, minval=1950, maxval=2500)
fast_length = input(title="Fast Length", type=input.integer, defval=12)
slow_length = input(title="Slow Length", type=input.integer, defval=26)
buyh = input(title="Buy histogram value", type=input.float, defval=0.0, minval=-1000, maxval=1000, step=0.1)
sellh = input(title="Sell histogram value", type=input.float, defval=0.0, minval=-1000, maxval=1000, step=0.1)
src = input(title="Source", type=input.source, defval=close)
signal_length = input(title="Signal Smoothing", type=input.integer, minval = 1, maxval = 50, defval = 9)
sma_source = input(title="Simple MA(Oscillator)", type=input.bool, defval=false)
sma_signal = input(title="Simple MA(Signal Line)", type=input.bool, defval=false)

// Plot colors
col_grow_above = #26A69A
col_grow_below = #FFCDD2
col_fall_above = #B2DFDB
col_fall_below = #EF5350
col_macd = #0094ff
col_signal = #ff6a00

// Calculating
fast_ma = sma_source ? sma(src, fast_length) : ema(src, fast_length)
slow_ma = sma_source ? sma(src, slow_length) : ema(src, slow_length)
macd = fast_ma - slow_ma
signal = sma_signal ? sma(macd, signal_length) : ema(macd, signal_length)
hist = macd - signal

plot(hist, title="Histogram", style=plot.style_columns, color=(hist>=0 ? (hist[1] < hist ? col_grow_above : col_fall_above) : (hist[1] < hist ? col_grow_below : col_fall_below) ), transp=0 )
plot(macd, title="MACD", color=col_macd, transp=0)
plot(signal, title="Signal", color=col_signal, transp=0)

strategy.entry("buy", strategy.long, comment="buy", when = hist[1] <= hist and buyh<=hist and year>=dyear)
strategy.entry("sell", strategy.short, comment="sell", when = hist[1] >= hist and sellh>=hist and year>=dyear)
Published by ChaoZhang on the FMZ strategy square · last modified 2023-12-21. Collected in the Quant Trading Vault. Unvalidated research: re-test with your own data and costs before trusting it.
Build this with AgenKit
A spec is not a trading system. Paste this into your coding agent and AgenKit runs a specialist team — architecture, test-first build, risk gates, review — with paper trading on by default.
/agenkit build a production-grade trading bot with a backtest engine, risk controls and paper trading by default from strategies/An-Oscillating-Momentum-Reversal-Moving-Average-Crossover-Strategy.md- npx agenkit install engineering-kit in your project
- Paste the command into your agent and approve each phase
- Get tests, backtest, risk controls and a paper-trading switch
Understand it first
Before you run this, read the lesson behind the idea and how to backtest it honestly. Specs like this one are the survivors of an unknown number of trials; deflate their results accordingly.
Related specs
- Advanced 15 Minute Chart Trading Signal StrategyPine Script · Mean reversion · 3h
- BONK Multi Factor Trading StrategyPine Script · Mean reversion · 1d
- Customizable Non Repainting HTF MACD MFI Scalable Bot StrategyPine Script · Mean reversion · 1d
- Dynamic Adaptive Multi Timeframe Trend Following and Range Reversal Hybrid StrategyPine Script · Mean reversion · 2d
- MACD Cross Period Trading StrategyPine Script · Mean reversion · 1d
- MACD Double Optimization Trading StrategyPine Script · Mean reversion · 1d