Strategy vault / Mean reversion
Anchored Rolling CVDVWAP Signal Strategy
The Anchored Rolling CVDVWAP Signal strategy is a complex technical analysis indicator designed for the TradingView platform. It integrates the concepts of Anchored Volume Weighted Average Price (VWAP), Cumulative…
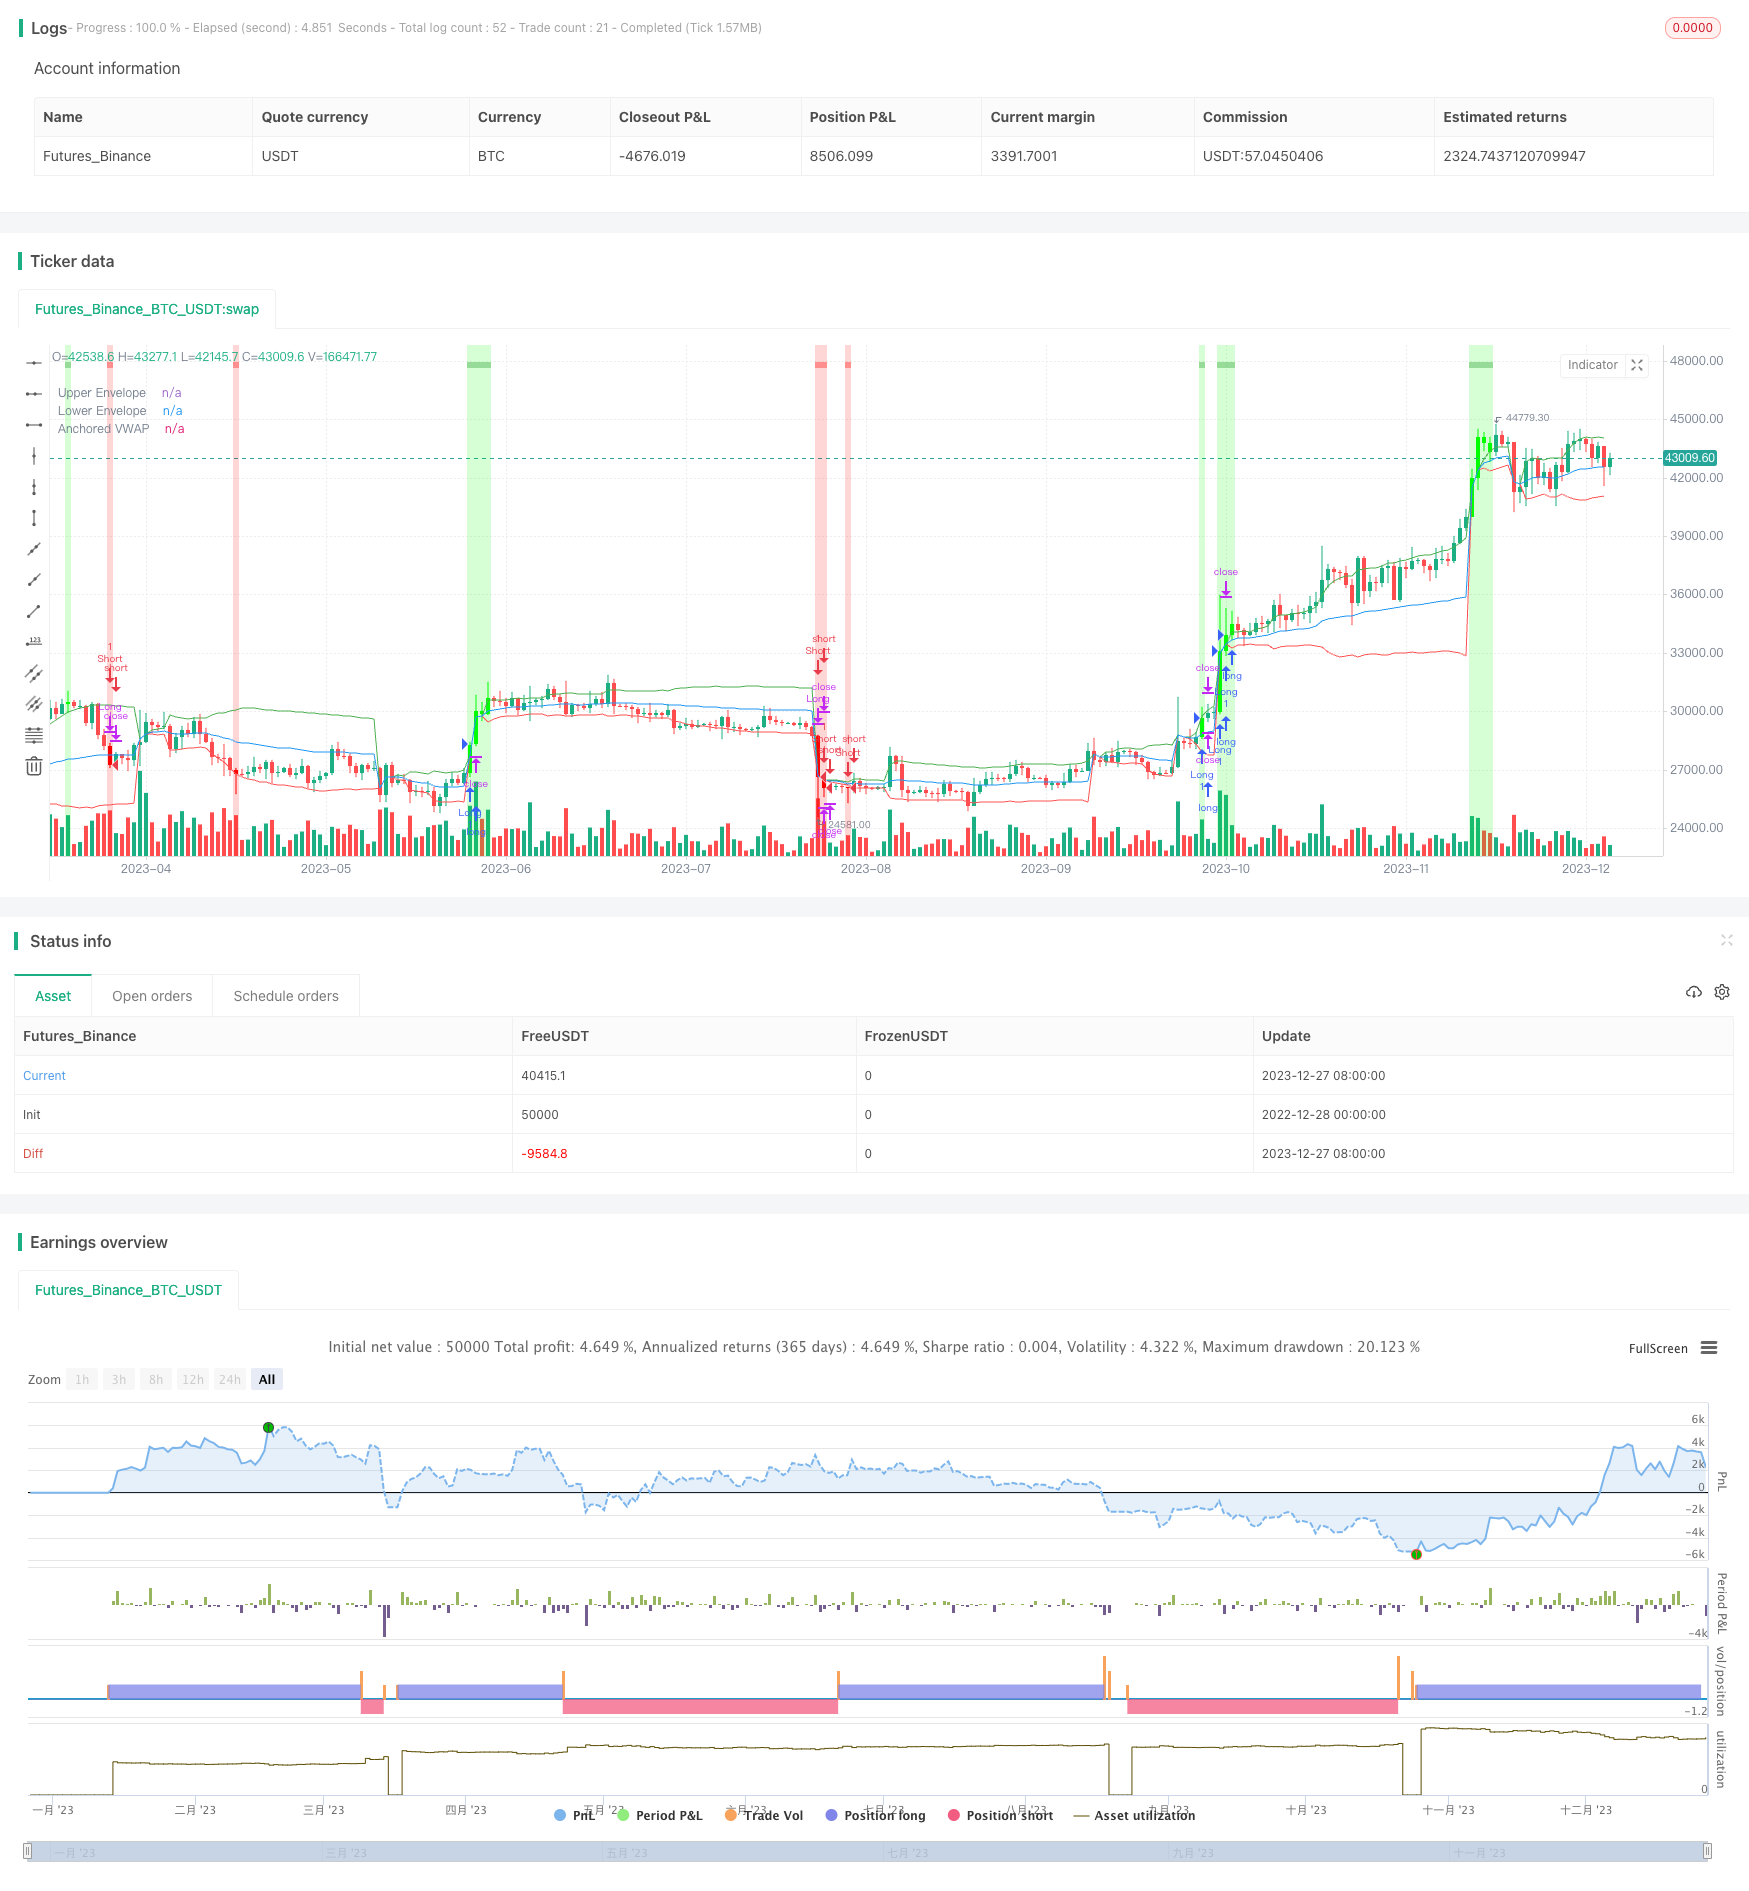
Overview
The Anchored Rolling CVDVWAP Signal strategy is a complex technical analysis indicator designed for the TradingView platform. It integrates the concepts of Anchored Volume Weighted Average Price (VWAP), Cumulative Volume Delta (CVD), and standard deviation analysis to generate entry and exit signals for trading.
Strategy Logic
The core of this strategy is to calculate an anchored VWAP, which starts the VWAP calculation from a specific "anchor bar" that has the highest volume over a user-defined period. Then an envelope band calculated through standard deviation is plotted based on this anchored VWAP to reflect overbought/oversold areas. Meanwhile, the Rate of Change (ROC) indicator detects "dips" and "rips" patterns combined with CVD filter signals to generate buy and sell signals. These signals can be toggled to repeat or wait for current signal to exit before sending next signal.
Advantages
- Utilize volume weighted average price to identify value areas and support/resistance levels
- Standard deviation envelope bands highlight overextended price moves
- CVD volume indicator reflects underlying buying/selling pressure
- Clear entry and exit signals
- Auto stop loss and take profit for risk management
Risk Analysis
- Improper parameter settings may cause missed trades or invalid signals
- Needs to combine with more indicators for decision making instead of using alone
- Requires optimization for different products and timeframes
- Poor stop loss and take profit positioning brings larger losses
Optimization Directions
- Adjust anchor bar selection logic with moving averages etc.
- Try different standard deviation multiples for envelope bands
- Optimize ROC parameters to suit volatility characteristics
- Set dynamic slippage or adaptive stops for volatile markets
Conclusion
The Anchored Rolling CVDVWAP Signal strategy synthesizes various indicators to assess price action and buying/selling momentum, which is very helpful for discovering trading opportunities. But still needs to be used cautiously, requiring continual testing and optimizations to fit one's own trading strategy.
Parameters
| Name | Default | What it controls |
|---|---|---|
| v_input_int_1 | 20 | (?Settings)Rolling VWAP Anchor Period |
| v_input_float_1 | 2 | Standard Deviation Multiplier for Envelope |
| v_input_int_2 | 7 | Analysis Period |
| v_input_bool_3 | false | Toggle Signals |
| v_input_float_3 | -8 | Down (%) |
| v_input_float_4 | 8 | Up (%) |
| v_input_bool_1 | true | (?Filters)Use Anchored VWAP Filter |
| v_input_bool_2 | true | Use CVD Filter |
| v_input_int_3 | 20 | CVD Length |
| v_input_float_2 | 200 | (?Trade Settings)Take Profit % of SL Distance |
| v_input_int_4 | 200 | Stop Loss Lookback Period |
Source Pine Script
/*backtest
start: 2022-12-28 00:00:00
end: 2023-12-28 00:00:00
period: 1d
basePeriod: 1h
exchanges: [{"eid":"Futures_Binance","currency":"BTC_USDT"}]
*/

//@version=5
strategy('Anchored Rolling CVDVWAP Signal Strategy', overlay=true)

// User-defined settings
vwapAnchorPeriod = input.int(20, title="Rolling VWAP Anchor Period", group="Settings")
stdDevMult = input.float(2.0, title="Standard Deviation Multiplier for Envelope", group="Settings")
analysis_period = input.int(7, minval=1, maxval=100, title="Analysis Period", group="Settings")
useVwapFilter = input.bool(true, title="Use Anchored VWAP Filter", group="Filters")
useCvdFilter = input.bool(true, title="Use CVD Filter", group="Filters")
cvdLength = input.int(20, title="CVD Length", group="Filters")
tpPercent = input.float(200.0, title="Take Profit % of SL Distance", group="Trade Settings")
slPeriods = input.int(200, title="Stop Loss Lookback Period", group="Trade Settings")
toggleSignals = input.bool(false, title="Toggle Signals", group="Settings")

// Finding the anchor bar
highestVol = ta.highest(volume, vwapAnchorPeriod)
var int anchorBar = na
if volume == highestVol
    anchorBar := bar_index

// Initializing variables for anchored VWAP and envelope calculation
var float avwapNumerator = na
var float avwapDenominator = na
var float anchoredVwap = na
var float sum = 0.0
var int count = 0
var float sumDev = 0.0

// Calculating Anchored VWAP and envelope
if not na(anchorBar)
    if bar_index == anchorBar
        avwapNumerator := high * volume + low * volume + close * volume
        avwapDenominator := volume * 3
        sum := 0.0
        count := 0
        sumDev := 0.0
    else if bar_index > anchorBar
        avwapNumerator := avwapNumerator[1] + high * volume + low * volume + close * volume
        avwapDenominator := avwapDenominator[1] + volume * 3
        sum := sum[1] + close
        count := count[1] + 1
        sumDev := sumDev[1] + math.pow(close - (sum / count), 2)
    anchoredVwap := avwapNumerator / avwapDenominator

// Standard deviation envelope calculation
float mean = sum / math.max(count, 1)
float stDev = math.sqrt(sumDev / math.max(count, 1))
float upperBand = anchoredVwap + stdDevMult * stDev
float lowerBand = anchoredVwap - stdDevMult * stDev

// CVD calculation and filter application
cvd = ta.cum(volume - ta.sma(volume, cvdLength))
bool cvdCondition = useCvdFilter ? (cvd[1] < cvd and cvd > cvd[1]) : true

// Dip and Rip pattern detection
roc = ta.roc(close, analysis_period)
dip_move_value = input.float(-8, title="Down (%)", step=0.50, minval=-100, maxval=-0.01, group="Settings")
rip_move_value = input.float(8, title="Up (%)", step=0.50, minval=0.01, maxval=100.00, group="Settings")
dip = roc <= dip_move_value and cvdCondition and (not useVwapFilter or close < anchoredVwap)
rip = roc >= rip_move_value and cvdCondition and (not useVwapFilter or close > anchoredVwap)

// State variables for signals and TP/SL execution
var bool inTrade = false // If we are currently in a trade
var bool takeLong = false // If the last signal was a buy
var bool takeShort = false // If the last signal was a sell
var float tradeEntryPrice = na // The trade entry price
var float tradeSL = na // The current trade's Stop Loss level
var float tradeTP = na // The current trade's Take Profit level

// Setting SL and TP levels for the trade
tradeSL := dip ? ta.highest(high, slPeriods) : (rip ? ta.lowest(low, slPeriods) : tradeSL)
tradeTP := dip ? tradeEntryPrice - (tradeSL - tradeEntryPrice) * tpPercent / 100 : (rip ? tradeEntryPrice + (tradeEntryPrice - tradeSL) * tpPercent / 100 : tradeTP)

// Trade entry logic
if (dip or rip) and not inTrade
    tradeEntryPrice := close
    inTrade := true
    takeLong := rip
    takeShort := dip

// Trade exit logic at TP or SL
if inTrade and ((takeLong and (low < tradeSL or high > tradeTP)) or (takeShort and (high > tradeSL or low < tradeTP)))
    inTrade := false // Exit the trade

// Display logic for signals based on the toggle
bool showLongSignal = rip and (not toggleSignals or not takeLong)
bool showShortSignal = dip and (not toggleSignals or not takeShort)

// Reset signals if toggle is active and trade is exited
if toggleSignals and not inTrade
    takeLong := true
    takeShort := true

// Strategy entry and exit logic
if showLongSignal
    strategy.entry("Long", strategy.long)

if showShortSignal
    strategy.close("Long")

if showShortSignal
    strategy.entry("Short", strategy.short)

if showLongSignal
    strategy.close("Short")

// Plotting of entry signals, anchored VWAP, and envelope
plot(upperBand, title="Upper Envelope", color=color.green)
plot(lowerBand, title="Lower Envelope", color=color.red)
plot(anchoredVwap, title="Anchored VWAP", color=color.blue)

// Coloring and shapes for Dip and Rip
barcolor(dip ? color.rgb(255, 0, 0) : na, title="Down Bar Color")
bgcolor(dip ? color.rgb(255, 0, 0, 80) : na, title="Down Background Color")
plotshape(dip, title="Dip - Down", location=location.top, color=color.rgb(255, 82, 82, 45), style=shape.square, size=size.tiny)
barcolor(rip ? color.rgb(0, 255, 0) : na, title="Up Bar Color")
bgcolor(rip ? color.rgb(0, 255, 0, 80) : na, title="Up Background Color")
plotshape(rip, title="Rip - Up", location=location.top, color=color.rgb(76, 175, 79, 55), style=shape.square, size=size.tiny)

// Strategy exit conditions for TP and SL
strategy.exit("Take Profit Long", from_entry = "Long", limit = tradeTP)
strategy.exit("Stop Loss Long", from_entry = "Long", stop = tradeSL)
strategy.exit("Take Profit Short", from_entry = "Short", limit = tradeTP)
strategy.exit("Stop Loss Short", from_entry = "Short", stop = tradeSL)Published by ChaoZhang on the FMZ strategy square · last modified 2023-12-29. Collected in the Quant Trading Vault. Unvalidated research: re-test with your own data and costs before trusting it.
Build this with AgenKit
A spec is not a trading system. Paste this into your coding agent and AgenKit runs a specialist team — architecture, test-first build, risk gates, review — with paper trading on by default.
/agenkit build a production-grade trading bot with a backtest engine, risk controls and paper trading by default from strategies/Anchored-Rolling-CVDVWAP-Signal-Strategy.md- npx agenkit install engineering-kit in your project
- Paste the command into your agent and approve each phase
- Get tests, backtest, risk controls and a paper-trading switch
Understand it first
Before you run this, read the lesson behind the idea and how to backtest it honestly. Specs like this one are the survivors of an unknown number of trials; deflate their results accordingly.
Related specs
- Hull Moving Average and Stochastic RSI Combination Trading StrategyPine Script · Mean reversion · 5m
- TMA LegacyPine Script · Mean reversion · 2h
- Welcome to the BEARMARKET 30 MINPine Script · Mean reversion · 30m
- Multi Dimensional Pivot Point Trading System with Dynamic Fibonacci IndicatorsPine Script · Mean reversion · 1d
- A Trend Reversal Strategy Based on Moving Averages Price Patterns and VolumePine Script · Mean reversion · 1d
- Adaptive Trading Strategy Combining Dynamic Trend Reversal and Stochastic IndicatorPine Script · Mean reversion · 1d