Auto S R Breakout Strategy
The Auto S/R strategy is a trend following strategy. It calculates the highest and lowest prices over certain periods to determine key support and resistance levels. When the price breaks through these key levels…
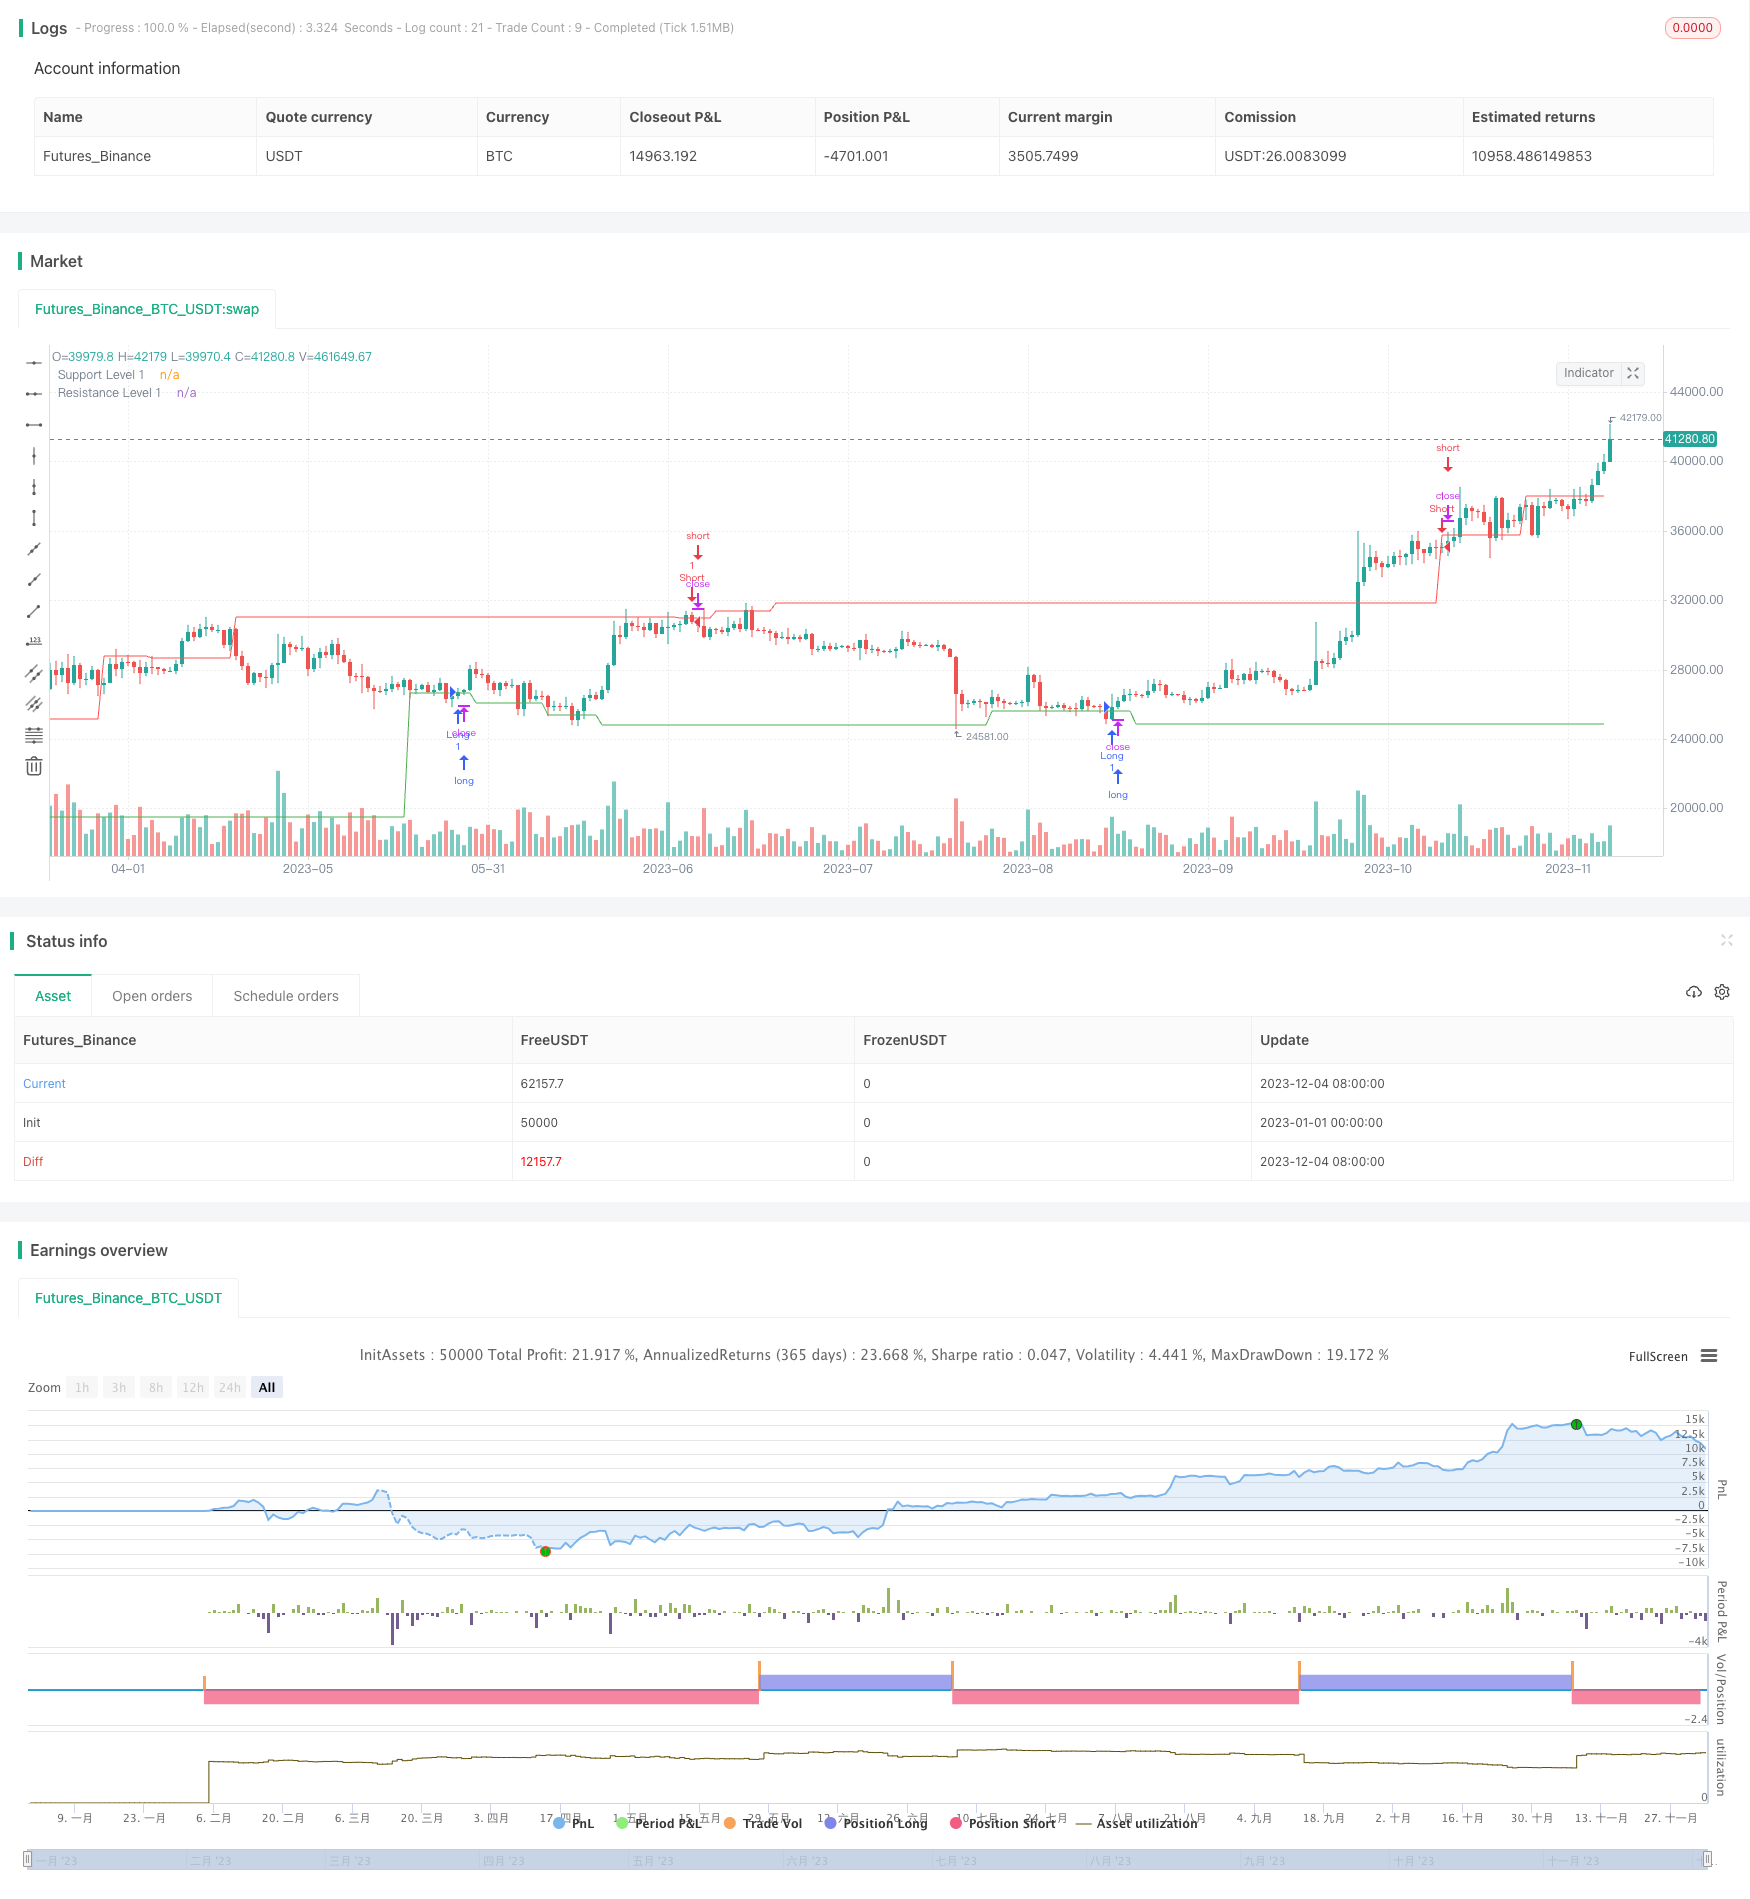
Overview
The Auto S/R strategy is a trend following strategy. It calculates the highest and lowest prices over certain periods to determine key support and resistance levels. When the price breaks through these key levels, buy or sell orders are executed.
Strategy Logic
The strategy first computes the highest high and lowest low prices over a number of bars on left and right sides to identify major support and resistance levels. Then it calculates highest high and lowest low prices over a smaller number of bars to determine near-term support and resistance levels. When the price breaks above the near-term support level, a buy order is triggered. When the price breaks below the near-term resistance level, a sell order is triggered.
The key logic behind the strategy is that if the price breaks supporter or resistance levels formed on both sides over certain periods, it likely signals the start of a new trend. Entering positions in the direction of the breakout allows capturing the emerging trend. The strategy combines different timeframes to confirm the trend, avoiding being misled by short-term price swings.
Advantage Analysis
The biggest advantage of this strategy is it can automatically identify key support and resistance levels, eliminating the need for manual price level identification. By combining different timeframes, it can effectively filter out false breakouts, avoiding being trapped in losing positions.
In addition, the entry and exit rules are simple and straight-forward - just requiring a break of the near-term S/R levels. This makes the strategy easy to implement and optimize by tuning parameters.
Risk Analysis
The biggest risk is that automatically calculated S/R levels may not be reliable, and the price could break through without beginning a trend. This could cause losses.
Also, if the period for near-term S/R is too short, it may generate excessive false signals, leading to high losses in live trading.
To reduce risks, consider adding filter conditions using other indicators like volume and moving averages to confirm trend directionality before entries. Traders could also manually inspect and confirm the reasonableness of automatically calculated S/R levels.
Optimization Directions
There are two main aspects this strategy can be optimized:
Optimize the input parameters to find the optimal period combinations for highest breakout success rate. Different left and right period mixes could be tested.
Add additional filters like volume/momentum indicators and moving averages to avoid false breakouts. Combining with manual inspection of S/R levels could also improve performance.
Summary
Overall this is a solid framework for automatically identifying support and resistance levels. Implementation is straightforward thanks to automated S/R detection, making it suitable for trend following strategies. Further optimizations on parameters and filters can enhance profitability.
Parameters
| Name | Default | What it controls |
|---|---|---|
| v_input_int_1 | 50 | Left Bars |
| v_input_int_2 | 25 | Right Bars |
| v_input_int_3 | 5 | Quick Right Bars |
| v_input_1_close | 0 | Source: close | high | low | open | hl2 | hlc3 | hlcc4 | ohlc4 |
Source Pine Script
/*backtest
start: 2023-01-01 00:00:00
end: 2023-12-05 00:00:00
period: 1d
basePeriod: 1h
exchanges: [{"eid":"Futures_Binance","currency":"BTC_USDT"}]
*/

// This source code is subject to the terms of the Mozilla Public License 2.0 at https://mozilla.org/MPL/2.0/
// © lukaRT

//@version=5
strategy("Auto S/R Strategy", shorttitle="Auto S/R", overlay=true)

// Ваши входные параметры
leftBars = input.int(50, title="Left Bars")
rightBars = input.int(25, title="Right Bars")
quickRightBars = input.int(5, title="Quick Right Bars")
src = input(close, title="Source")

pivotHigh = ta.pivothigh(src, leftBars, rightBars)
pivotLow = ta.pivotlow(src, leftBars, rightBars)

quickPivotHigh = ta.pivothigh(src, leftBars, quickRightBars)
quickPivotLow = ta.pivotlow(src, leftBars, quickRightBars)

// Ваши уровни сопротивления и поддержки
resistanceLevel1 = ta.valuewhen(quickPivotHigh, high[quickRightBars], 0)
supportLevel1 = ta.valuewhen(quickPivotLow, low[quickRightBars], 0)

// Пересечение ценой уровней
longCondition = ta.crossover(close, supportLevel1)
shortCondition = ta.crossunder(close, resistanceLevel1)

strategy.entry("Long", strategy.long, when=longCondition)
strategy.entry("Short", strategy.short, when=shortCondition)

// Отображение линий сопротивления и поддержки на графике
plot(resistanceLevel1, color=color.red, title="Resistance Level 1")
plot(supportLevel1, color=color.green, title="Support Level 1")
Published by ChaoZhang on the FMZ strategy square · last modified 2023-12-06. Collected in the Quant Trading Vault. Unvalidated research: re-test with your own data and costs before trusting it.
Build this with AgenKit
A spec is not a trading system. Paste this into your coding agent and AgenKit runs a specialist team — architecture, test-first build, risk gates, review — with paper trading on by default.
/agenkit build a production-grade trading bot with a backtest engine, risk controls and paper trading by default from strategies/Auto-S-R-Breakout-Strategy.md- npx agenkit install engineering-kit in your project
- Paste the command into your agent and approve each phase
- Get tests, backtest, risk controls and a paper-trading switch
Understand it first
Before you run this, read the lesson behind the idea and how to backtest it honestly. Specs like this one are the survivors of an unknown number of trials; deflate their results accordingly.
Related specs
- Bollinger Bands Breakout Trading StrategyPine Script · Breakout · 1h
- Bollinger Bands Dynamic Breakout StrategyPine Script · Breakout · 1h
- Cross period Value Area Breakout StrategyPine Script · Breakout · 1d
- Donchian Channel Breakout Strategy 442842Pine Script · Breakout · 4h
- Dynamic Support Resistance Breakout Moving Average Crossover StrategyPine Script · Breakout · 1d
- Dynamic Support and Resistance Adaptive Pivot Trading StrategyPine Script · Breakout · 1d