Strategy vault / Mean reversion
Backtesting and Optimization of RSI Strategy
This strategy is based on RSI (Relative Strength Index) indicator to determine overbought and oversold conditions. It takes counter trend positions when RSI reaches overbought or oversold levels to buy low and sell…
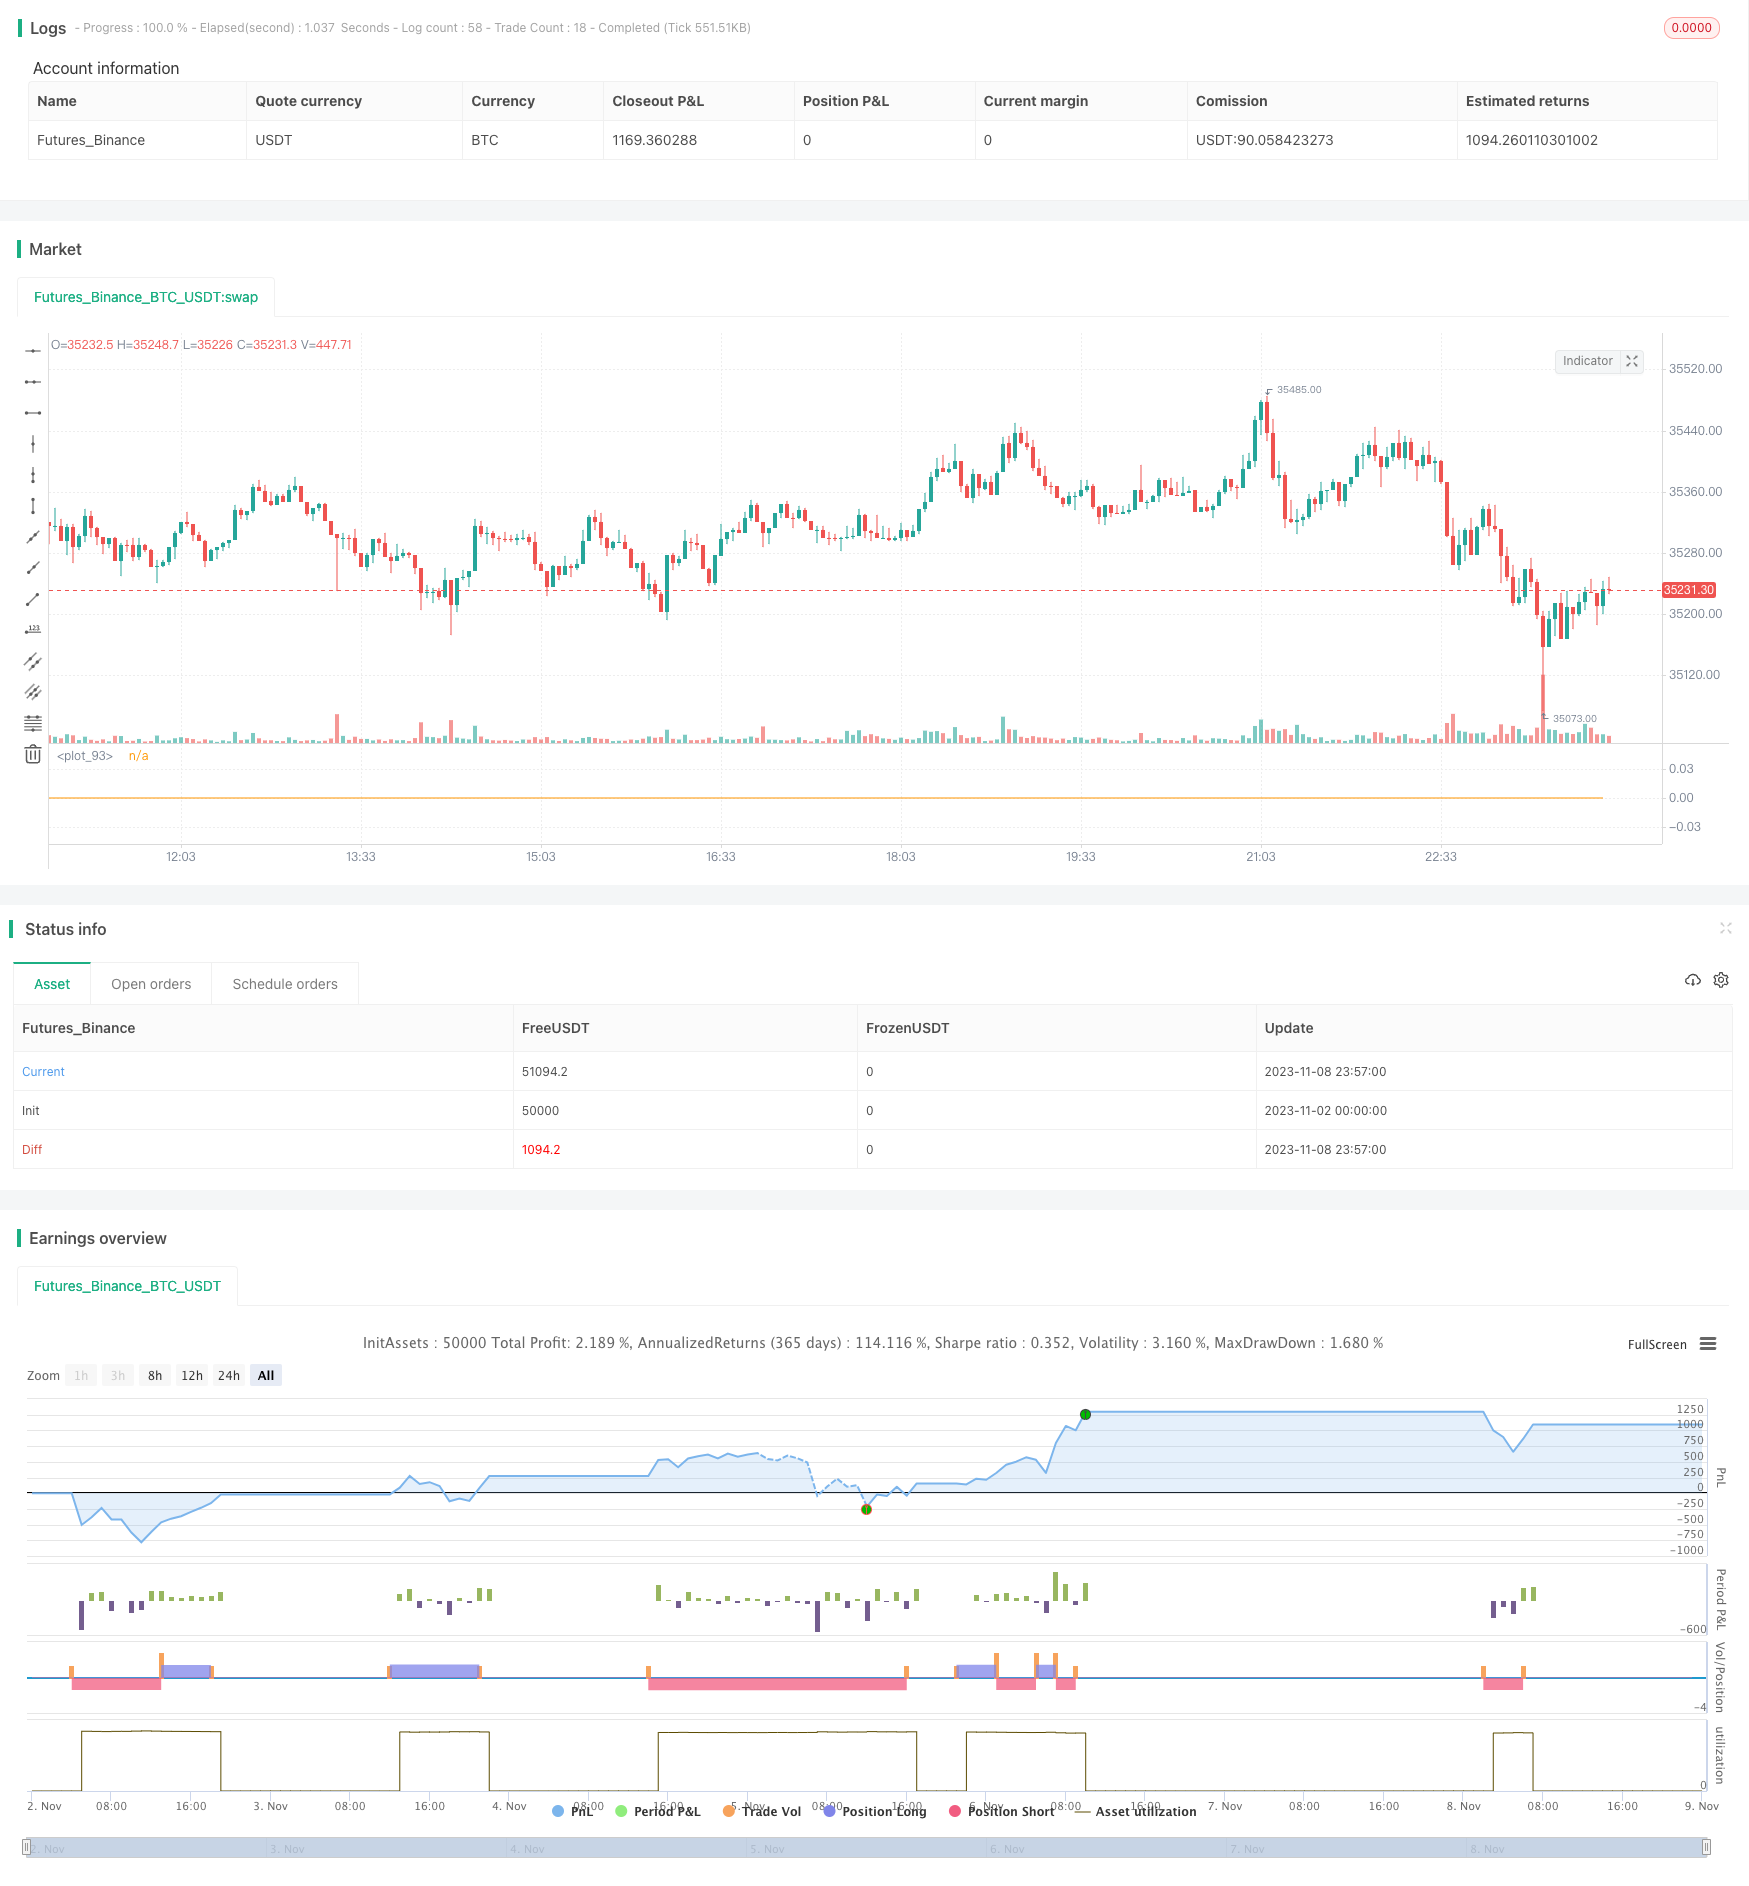
Overview
This strategy is based on RSI (Relative Strength Index) indicator to determine overbought and oversold conditions. It takes counter trend positions when RSI reaches overbought or oversold levels to buy low and sell high. The strategy is simple and effective, profiting from short-term overbought and oversold scenarios in the market.
Strategy Logic
The strategy uses RSI indicator solely as the entry signal. It goes long when RSI crosses below the low point (default 20), and goes short when RSI crosses above the high point (default 80). It trades fixed amount each time (default $100) and aims for 1% profit regardless of market condition. If loss reaches 3%, it stops out. To control trade frequency, strategy stops trading for 24 bars after a losing trade.
The core logic is:
- Use RSI to determine overbought/oversold
- Go long when RSI crosses below 20
- Go short when RSI crosses above 80
- Trade fixed $100 each time
- Take profit or stop loss to close
- If loss, pause trading for 24 bars
As we can see, the strategy is very simple and mechanical. There is barely any space for parameter optimization. It purely exploits the mathematical properties of RSI to take counter trend positions around overbought/oversold regions.
Advantage Analysis
The biggest advantage of this strategy is simplicity and efficiency.
- Uses single indicator RSI, no complex technical analysis needed.
- Fully mechanical system, free from emotional interference.
- Profits from short-term deviation without predicting market direction.
- Risk managed with stop loss/take profit.
It also implements stop loss/take profit ratios to lock in profits and control risks, as well as trade suspension to reduce frequency. This maximizes reward while minimizing risks.
Risk Analysis
Main risks of this strategy come from:
Unable to profit in strong trending market. RSI may stay in overbought/oversold zone for extended period when trend persists.
Stop loss too wide may lead to excessive loss. Current 3% stop loss may need to be reduced to 1-2%.
High trade frequency may lead to over-trading after wins. Need to limit trade frequency.
Fixed $100 size risks concentration. Should optimize to % of capital.
Optimization Directions
Based on the analysis, the strategy can be improved in the following ways:
Add trend filter like MA to pause trading when trend is unclear.
Optimize stop loss/take profit ratios. Reduce stop loss to 1-2% and use dynamic take profit.
Limit trade frequency, such as max 2 trades per time period.
Size trades based on % of capital instead of fixed $100.
Optimize RSI parameters like period, overbought/sold levels.
Add position sizing to not increase size when capital increases.
With these optimizations, the risks can be reduced and stability improved significantly.
Conclusion
In summary, this is a simple and straightforward strategy using RSI to trade overbought/oversold conditions for short-term mean reversion. The pros are simplicity, efficiency, no prediction needed, clear logic, easy to test. The cons are inability to profit in strong trends and potential losses. With additions like trend filter, optimized parameters, position sizing etc., it can be further enhanced for stability and profitability. The logic is innovative and valuable for practical trading if applied properly.
Parameters
| Name | Default | What it controls |
|---|---|---|
| v_input_int_1 | 50000 | Capital per trade(usdt) |
| v_input_int_2 | 14 | rsitimeframe |
| v_input_float_1 | 20 | RSITrigger line |
| v_input_float_2 | 70 | Top RSI stop-loss line |
| v_input_float_3 | 30 | Bottom RSI stop-loss line |
| v_input_float_4 | 0.03 | Stop loss line |
| v_input_float_5 | 0.01 | take profit |
| v_input_int_3 | 24 | No trading on x candlesticks after loss |
Source Pine Script
/*backtest
start: 2023-11-02 00:00:00
end: 2023-11-09 00:00:00
period: 3m
basePeriod: 1m
exchanges: [{"eid":"Futures_Binance","currency":"BTC_USDT"}]
*/

//@version=5
strategy("rsiOverbought and Oversold_For backtesting", overlay=false, initial_capital=50000, currency=currency.USD, default_qty_type=strategy.cash)
open_pos = input.int(50000, title = "Capital per trade(usdt)")
rsi_period = input.int(14, title = "rsitimeframe")
rsi_line      = input.float(20.0,      title='RSITrigger line',      step=0.05)
stop_rsi_top_line = input.float(70, title = "Top RSI stop-loss line")
stop_rsi_bottom_line = input.float(30, title = "Bottom RSI stop-loss line")
stop_loss_perc = input.float(0.03, title = "Stop loss line")
stop_profit = input.float(0.01, title = "take profit")
loss_stop_trade_k = input.int(24, title = "No trading on x candlesticks after loss")


rsiParam = ta.rsi(close, rsi_period)

var int failedTimes = 0
var bool stopTrade = false

// plot(rsiParam)

if stopTrade
    failedTimes += 1
    if failedTimes == loss_stop_trade_k
        failedTimes := 0
        stopTrade := false


// Get current position direction
checkCurrentPosition() =>
    strategy.position_size > 0 ? 1 : strategy.position_size < 0 ? -1 : 0

curPosition = checkCurrentPosition()

// Current Position Cost Price
position_avg_price = strategy.position_avg_price


// Current Position, Reach the reversersiLine, Close Position
if curPosition > 0 and rsiParam >= stop_rsi_top_line
    strategy.close_all(comment = "closebuy")

if curPosition < 0 and rsiParam <= stop_rsi_bottom_line
    strategy.close_all(comment = "closesell")


// Take profit, stop loss, and liquidation
if curPosition > 0
    // if (position_avg_price - close) / close >= stop_loss_perc
    //     // stop loss
    //     strategy.close_all(comment = "closebuy")
    //     stopTrade := true
    if (close - position_avg_price) / position_avg_price >= stop_profit
        // take profit
        strategy.close_all(comment = "closebuy")


if curPosition < 0
    // if (close - position_avg_price) / position_avg_price >= stop_loss_perc
    //     // stop loss
    //     strategy.close_all(comment = "closesell")
    //     stopTrade := true

    if (position_avg_price - close) / close >= stop_profit
        // take profit
        strategy.close_all(comment = "closesell")


a = strategy.closedtrades.exit_bar_index(strategy.closedtrades - 1)

if bar_index == a and strategy.closedtrades.profit(strategy.closedtrades - 1) < 0
    stopTrade := true

var float openPrice = 0.0


if rsiParam <= rsi_line and stopTrade == false
	strategy.entry("long", strategy.long, open_pos / close, comment = "long")
    if curPosition == 0
        openPrice := close
    strategy.exit("long_stop", "long", limit = openPrice * (1+stop_profit), stop=openPrice * (1-stop_loss_perc), comment = "closebuy")

if rsiParam >= 100 - rsi_line and stopTrade == false
    strategy.entry("short", strategy.short, open_pos / close, comment = "short")
    if curPosition == 0
        openPrice := close
    strategy.exit("short_stop", "short", limit = openPrice * (1-stop_profit), stop=openPrice * (1+stop_loss_perc), comment = "closesell")


plot(failedTimes)Published by ChaoZhang on the FMZ strategy square · last modified 2023-11-10. Collected in the Quant Trading Vault. Unvalidated research: re-test with your own data and costs before trusting it.
Build this with AgenKit
A spec is not a trading system. Paste this into your coding agent and AgenKit runs a specialist team — architecture, test-first build, risk gates, review — with paper trading on by default.
/agenkit build a production-grade trading bot with a backtest engine, risk controls and paper trading by default from strategies/Backtesting-and-Optimization-of-RSI-Strategy.md- npx agenkit install engineering-kit in your project
- Paste the command into your agent and approve each phase
- Get tests, backtest, risk controls and a paper-trading switch
Understand it first
Before you run this, read the lesson behind the idea and how to backtest it honestly. Specs like this one are the survivors of an unknown number of trials; deflate their results accordingly.
Related specs
- ATR and EMA based Dynamic Take Profit and Stop Loss Adaptive StrategyPine Script · Mean reversion · 1h
- Adaptive Mean Reversion Trading Strategy Based on Chande Momentum OscillatorPine Script · Mean reversion · 1d
- Adaptive RSI Oscillator Dynamic Trading Strategy with Threshold OptimizationPine Script · Mean reversion · 1d
- Advanced 15 Minute Chart Trading Signal StrategyPine Script · Mean reversion · 3h
- Advanced Fibonacci Retracement Trend Following and Reversal Trading StrategyPine Script · Mean reversion · 3h
- Advanced Momentum EMA Trend Following with RSI Overbought Oversold Trading StrategyPine Script · Mean reversion · 1d