Strategy vault / Mean reversion
Bandpass Mean PB Indicator Strategy
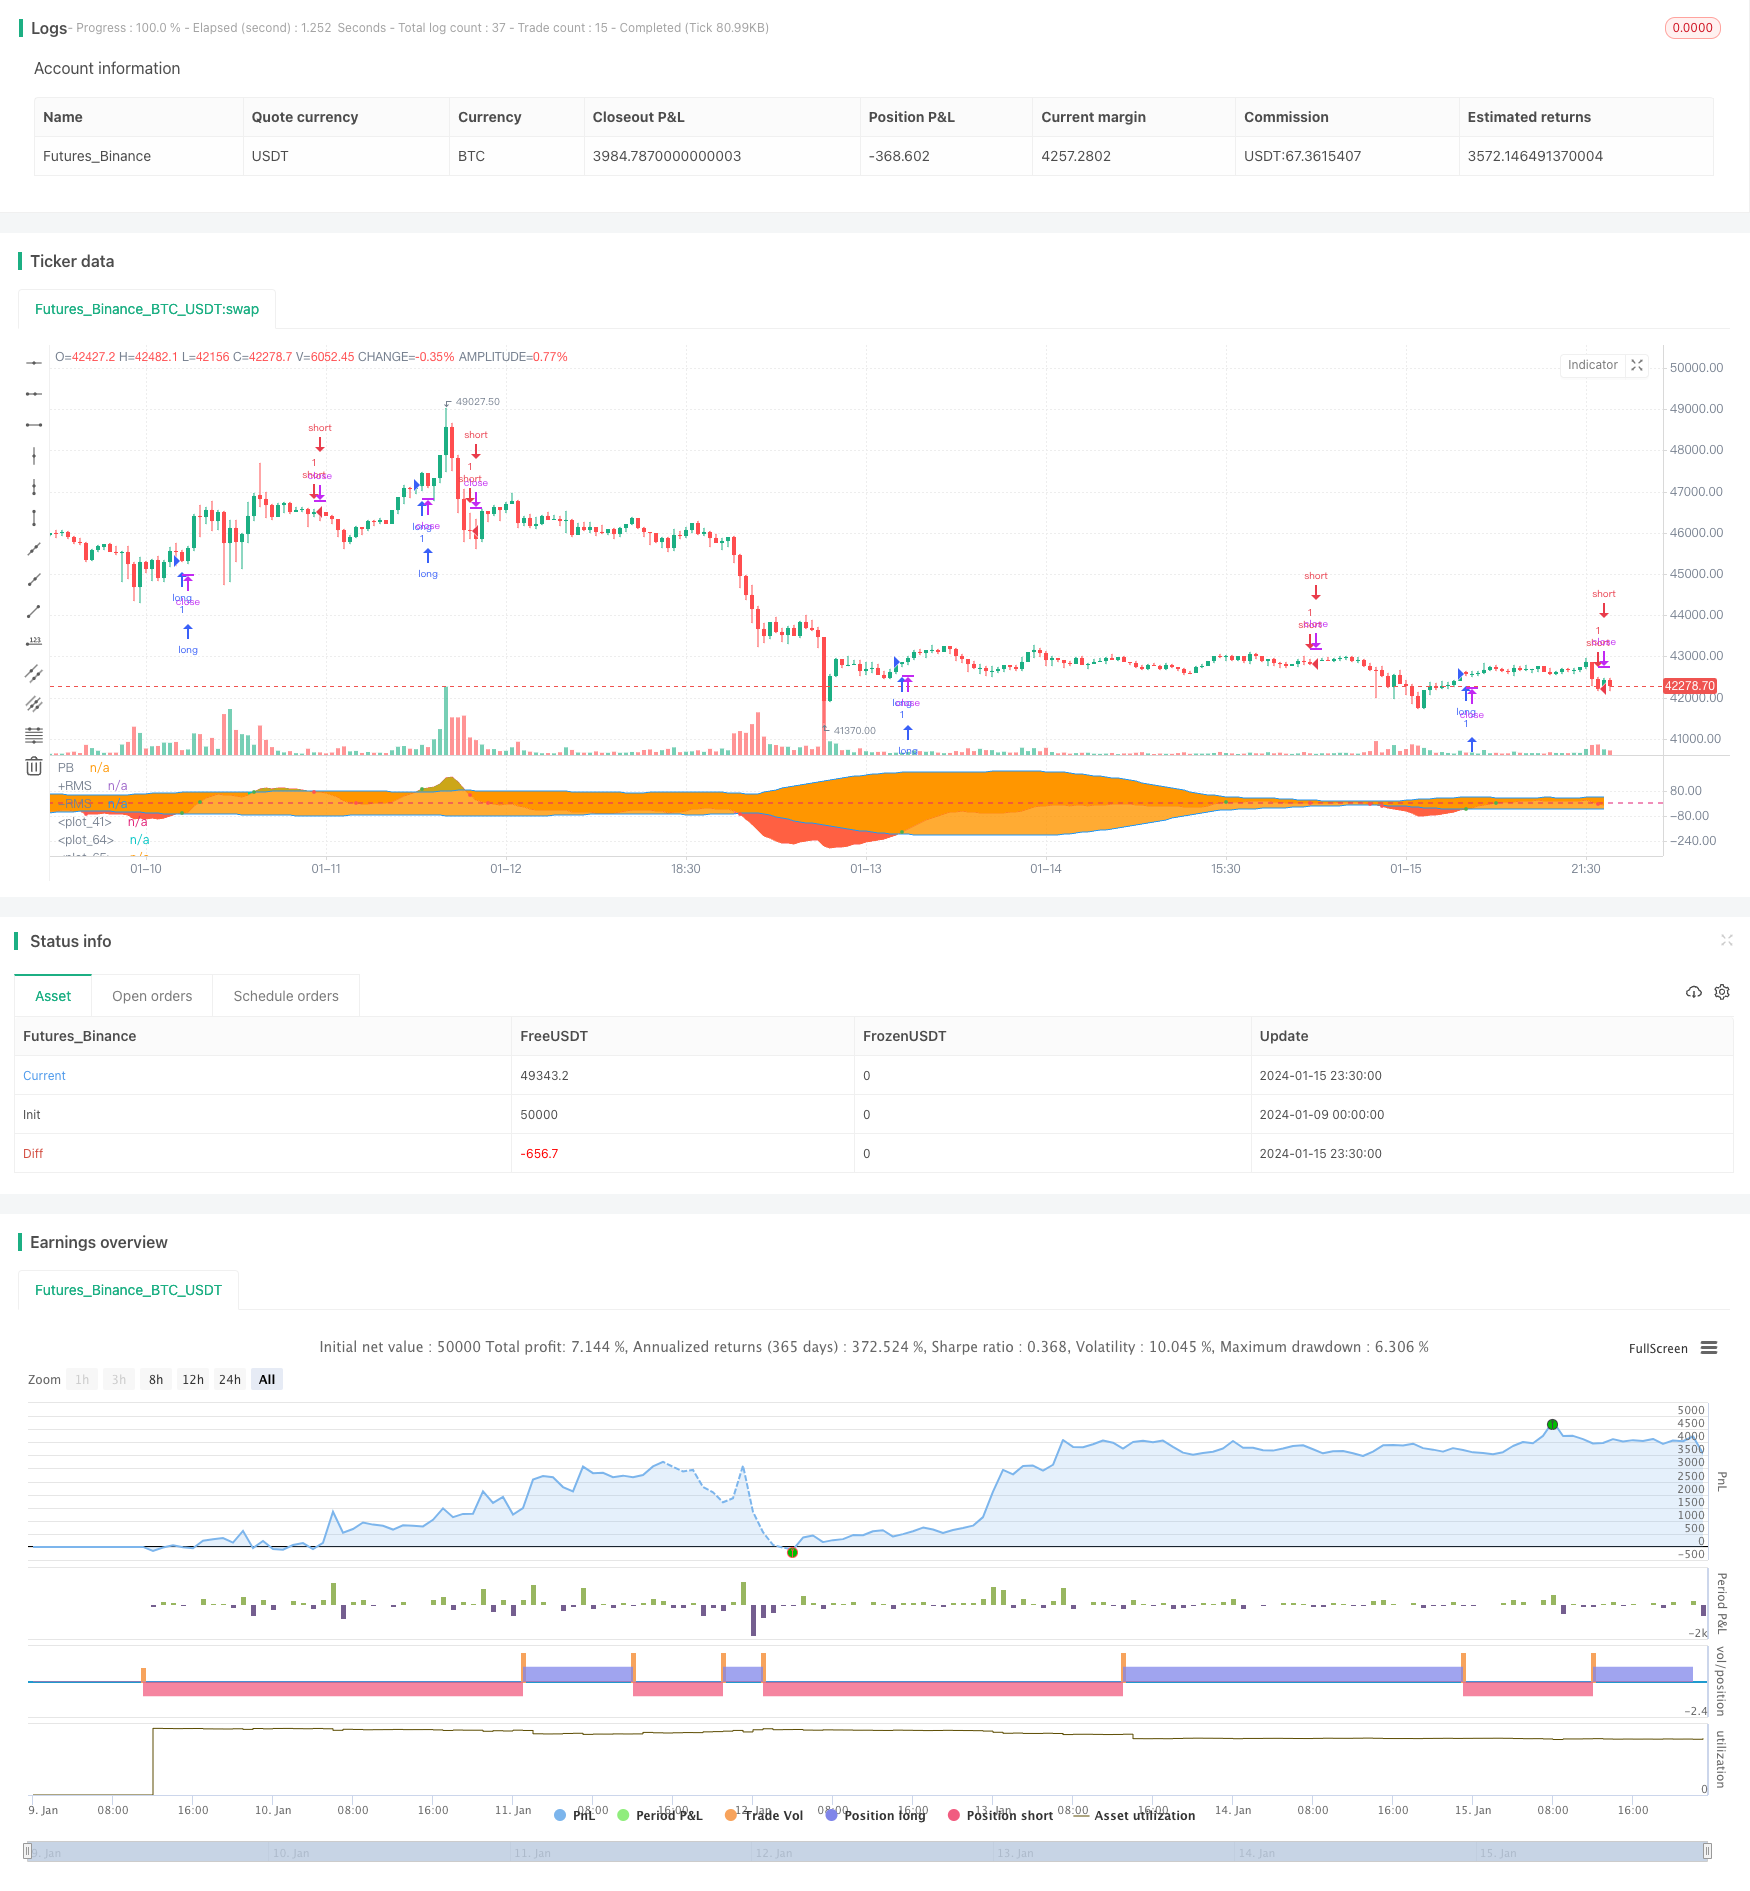
This strategy calculates the mean PB indicator and Bollinger bands to determine the golden cross and dead cross relationship between the PB indicator and the upper and lower rails of the Bollinger bands. It generates…
Overview
This strategy calculates the mean PB indicator and Bollinger bands to determine the golden cross and dead cross relationship between the PB indicator and the upper and lower rails of the Bollinger bands. It generates buy signals when the PB indicator breaks above the middle rail or lower rail of the Bollinger bands, and generates sell signals when the PB indicator breaks below the middle rail or upper rail of the Bollinger bands.
Strategy Principle
The core indicator of the strategy is the mean PB indicator. The mean PB indicator combines the stability of the moving average system and the sensitivity of the PB indicator. It uses the difference between fast and slow moving averages of different cycles to express price change trends to determine the long and short trends.
The strategy also uses the Bollinger Band indicator to identify overbought and oversold conditions of the stock price. The Bollinger Band indicator consists of three curves: middle rail, upper rail and lower rail. The middle rail is the n-day moving average; the upper and lower rails are calculated based on the middle rail and historical volatility. When the stock price is close to the upper rail, it is in the overbought zone; when it is close to the lower rail, it is in the oversold zone, and the area around the middle rail is a reasonable price range for the stock.
In summary, this strategy cleverly uses the mean PB indicator to determine the uptrend or downtrend of stock prices, and the Bollinger bands as an auxiliary indicator to determine overbought and oversold conditions, to find trading signals from the relationship between the two indicators. It belongs to a typical technical indicator trading strategy.
Advantage Analysis
The main advantages of this strategy are:
- Use the mean PB indicator to determine changes in price trends, high sensitivity
- Assist with Bollinger Bands to identify overbought and oversold zones to improve accuracy of determining entry and exit points
- Simple strategy logic, easy to implement
- Backtest data shows relatively satisfactory returns
Risk Analysis
The main risks of this strategy are:
- Both the mean PB indicator and Bollinger Bands rely on historical data for calculation. They may generate incorrect signals when stock prices fluctuate sharply.
- The PB indicator and Bollinger Bands are quite sensitive to parameter settings. Inappropriate settings may lead to excessive incorrect trades.
- Macro environment changes during the strategy implementation period, such as economic crisis, policy changes, etc., may cause the failure of the strategy.
To address the above risks, methods like optimizing parameter settings, strict stop loss, considering macro factors, manual monitoring can be used for risk mitigation.
Optimization Directions
The optimization directions for this strategy include:
- Optimize parameters of the mean PB indicator and Bollinger Bands to find the best parameter combination
- Add other indicators for filtration, such as MACD, KDJ, etc. to improve strategy performance
- Add stop loss mechanisms to effectively control single loss
- Incorporate larger time frame indicators to determine the major trend to avoid trading against the trend
Conclusion
The overall performance of this strategy is quite satisfactory. With the mean PB indicator as its core and Bollinger Bands to assist determining trading signals, it has simple logic, high sensitivity, and decent backtest results. By continuing to optimize parameter settings, adding other assisting indicators, implementing strict stop loss etc., the profitability and stability of the strategy can be further improved. It is worth verifying in live trading and application.
Parameters
| Name | Default | What it controls |
|---|---|---|
| v_input_1_close | 0 | Source: close | high | low | open | hl2 | hlc3 | hlcc4 | ohlc4 |
| v_input_2 | 41 | Fast Period |
| v_input_3 | 54 | Slow Period |
| v_input_4 | false | Show crosses on background? |
| v_input_5 | true | Use additional triggers? |
| v_input_6 | 2018 | Backtest Start Year |
| v_input_7 | true | Backtest Start Month |
| v_input_8 | true | Backtest Start Day |
| v_input_9 | 2019 | Backtest Stop Year |
| v_input_10 | 12 | Backtest Stop Month |
| v_input_11 | 31 | Backtest Stop Day |
Source Pine Script
/*backtest
start: 2024-01-09 00:00:00
end: 2024-01-16 00:00:00
period: 30m
basePeriod: 15m
exchanges: [{"eid":"Futures_Binance","currency":"BTC_USDT"}]
*/

//@version=4
strategy("BandPass EOS", overlay=false, initial_capital = 1000)

src = input(close, "Source", input.source)
Period1 = input(41, "Fast Period", input.integer)
Period2 = input(54, "Slow Period", input.integer)
showBG = input(false, "Show crosses on background?", input.bool)
UseReversalStop = input(true, "Use additional triggers?", input.bool)

//Super Passband Filter
a1 = 0.0
a2 = 0.0
PB = 0.0
RMS = 0.0
if bar_index > Period1
    a1 := 5 / Period1
    a2 := 5 / Period2
    PB := (a1 - a2) * src + (a2 * (1 - a1) - a1 * (1 - a2)) * src[1] +
       (1 - a1 + 1 - a2) * nz(PB[1]) - (1 - a1) * (1 - a2) * nz(PB[2])
    for i = 0 to 49 by 1
        RMS := RMS + PB[i] * PB[i]
        RMS
    RMS := sqrt(RMS / 40)
    RMS
z = 0

buy = PB > PB [5] and crossover(PB, -RMS) or PB > PB [5] and crossover (PB, RMS) or PB > PB [5] and crossover (PB, z)
sell = PB < PB [5] and crossunder(PB, RMS) or PB < PB [5] and crossunder (PB, -RMS) or PB < PB [5] and crossunder (PB, z)
signal = buy ? 1 : sell ? -1 : 0
bg = buy ? color.green : sell ? color.red : color.white
bg := showBG ? bg : na
upperFill = PB>RMS ? color.lime : na
lowerFill = PB<-RMS ? color.red : na

p1 = plot(PB,"PB",color.red)
p2 = plot(RMS,"+RMS",color.blue)
p3 = plot(-RMS,"-RMS",color.blue)
bgcolor(bg)
fill(p1,p2,upperFill)
fill(p1,p3,lowerFill)
hline(0)


//PERIOD
testStartYear = input(2018, "Backtest Start Year")
testStartMonth = input(1, "Backtest Start Month")
testStartDay = input(1, "Backtest Start Day")
testPeriodStart = timestamp(testStartYear,testStartMonth,testStartDay, 0, 0)

testStopYear = input(2019, "Backtest Stop Year")
testStopMonth = input(12, "Backtest Stop Month")
testStopDay = input(31, "Backtest Stop Day")
testPeriodStop = timestamp(testStopYear,testStopMonth,testStopDay, 0, 0)

testPeriod() => true

lcolor = PB > PB [5] and crossover(PB, -RMS) or PB > PB [5] and crossover (PB, RMS) or PB > PB [5] and crossover (PB, z)
scolor = PB < PB [5] and crossunder(PB, RMS) or PB < PB [5] and crossunder (PB, -RMS) or PB < PB [5] and crossunder (PB, z)

c1 = (PB < PB [5] and crossunder(PB, RMS) or PB < PB [5] and crossunder (PB, -RMS) or PB < PB [5] and crossunder (PB, z))
c2 = (PB > PB [5] and crossover(PB, -RMS) or PB > PB [5] and crossover (PB, RMS) or PB > PB [5] and crossover (PB, z))

plot (c1 ? PB : na, style = plot.style_circles, color = color.red, linewidth = 3)
plot (c2 ? PB : na, style = plot.style_circles, color = color.green, linewidth = 3)

if (PB > PB [5] and crossover(PB, -RMS) or PB > PB [5] and crossover (PB, RMS) or PB > PB [5] and crossover (PB, z))
    strategy.entry("long", strategy.long, when = testPeriod())


if (PB < PB [5] and crossunder(PB, RMS) or PB < PB [5] and crossunder (PB, -RMS) or PB < PB [5] and crossunder (PB, z))
    strategy.entry("short", strategy.short, when = testPeriod())
Published by ChaoZhang on the FMZ strategy square · last modified 2024-01-17. Collected in the Quant Trading Vault. Unvalidated research: re-test with your own data and costs before trusting it.
Build this with AgenKit
A spec is not a trading system. Paste this into your coding agent and AgenKit runs a specialist team — architecture, test-first build, risk gates, review — with paper trading on by default.
/agenkit build a production-grade trading bot with a backtest engine, risk controls and paper trading by default from strategies/Bandpass-Mean-PB-Indicator-Strategy.md- npx agenkit install engineering-kit in your project
- Paste the command into your agent and approve each phase
- Get tests, backtest, risk controls and a paper-trading switch
Understand it first
Before you run this, read the lesson behind the idea and how to backtest it honestly. Specs like this one are the survivors of an unknown number of trials; deflate their results accordingly.
Related specs
- Advanced 15 Minute Chart Trading Signal StrategyPine Script · Mean reversion · 3h
- Advanced Quantitative Trading Strategy Combining RSI Divergence and Moving AveragesPine Script · Mean reversion · 1h
- Bollinger Bands ATR Risk Reward Trading StrategyPine Script · Mean reversion · 1d
- Bollinger Bands Long Only StrategyPine Script · Mean reversion · 1d
- Bollinger Bands Momentum Reversal Quantitative StrategyPine Script · Mean reversion · 45m
- Bollinger Bands Stochastic RSI Extreme Strategy BBSR Extreme StrategyPine Script · Mean reversion · 1h