Strategy vault / Mean reversion
BB Dual Long and Short Trading Strategy
The BB dual long and short trading strategy is a strategy that utilizes Bollinger Bands for two-way trading. It combines the middle band, upper band and lower band of the Bollinger Bands to implement opening and…
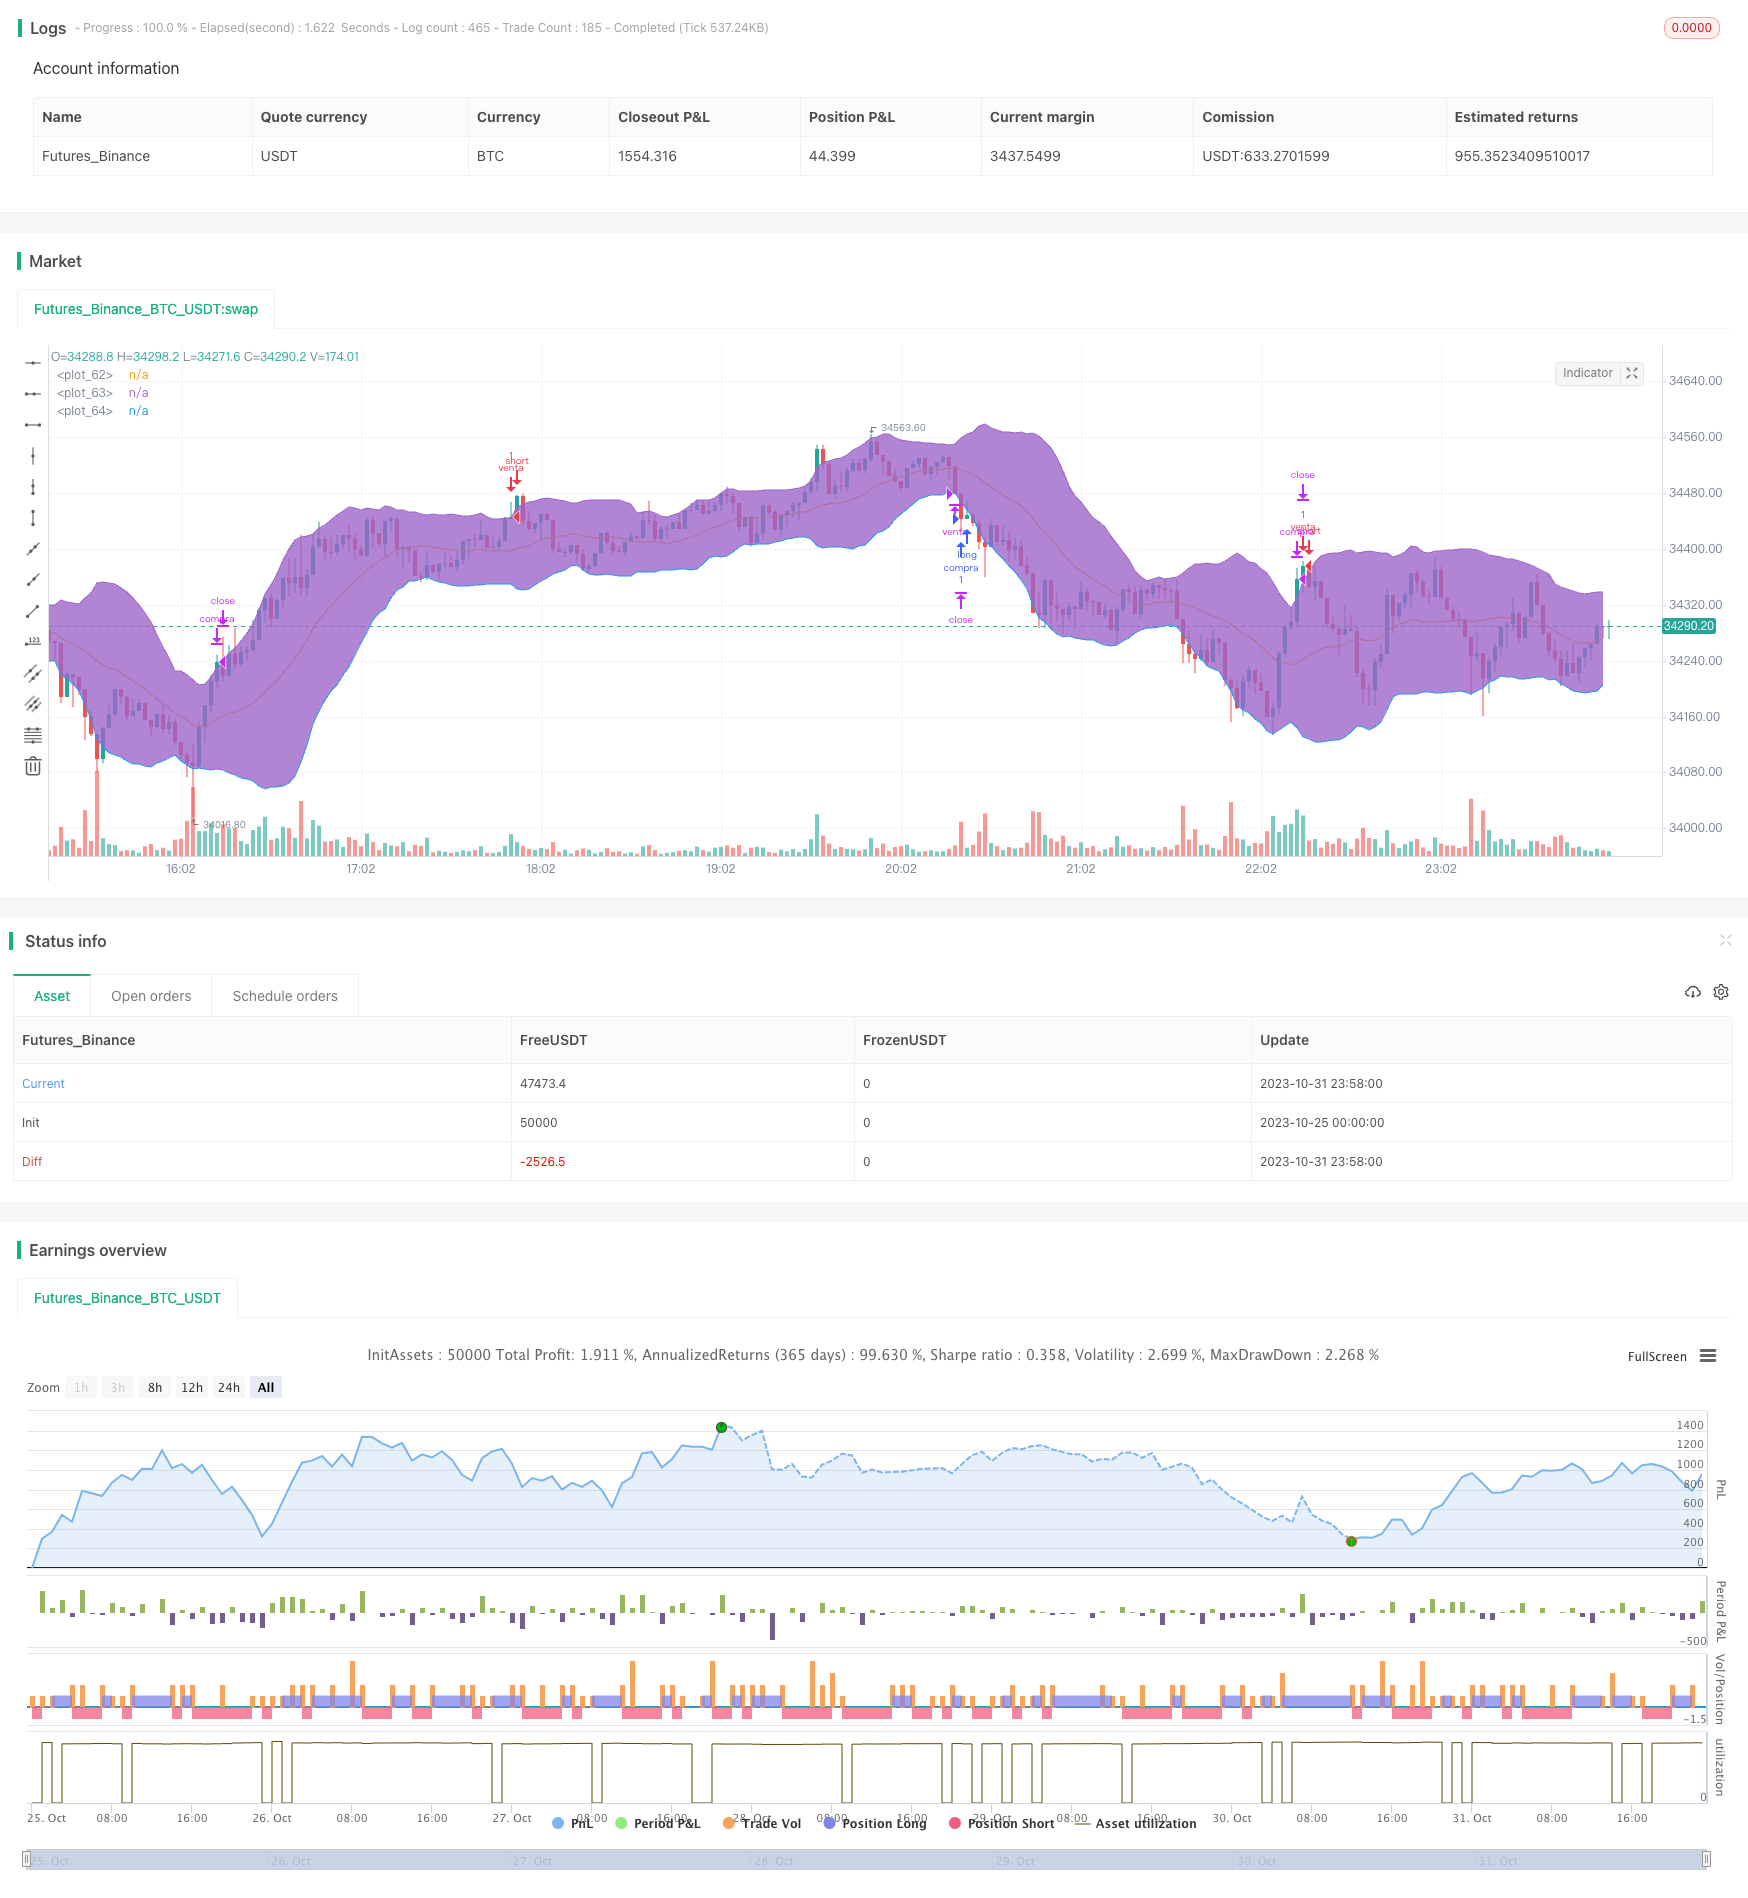
Overview
The BB dual long and short trading strategy is a strategy that utilizes Bollinger Bands for two-way trading. It combines the middle band, upper band and lower band of the Bollinger Bands to implement opening and closing long and short positions. It opens short positions when the price touches the upper band, and opens long positions when it touches the lower band, with stop loss and take profit prices set. The strategy is simple to operate and captures the main trends of the market.
Principle Analysis
This strategy is mainly based on the principle of Bollinger Bands. Bollinger Bands consist of a middle band, an upper band and a lower band, representing the moving trend of prices. The middle band is the n-day moving average, the upper band is the middle band + k standard deviations, and the lower band is the middle band - k standard deviations. When the price breaks through the upper band, it indicates the market is in an overbought state, and opening short positions should be considered; when the price breaks through the lower band, it indicates the market is in an oversold state, and opening long positions should be considered.
Specifically, the strategy first calculates the Bollinger middle, upper and lower bands. It then judges if the price touches the upper band. If yes, it opens short positions. It also judges if the price touches the lower band. If yes, it opens long positions. After opening positions, it also sets stop loss and take profit prices. For example, after opening long positions, the stop loss price would be the opening price minus a certain percentage, and the take profit price would be the opening price plus a certain percentage. Finally, the strategy also defines the closing conditions, including stop loss, take profit being hit, and the price re-entering the Bollinger Bands.
The strategy fully utilizes the ability of Bollinger Bands to reflect overbought and oversold market conditions, and implements relatively accurate long and short trading. When the market is in different stages, the trend of current market conditions can also be judged through Bollinger Bands indicators, and corresponding trading strategies can be adopted.
Advantage Analysis
The strategy has the following advantages:
Catching trends. Bollinger Bands can identify the main trend direction and open positions in time to capture trends.
Two-way trading. It allows simultaneous long and short trading, without being limited to one direction.
Risk control. Stop loss and take profit setup ensures each trade has loss mitigation measures.
Simple and clear. Based on the Bollinger Bands indicator, the strategy rules are direct and easy to understand.
Easy to optimize. Parameters like cycle length and standard deviation multiplier can be adjusted to optimize the strategy.
Applicable to different markets. Can be applied to stocks, forex, cryptocurrencies etc.
Risk Analysis
The strategy also has some risks:
Bollinger Bands failure risk. Bollinger Bands may fail during violent market fluctuations.
Stop loss being hit risk. Stop loss may be hit during drastic trend changes.
Over-optimization risk. Excessive optimization may lead to overfitting.
High trading frequency risk. Frequent Bollinger Bands fluctuations may lead to over-trading.
Band touch exit risk. Exiting solely based on band touch may be premature.
The solutions are:
Combine with trend indicators, close strategy in time when bands fail.
Adopt trailing stop loss.
Backtest across markets and timeframes to prevent overfitting.
Relax the fluctuation range to reduce trade frequency.
Add exit indicators like MACD divergence to confirm bands signal.
Optimization Directions
The strategy can be optimized in the following aspects:
Adjust Bollinger parameters like cycle length to match different cycle trends, and standard deviation multiplier to suit market volatility.
Add trend filter, combine indicators like moving average to determine trend, avoid false signals when no clear trend.
Optimize stop loss strategy, like trailing stop loss to track price closer, or set stop loss based on ATR.
Add entry filters like closing price breaking bands to avoid mid-band false breakouts.
Use machine learning to auto optimize parameters.
Add exit indicators like MACD divergence to supplement band signals.
Summary
Overall, the BB dual long and short trading strategy is a very typical and practical Bollinger Bands strategy. It uses the Bollinger Bands to judge overbought and oversold conditions to capture trends, implements two-way trading, and sets stop loss and take profit for risk control. The strategy has the advantages of catching trends, two-way trading, and risk control, and also has problems like Bollinger Bands failure. We can improve the strategy by adjusting Bollinger parameters, adding trend filters, optimizing stop loss etc. The strategy has great practicality and potential, and is a simple useful trading strategy worth recommending.
Parameters
| Name | Default | What it controls |
|---|---|---|
| v_input_1 | 20 | Longitud |
| v_input_float_1 | 2 | Desvio estandar |
| v_input_2_close | 0 | Fuente: close | high | low | open | hl2 | hlc3 | hlcc4 | ohlc4 |
| v_input_float_2 | 5 | Take Profit |
| v_input_float_3 | true | Stop Loss |
Source Pine Script
/*backtest
start: 2023-10-25 00:00:00
end: 2023-11-01 00:00:00
period: 2m
basePeriod: 1m
exchanges: [{"eid":"Futures_Binance","currency":"BTC_USDT"}]
*/

// This source code is subject to the terms of the Mozilla Public License 2.0 at https://mozilla.org/MPL/2.0/
// © samuelkanneman

//@version=5
strategy('MI_BB ', overlay=true)
// i_startTime = input.time(title='Start Date Filter', defval=timestamp('01 Nov 2020 13:30 +0000'), tooltip='Date & time to begin trading from')
// i_endTime = input.time(title='End Date Filter', defval=timestamp('1 Nov 2022 19:30 +0000'), tooltip='Date & time to stop trading')

dateFilter = true

longitud = input(20, title='Longitud')
Desv = input.float(2.0, title='Desvio estandar', step=0.1)
fuente = input(close, title='Fuente')

TakeP = input.float(5.0, title='Take Profit', step=0.1)
StopL = input.float(1.0, title='Stop Loss', step=0.1)
var SL = 0.0
var TP = 0.0

[banda_central, banda_sup, banda_inf] = ta.bb(fuente, longitud, Desv)

comprado = strategy.position_size > 0
vendido = strategy.position_size < 0


if not vendido and not comprado and dateFilter
// Short
    if close >= banda_sup
    //cantidad= (strategy.equity/close)
        strategy.entry('venta', strategy.short)
        SL := close * (1 + StopL / 100)
        TP := close*(1-TakeP/100)

//Long
    else if close <= banda_inf
    //cantidad= (strategy.equity/close)
        strategy.entry('compra', strategy.long)
        SL := close * (1 - StopL / 100)
        TP := close*(1+TakeP/100)

//cierrres short
if close <= TP and vendido
    strategy.close ("venta" , comment="Salto TP")
if close <= banda_inf and vendido
    strategy.close ("venta" , comment="Banda Inferior")
if close >= SL and vendido
    strategy.close ("venta" , comment="Salto SL")


//cierre long
if close >= TP and comprado
    strategy.close ("compra" , comment="Salto TP")
if close >= banda_sup and comprado
    strategy.close ("compra" , comment="Banda Superior")

if close <= SL and comprado
    strategy.close ("compra" , comment="Salto SL")


p1 = plot(banda_central)
p2 = plot(banda_sup)
p3 = plot(banda_inf)
fill(p2, p3, transp=90)
Published by ChaoZhang on the FMZ strategy square · last modified 2023-11-02. Collected in the Quant Trading Vault. Unvalidated research: re-test with your own data and costs before trusting it.
Build this with AgenKit
A spec is not a trading system. Paste this into your coding agent and AgenKit runs a specialist team — architecture, test-first build, risk gates, review — with paper trading on by default.
/agenkit build a production-grade trading bot with a backtest engine, risk controls and paper trading by default from strategies/BB-Dual-Long-and-Short-Trading-Strategy.md- npx agenkit install engineering-kit in your project
- Paste the command into your agent and approve each phase
- Get tests, backtest, risk controls and a paper-trading switch
Understand it first
Before you run this, read the lesson behind the idea and how to backtest it honestly. Specs like this one are the survivors of an unknown number of trials; deflate their results accordingly.
Related specs
- Advanced 15 Minute Chart Trading Signal StrategyPine Script · Mean reversion · 3h
- Advanced Quantitative Trading Strategy Combining RSI Divergence and Moving AveragesPine Script · Mean reversion · 1h
- Bollinger Bands ATR Risk Reward Trading StrategyPine Script · Mean reversion · 1d
- Bollinger Bands Long Only StrategyPine Script · Mean reversion · 1d
- Bollinger Bands Momentum Reversal Quantitative StrategyPine Script · Mean reversion · 45m
- Bollinger Bands Stochastic RSI Extreme Strategy BBSR Extreme StrategyPine Script · Mean reversion · 1h