Strategy vault / Mean reversion
Bear Power Tracking Strategy
The Bear Power Tracking Strategy is designed based on Dr. Alexander Elder's Elder Ray indicator to measure buying and selling pressure in the market. It uses a 13-day exponential moving average (EMA) to indicate the…
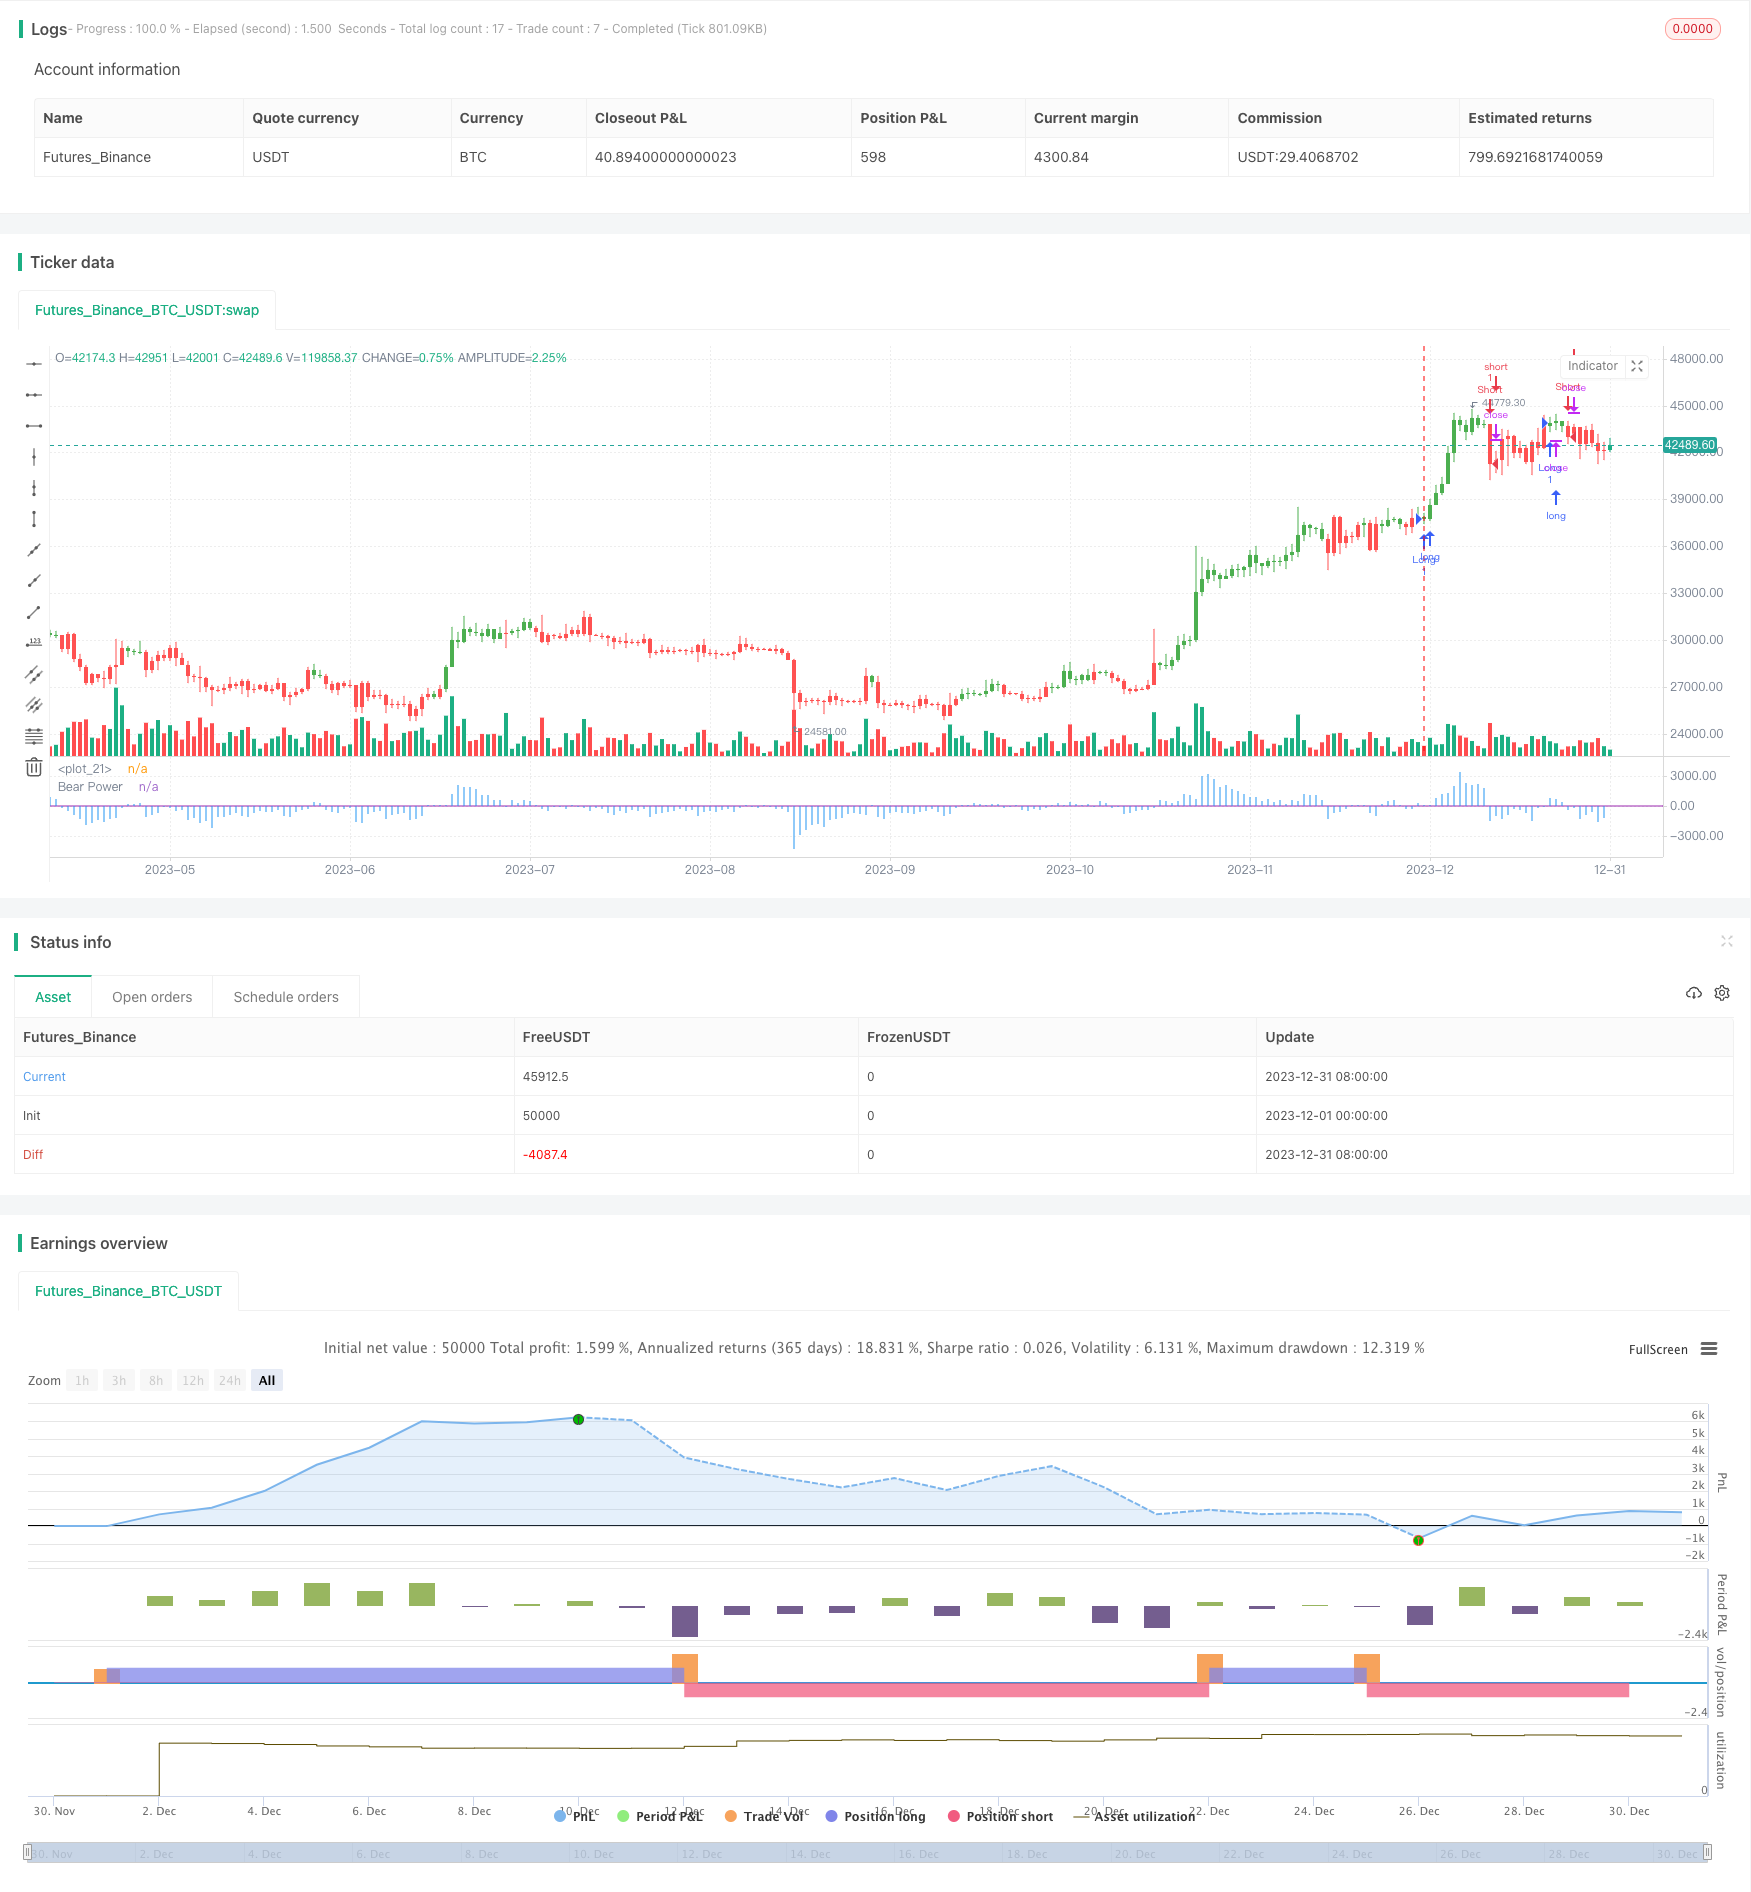
Overview
The Bear Power Tracking Strategy is designed based on Dr. Alexander Elder's Elder Ray indicator to measure buying and selling pressure in the market. It uses a 13-day exponential moving average (EMA) to indicate the market consensus of value and uses the Bear Power indicator to measure the ability of sellers to push prices below the consensus value.
Strategy Logic
The core indicator of this strategy is Bear Power, which is calculated by subtracting the 13-day EMA from the daily low price. It reflects the ability of sellers to push prices below the average consensus of value.
When Bear Power crosses above the specified threshold, a long position is opened. When it crosses below, a short position is opened.
In addition, the long/short direction can also be switched via the "Reverse Trade" boolean parameter, which reverses the signal when set to True.
The strategy is simple and easy to implement with one indicator judging direction.
Advantage Analysis
The advantages of this strategy include:
- Simple to understand and implement with a single indicator
- Flexible parameter adjustment for different market environments
- Reversal trade enrichs strategy types
Risk Analysis
There are also some risks:
- False signals may be generated with a single indicator
- No stop loss may lead to huge losses
- Improper parameters may cause over-trading
Confirmation with multiple indicators, stop loss and parameter tuning could help optimize it.
Optimization Directions
Some directions to optimize the strategy:
- Add other indicators like MACD, KDJ to filter signals
- Add moving stop loss to limit losses
- Optimize indicator parameters for entry and exit points
- Fundamental analysis stock selection
- Combine with other strategies
Summary
The Bear Power Tracking Strategy has a simple concept of judging entry and exit by comparing one indicator to a threshold. As a indicator-based strategy, there is still large room for optimization in aspects like indicators, stop loss and stock selection to make it more steady and reliable.
Parameters
| Name | Default | What it controls |
|---|---|---|
| v_input_1 | 13 | Length |
| v_input_2 | false | Trigger |
| v_input_3 | false | Trade reverse |
Source Pine Script
/*backtest
start: 2023-12-01 00:00:00
end: 2023-12-31 23:59:59
period: 1d
basePeriod: 1h
exchanges: [{"eid":"Futures_Binance","currency":"BTC_USDT"}]
*/

//@version = 2
////////////////////////////////////////////////////////////
//  Copyright by HPotter v1.0 07/12/2016
// Developed by Dr Alexander Elder, the Elder-ray indicator measures buying
// and selling pressure in the market. The Elder-ray is often used as part
// of the Triple Screen trading system but may also be used on its own.
// Dr Elder uses a 13-day exponential moving average (EMA) to indicate the
// market consensus of value. Bear Power measures the ability of sellers to
// drive prices below the consensus of value. Bear Power reflects the ability
// of sellers to drive prices below the average consensus of value.
// Bull Power is calculated by subtracting the 13-day EMA from the day's High.
// Bear power subtracts the 13-day EMA from the day's Low.
// You can use in the xPrice any series: Open, High, Low, Close, HL2, HLC3, OHLC4 and ect...
// You can change long to short in the Input Settings
// Please, use it only for learning or paper trading. Do not for real trading.
////////////////////////////////////////////////////////////
strategy(title="Elder Ray (Bear Power) Strategy Backtest")
Length = input(13, minval=1)
Trigger = input(0)
reverse = input(false, title="Trade reverse")
hline(0, color=purple, linestyle=line)
xPrice = close
xMA = ema(xPrice,Length)
DayLow = iff(dayofmonth != dayofmonth[1], low, min(low, nz(DayLow[1])))
nRes = DayLow - xMA
pos = iff(nRes > Trigger, 1,
	   iff(nRes < Trigger, -1, nz(pos[1], 0)))
possig = iff(reverse and pos == 1, -1,
         iff(reverse and pos == -1, 1, pos))
if (possig == 1)
    strategy.entry("Long", strategy.long)
if (possig == -1)
    strategy.entry("Short", strategy.short)
barcolor(possig == -1 ? red: possig == 1 ? green : blue )
plot(nRes, color=blue, title="Bear Power", style = histogram)
Published by ChaoZhang on the FMZ strategy square · last modified 2024-01-12. Collected in the Quant Trading Vault. Unvalidated research: re-test with your own data and costs before trusting it.
Build this with AgenKit
A spec is not a trading system. Paste this into your coding agent and AgenKit runs a specialist team — architecture, test-first build, risk gates, review — with paper trading on by default.
/agenkit build a production-grade trading bot with a backtest engine, risk controls and paper trading by default from strategies/Bear-Power-Tracking-Strategy.md- npx agenkit install engineering-kit in your project
- Paste the command into your agent and approve each phase
- Get tests, backtest, risk controls and a paper-trading switch
Understand it first
Before you run this, read the lesson behind the idea and how to backtest it honestly. Specs like this one are the survivors of an unknown number of trials; deflate their results accordingly.
Related specs
- 1 2 3 Pattern Quantitative Trading Strategy with EMAs MACD and 4th Candle ExtensionPine Script · Mean reversion · 1h
- ATR and EMA based Dynamic Take Profit and Stop Loss Adaptive StrategyPine Script · Mean reversion · 1h
- Advanced 15 Minute Chart Trading Signal StrategyPine Script · Mean reversion · 3h
- BONK Multi Factor Trading StrategyPine Script · Mean reversion · 1d
- Chaikin Oscillator StrategyPine Script · Mean reversion · 3h
- Customizable Non Repainting HTF MACD MFI Scalable Bot StrategyPine Script · Mean reversion · 1d