Strategy vault / DCA & fixed investment
Bollinger Band and RSI Mixing with DCA Strategy
The strategy is named "Bollinger Band and RSI Mixing with DCA". It builds trading signals based on the Bollinger Band and Relative Strength Index (RSI) indicators and manages risks using progressive dollar cost…
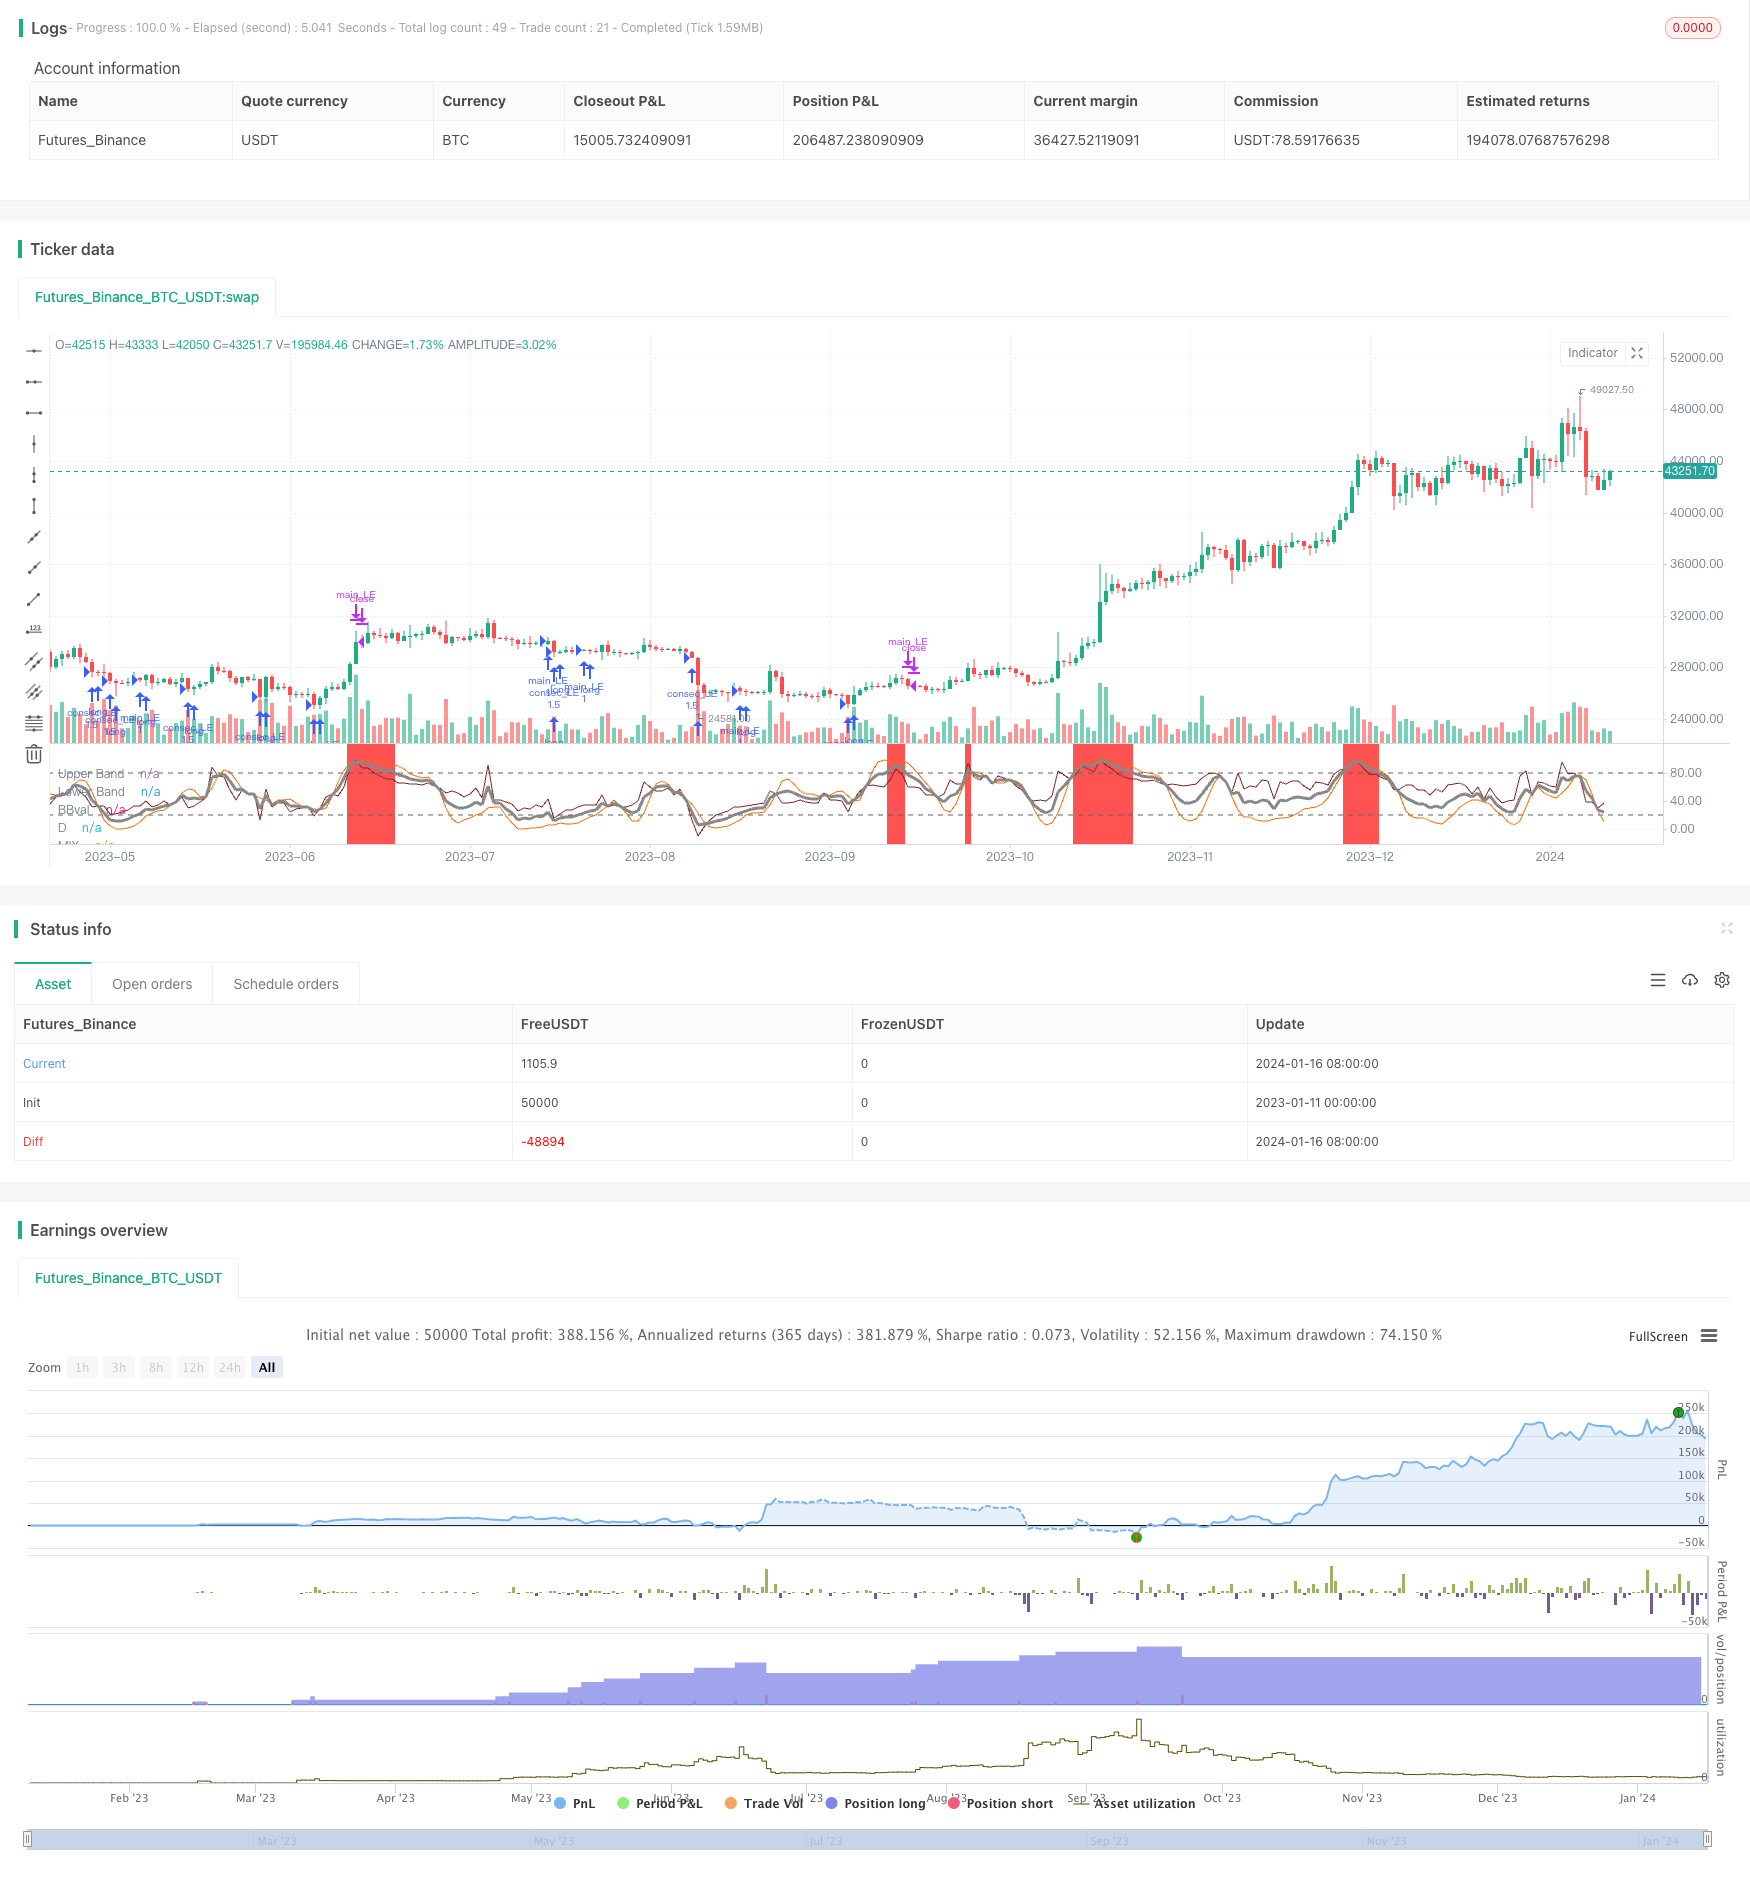
Overview
The strategy is named "Bollinger Band and RSI Mixing with DCA". It builds trading signals based on the Bollinger Band and Relative Strength Index (RSI) indicators and manages risks using progressive dollar cost averaging (DCA). The main idea is capturing the trend in a bull market using the indicators and reducing costs in a down market through progressive DCA.
Strategy Principle
The strategy integrates the Bollinger Band and RSI indicators. The Bollinger Band clearly judges the trend where above the middle band means a bull market and below means a bear market. RSI indicates overbuying and overselling situations. The strategy builds a MIX indicator by weighting the Bollinger band deviation and the K value of RSI. A long signal is generated when the MIX indicator breaks through 20 from below.
For the progressive DCA part, an initial position is opened when MIX breaks through 20. Additional positions are added at a fixed amount every time the price drops by a fixed percentage. This is continued until the maximal positions are reached or stop loss/take profit is triggered. By adding positions at market lows multiple times, the average cost can be lowered progressively.
Advantages of the Strategy
Combining two indicators improves signal accuracy by a clearer trend judgment.
The progressive DCA lowers cost basis during declines, reducing loss risk while increasing profit range.
Take profit and stop loss conditions promptly control risks and lock in partial profit.
Added date range filter allows focused backtests and optimizations of specific periods.
Risks and Solutions
Both Bollinger Band and RSI may suffer failures. Different parameter combinations can be tested for best signal accuracy.
Progressive DCA can increase loss during big crashes by continuously adding positions. Maximal entries can be set along with proper stop loss level for better risk control.
Black swan events and abnormal price moves cannot be foreseen. Systemic risk filters using major indices can help avoid anomalous periods.
Optimization Directions
Test and optimize parameters for the MIX indicator to obtain more accurate trading signals.
Optimize stop loss, take profit parameters for best profit/loss ratio.
Test different adding position sizes and frequencies to find optimal combinations.
Consider adding trading volume control modules to open/close strategy based on volume conditions.
Summary
The "Bollinger Band and RSI Mixing with DCA Strategy" combines multiple quantitative techniques and methods. It builds a clear trend judging indicator and lowers cost basis through progressive additions. Strict risk control methods including stop loss and take profit makes it practical. Further tests and optimizations can unlock its unique advantages into a profitable trading system. With both profit seeking and risk control in mind, it is worth verifying with live trading and applications.
Parameters
| Name | Default | What it controls |
|---|---|---|
| v_input_1 | 3 | K |
| v_input_2 | 3 | D |
| v_input_3 | 14 | RSI Length |
| v_input_4 | 14 | Stochastic Length |
| v_input_5_close | 0 | RSI Source: close | high | low | open | hl2 | hlc3 | hlcc4 | ohlc4 |
| v_input_6 | 20 | BB lookback length |
| v_input_7 | 2 | StdDev |
| v_input_8 | false | Offset |
| v_input_9 | true | From Month |
| v_input_10 | true | From Day |
| v_input_11 | 2020 | From Year |
| v_input_12 | true | To Month |
| v_input_13 | true | To Day |
| v_input_14 | 2112 | To Year |
| v_input_15 | true | Amount (P) |
| v_input_16 | 2 | % Price drop for consecutive entries(X) |
| v_input_17 | 10 | % Level for Take Profit (B) |
| v_input_18 | 10 | % Level for Stop Loss (D) |
| v_input_19 | 5 | Max consecutive entries (A) |
| v_input_20 | 0.5 | Z |
Source Pine Script
/*backtest
start: 2023-01-11 00:00:00
end: 2024-01-17 00:00:00
period: 1d
basePeriod: 1h
exchanges: [{"eid":"Futures_Binance","currency":"BTC_USDT"}]
*/

// © lagobrian23
//@version=4
strategy(title = 'Bollinger Bands and RSI mix with DCA', shorttitle = 'BB/RSI with DCA',pyramiding = 20, calc_on_every_tick = true, overlay = false )
source=close
smoothK = input(3, "K", minval=1)
smoothD = input(3, "D", minval=1)
lengthRSI = input(14, "RSI Length", minval=1)
lengthStoch = input(14, "Stochastic Length", minval=1)
src = input(close, title="RSI Source")
rsi1 = rsi(src, lengthRSI)
k = sma(stoch(rsi1, rsi1, rsi1, lengthStoch), smoothK)
d = sma(k, smoothD)

// Bollinger Band

length = input(20,title = 'BB lookback length', minval=1)
mult = input(2.0, minval=0.001, maxval=50, title="StdDev")
basis = sma(src, length)
dev = mult * stdev(src, length)
upper = basis + dev
lower = basis - dev
BBval = (src - basis)/dev*30+50
offset = input(0, title = "Offset", type = input.integer, minval = -500, maxval = 500)
mix=(d + BBval)/2

//plot
//plot(k, "K", color=#606060)
plot(BBval, "BBval", color=#872323, offset = offset)
plot(d, "D", color=#FF6A00)
h0 = hline(80, "Upper Band", color=#606060)
h1 = hline(20, "Lower Band", color=#606060)
plot(mix, "MIX", color=#888888, linewidth=3)

//background MIX
bgcolor(mix < 20 ? color.green : color.white, transp=50)
bgcolor(mix > 80 ? color.red : color.white, transp=50)

// Choosing the date range
fromMonth = input(defval = 1,    title = "From Month",      type = input.integer, minval = 1, maxval = 12)
fromDay   = input(defval = 1,    title = "From Day",        type = input.integer, minval = 1, maxval = 31)
fromYear  = input(defval = 2020, title = "From Year",       type = input.integer, minval = 1970)
toMonth = input(defval = 1,    title = "To Month",      type = input.integer, minval = 1, maxval = 12)
toDay   = input(defval = 1,    title = "To Day",        type = input.integer, minval = 1, maxval = 31)
toYear  = input(defval = 2112, title = "To Year",       type = input.integer, minval = 1970)

start     = timestamp(fromYear, fromMonth, fromDay, 00, 00)        // backtest start window
finish    = timestamp(toYear, toMonth, toDay, 23, 59)        // backtest finish window
window()  => true

// Initializing the strategy paraeters

P = input(defval = 1, title = 'Amount (P)' , type = input.integer, minval = 1, maxval = 100)
X = input(defval = 2, title = '% Price drop for consecutive entries(X)', type = input.float, minval = 1, maxval = 100)
B_tp = input(defval = 10, title = '% Level for Take Profit (B)', type = input.float , minval = 1, maxval = 100)
D_sl = input(defval = 10, title = '% Level for Stop Loss (D)', type = input.float, minval = 1, maxval = 100)
A = input(defval = 5, title = 'Max consecutive entries (A)', type = input.integer, minval = 2, maxval = 20)
Z = input(defval = 0.5, title = 'Z', type = input.float , minval = 0, maxval = 10)

// Declaring key DCA variables
entry_price = 0.0
entry_price := na(entry_price[1]) ? na : entry_price[1]
new_entry = 0.0
consec_entryCondition = false
// Implementing the strategy
longEntry = crossover(mix,20)
exitLongs = crossunder(mix, 80)

if(longEntry)
    entry_price := close
    strategy.entry('main_LE', strategy.long , P, when = window() and longEntry)

// Exiting conditions
stoploss = strategy.position_avg_price*(1-(D_sl/100))
takeprofit = strategy.position_avg_price*(1+(B_tp/100))
slCondition = crossunder(close, stoploss)
tpCondition = crossover(close, takeprofit)

// We want to exit if the 'mix' indicator crosses 80, take profit is attained or stop loss is tagged.
exitConditions = exitLongs or slCondition or tpCondition

// Consecutive entries upto A times
// strategy.risk.max_intraday_filled_orders(A)

//Dollar-Cost-Averaging
// Enter long whenever price goes down X%: amount set to (P+Y)*Z
newAmount = (P+X)*Z
// If we haven't reached max open trades, buy newAmount immediately price crosses under X% lower the previous entry price
new_entry := entry_price - ((X/100)*entry_price)
consec_entryCondition := crossunder(close, new_entry)
if(consec_entryCondition and strategy.opentrades != A)
    strategy.entry('consec_LE', strategy.long, newAmount, oca_name = 'consecLongs', when = window() and consec_entryCondition)
    entry_price := close

// Exiting
// The main trade is closed only when the  main exit conditions are satisfied
strategy.close('main_LE', comment = 'Main Long Closed', when = window() and exitConditions)

// A consective long is closed only when tp or sl is tagged
strategy.exit('ext a consec', 'consec_LE', loss = D_sl*strategy.position_avg_price , profit = B_tp*strategy.position_avg_price, oca_name =  'consecLongs')
Published by ChaoZhang on the FMZ strategy square · last modified 2024-01-18. Collected in the Quant Trading Vault. Unvalidated research: re-test with your own data and costs before trusting it.
Build this with AgenKit
A spec is not a trading system. Paste this into your coding agent and AgenKit runs a specialist team — architecture, test-first build, risk gates, review — with paper trading on by default.
/agenkit build a production-grade trading bot with a backtest engine, risk controls and paper trading by default from strategies/Bollinger-Band-and-RSI-Mixing-with-DCA-Strategy.md- npx agenkit install engineering-kit in your project
- Paste the command into your agent and approve each phase
- Get tests, backtest, risk controls and a paper-trading switch
Understand it first
Before you run this, read the lesson behind the idea and how to backtest it honestly. Specs like this one are the survivors of an unknown number of trials; deflate their results accordingly.
Related specs
- Flawless Victory DCA Momentum and Volatility StrategyPine Script · DCA & fixed investment · 1d
- Dynamic Cost Averaging Strategy System Based on Bollinger Bands and RSIPine Script · DCA & fixed investment · 1d
- Momentum Bollinger Bands Dual Moving Average DCA StrategyPine Script · DCA & fixed investment · 1d
- Fibonacci Zone DCA StrategyPine Script · DCA & fixed investment · 1d
- Multi Indicator Confirmation EMA Breakout with DCA and Dynamic Take Profit StrategyPine Script · DCA & fixed investment · 1d
- DCA Dual Moving Average Turtle Trading StrategyPine Script · DCA & fixed investment · 10m