Strategy vault / Trend following
Bollinger Band ATR Trend Following Strategy
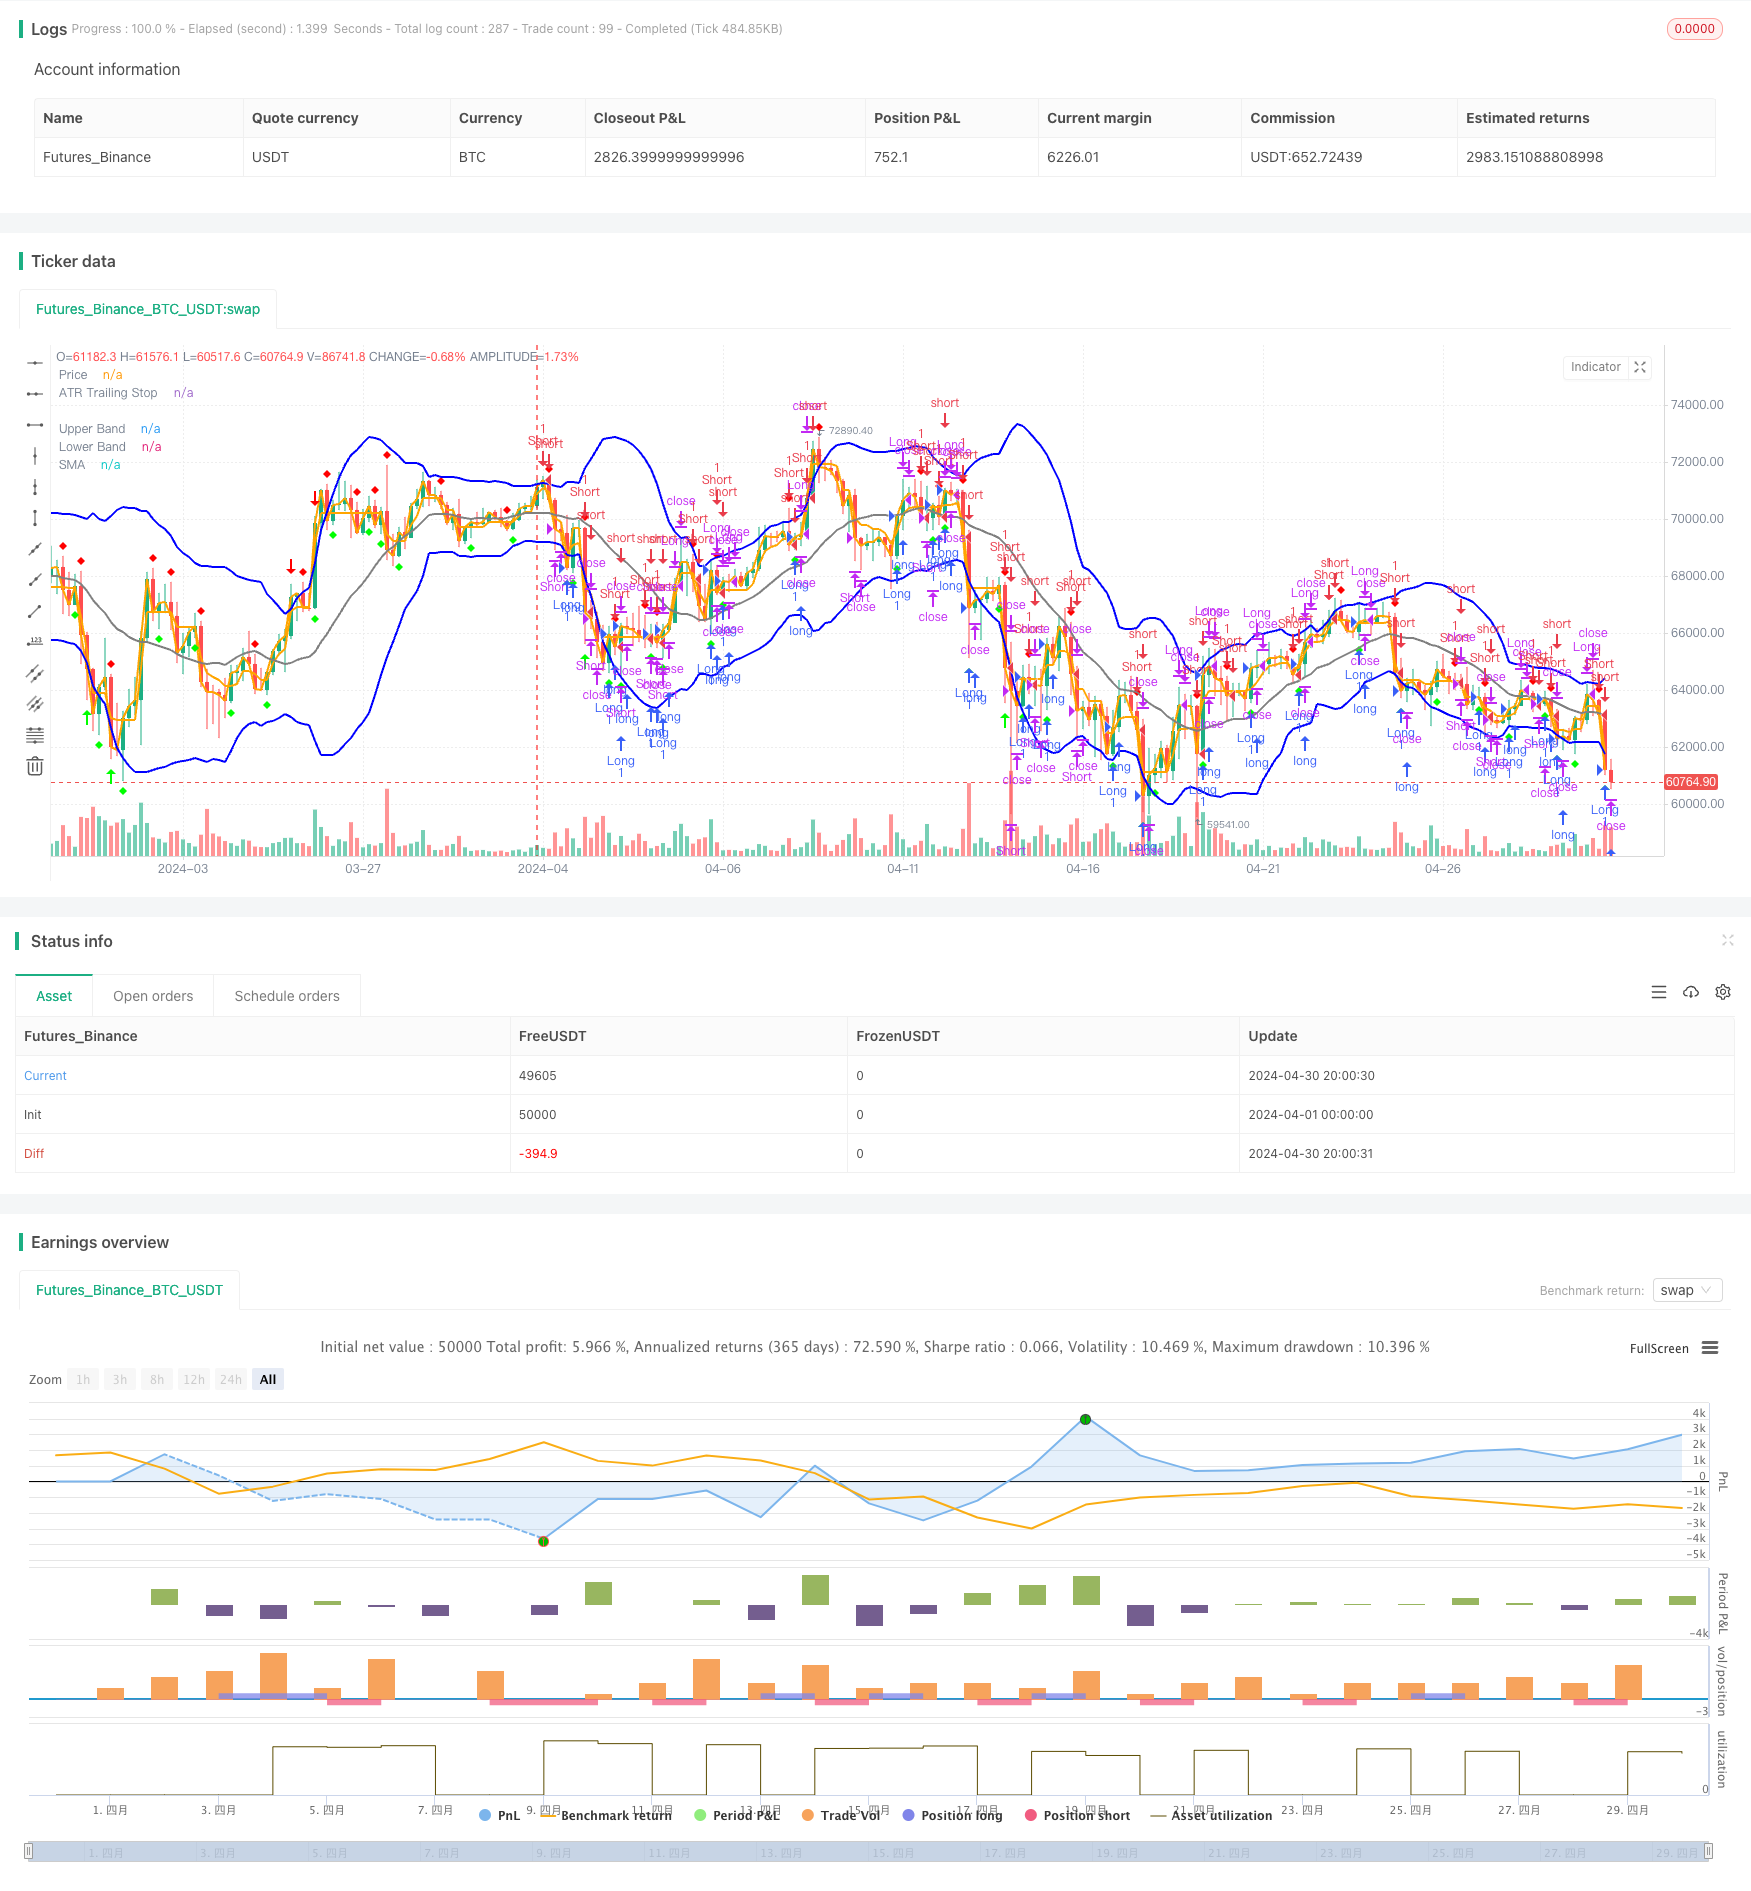
This strategy is based on Bollinger Bands and the ATR indicator. It captures price fluctuations using Bollinger Bands, uses price breakouts above or below the bands as entry signals, and employs ATR as a trailing…
Overview
This strategy is based on Bollinger Bands and the ATR indicator. It captures price fluctuations using Bollinger Bands, uses price breakouts above or below the bands as entry signals, and employs ATR as a trailing stop loss. The strategy closes positions when the price crosses the simple moving average. It aims to capture trending markets, enter positions in the direction of the trend, and promptly close positions when the trend reverses.
Strategy Principles
- Calculate Bollinger Bands: Use the closing price to calculate the simple moving average (SMA) as the middle band, and calculate the upper and lower bands based on volatility (standard deviation).
- Calculate ATR: Use the moving average of true range (TR) to calculate ATR as the basis for the trailing stop loss.
- Generate trading signals: When the price breaks below the lower Bollinger Band, generate a long signal; when it breaks above the upper Bollinger Band, generate a short signal. When the price breaks above the ATR trailing stop, generate a long signal; when it breaks below the ATR trailing stop, generate a short signal.
- Close positions: For long positions, if the price breaks above the simple moving average, close the long position; for short positions, if the price breaks below the simple moving average, close the short position.
Strategy Advantages
- Trend following: Captures trending markets by using Bollinger Bands and ATR trailing stop, adapting to different market environments.
- Timely stop loss: Uses ATR as a trailing stop loss, dynamically adjusting the stop loss position according to market volatility to control risk.
- Simple and easy to use: The strategy logic is clear, with few parameters, making it easy to understand and apply.
Strategy Risks
- Parameter sensitivity: The performance of the strategy is affected by the choice of parameters for Bollinger Bands and ATR, requiring optimization for different markets and instruments.
- Choppy markets: In choppy market conditions, frequent trading signals may lead to excessive trading frequency and costs.
- Trend reversal: When a trend reverses, the strategy may experience significant drawdowns.
Strategy Optimization Directions
- Parameter optimization: Optimize the parameters of Bollinger Bands and ATR to find the best combination for different markets and instruments.
- Filters: Add other technical indicators or price behavior patterns as filters to reduce misjudgments and improve signal quality.
- Position management: Dynamically adjust positions based on market volatility or account risk to improve capital utilization efficiency and risk-adjusted returns.
Summary
The Bollinger Band ATR Trend Following Strategy captures trending markets using Bollinger Bands and the ATR indicator. It has the advantages of trend following, timely stop loss, and simplicity. However, it also faces risks such as parameter sensitivity, choppy markets, and trend reversals. The strategy's performance can be further optimized through parameter optimization, adding filters, and position management.
Source Pine Script
/*backtest
start: 2024-04-01 00:00:00
end: 2024-04-30 23:59:59
period: 4h
basePeriod: 15m
exchanges: [{"eid":"Futures_Binance","currency":"BTC_USDT"}]
*/

//@version=5
strategy("Bollinger Bands and ATR Strategy", overlay=true)

// Veri Çekme
symbol = "AAPL"
timeframe = "D"
src = close

// Bollinger Bantları Hesaplama
len = 20
mult = 2
sum1 = 0.0, sum2 = 0.0
for i = 0 to len - 1
    sum1 += src[i]
basis = sum1 / len
for i = 0 to len - 1
    diff = src[i] - basis
    sum2 += diff * diff
dev = math.sqrt(sum2 / len)
upper_band = basis + dev * mult
lower_band = basis - dev * mult

// ATR Hesaplama
atr_period = input(10, title="ATR Period")
atr_value = 0.0
for i = 0 to atr_period - 1
    atr_value += math.abs(src[i] - src[i + 1])
atr_value /= atr_period
loss = input(1, title="Key Value (Sensitivity)")
atr_trailing_stop = src[1]
if src > atr_trailing_stop[1]
    atr_trailing_stop := math.max(atr_trailing_stop[1], src - loss * atr_value)
else if src < atr_trailing_stop[1]
    atr_trailing_stop := math.min(atr_trailing_stop[1], src + loss * atr_value)
else
    atr_trailing_stop := src - loss * atr_value

// Sinyal Üretme
long_condition  = src < lower_band and src[1] >= lower_band[1]
short_condition = src > upper_band and src[1] <= upper_band[1]
close_long  = src > basis
close_short = src < basis
buy_signal = src > atr_trailing_stop[1] and src[1] <= atr_trailing_stop[1]
sell_signal = src < atr_trailing_stop[1] and src[1] >= atr_trailing_stop[1]

if (long_condition)
    strategy.entry("Long", strategy.long, comment="Long Signal")
if (short_condition)
    strategy.entry("Short", strategy.short, comment="Short Signal")
if (close_long)
    strategy.close("Long", comment="Close Long")
if (close_short)
    strategy.close("Short", comment="Close Short")
if (buy_signal)
    strategy.entry("Long", strategy.long, comment="Buy Signal")
if (sell_signal)
    strategy.entry("Short", strategy.short, comment="Sell Signal")

// Çizim
plot(upper_band, color=#0000FF, linewidth=2, title="Upper Band")
plot(lower_band, color=#0000FF, linewidth=2, title="Lower Band")
plot(basis, color=#808080, linewidth=2, title="SMA")
plot(atr_trailing_stop, color=#FFA500, linewidth=2, title="ATR Trailing Stop")
plot(src, color=#FFA500, linewidth=2, title="Price")

// Sinyal İşaretleri
plotshape(long_condition, style=shape.arrowup, color=#00FF00, location=location.belowbar, size=size.small, title="Long Signal")
plotshape(short_condition, style=shape.arrowdown, color=#FF0000, location=location.abovebar, size=size.small, title="Short Signal")
plotshape(buy_signal, style=shape.diamond, color=#00FF00, location=location.belowbar, size=size.small, title="Buy Signal")
plotshape(sell_signal, style=shape.diamond, color=#FF0000, location=location.abovebar, size=size.small, title="Sell Signal")Published by ChaoZhang on the FMZ strategy square · last modified 2024-05-15. Collected in the Quant Trading Vault. Unvalidated research: re-test with your own data and costs before trusting it.
Build this with AgenKit
A spec is not a trading system. Paste this into your coding agent and AgenKit runs a specialist team — architecture, test-first build, risk gates, review — with paper trading on by default.
/agenkit build a production-grade trading bot with a backtest engine, risk controls and paper trading by default from strategies/Bollinger-Band-ATR-Trend-Following-Strategy.md- npx agenkit install engineering-kit in your project
- Paste the command into your agent and approve each phase
- Get tests, backtest, risk controls and a paper-trading switch
Understand it first
Before you run this, read the lesson behind the idea and how to backtest it honestly. Specs like this one are the survivors of an unknown number of trials; deflate their results accordingly.
Related specs
- ATR and Moving Average Crossover Hybrid StrategyPine Script · Trend following · 1h
- BB Percentage Index Trend Fading StrategyPine Script · Trend following · 1h
- Bollinger Bands and RSI Trend Following StrategyPine Script · Trend following · 1h
- Dual Moving Average Crossover Dynamic Position Optimization Strategy with EMA Cross Signal SystemPine Script · Trend following · 1h
- Dynamic Moving Average and Bollinger Bands Cross Strategy with Fixed Stop Loss Optimization ModelPine Script · Trend following · 3h
- EMA Cross Trend Following Strategy with SMA Stop Loss and Re Entry MechanismPine Script · Trend following · 1h