Strategy vault / Trend following
Bollinger Band Moving Average Crossover Strategy
This is a trading strategy based on the crossover of Bollinger Bands and moving averages to make buy and sell decisions. It mainly uses the Bollinger Bands indicator on the 5-minute timeframe to determine price…
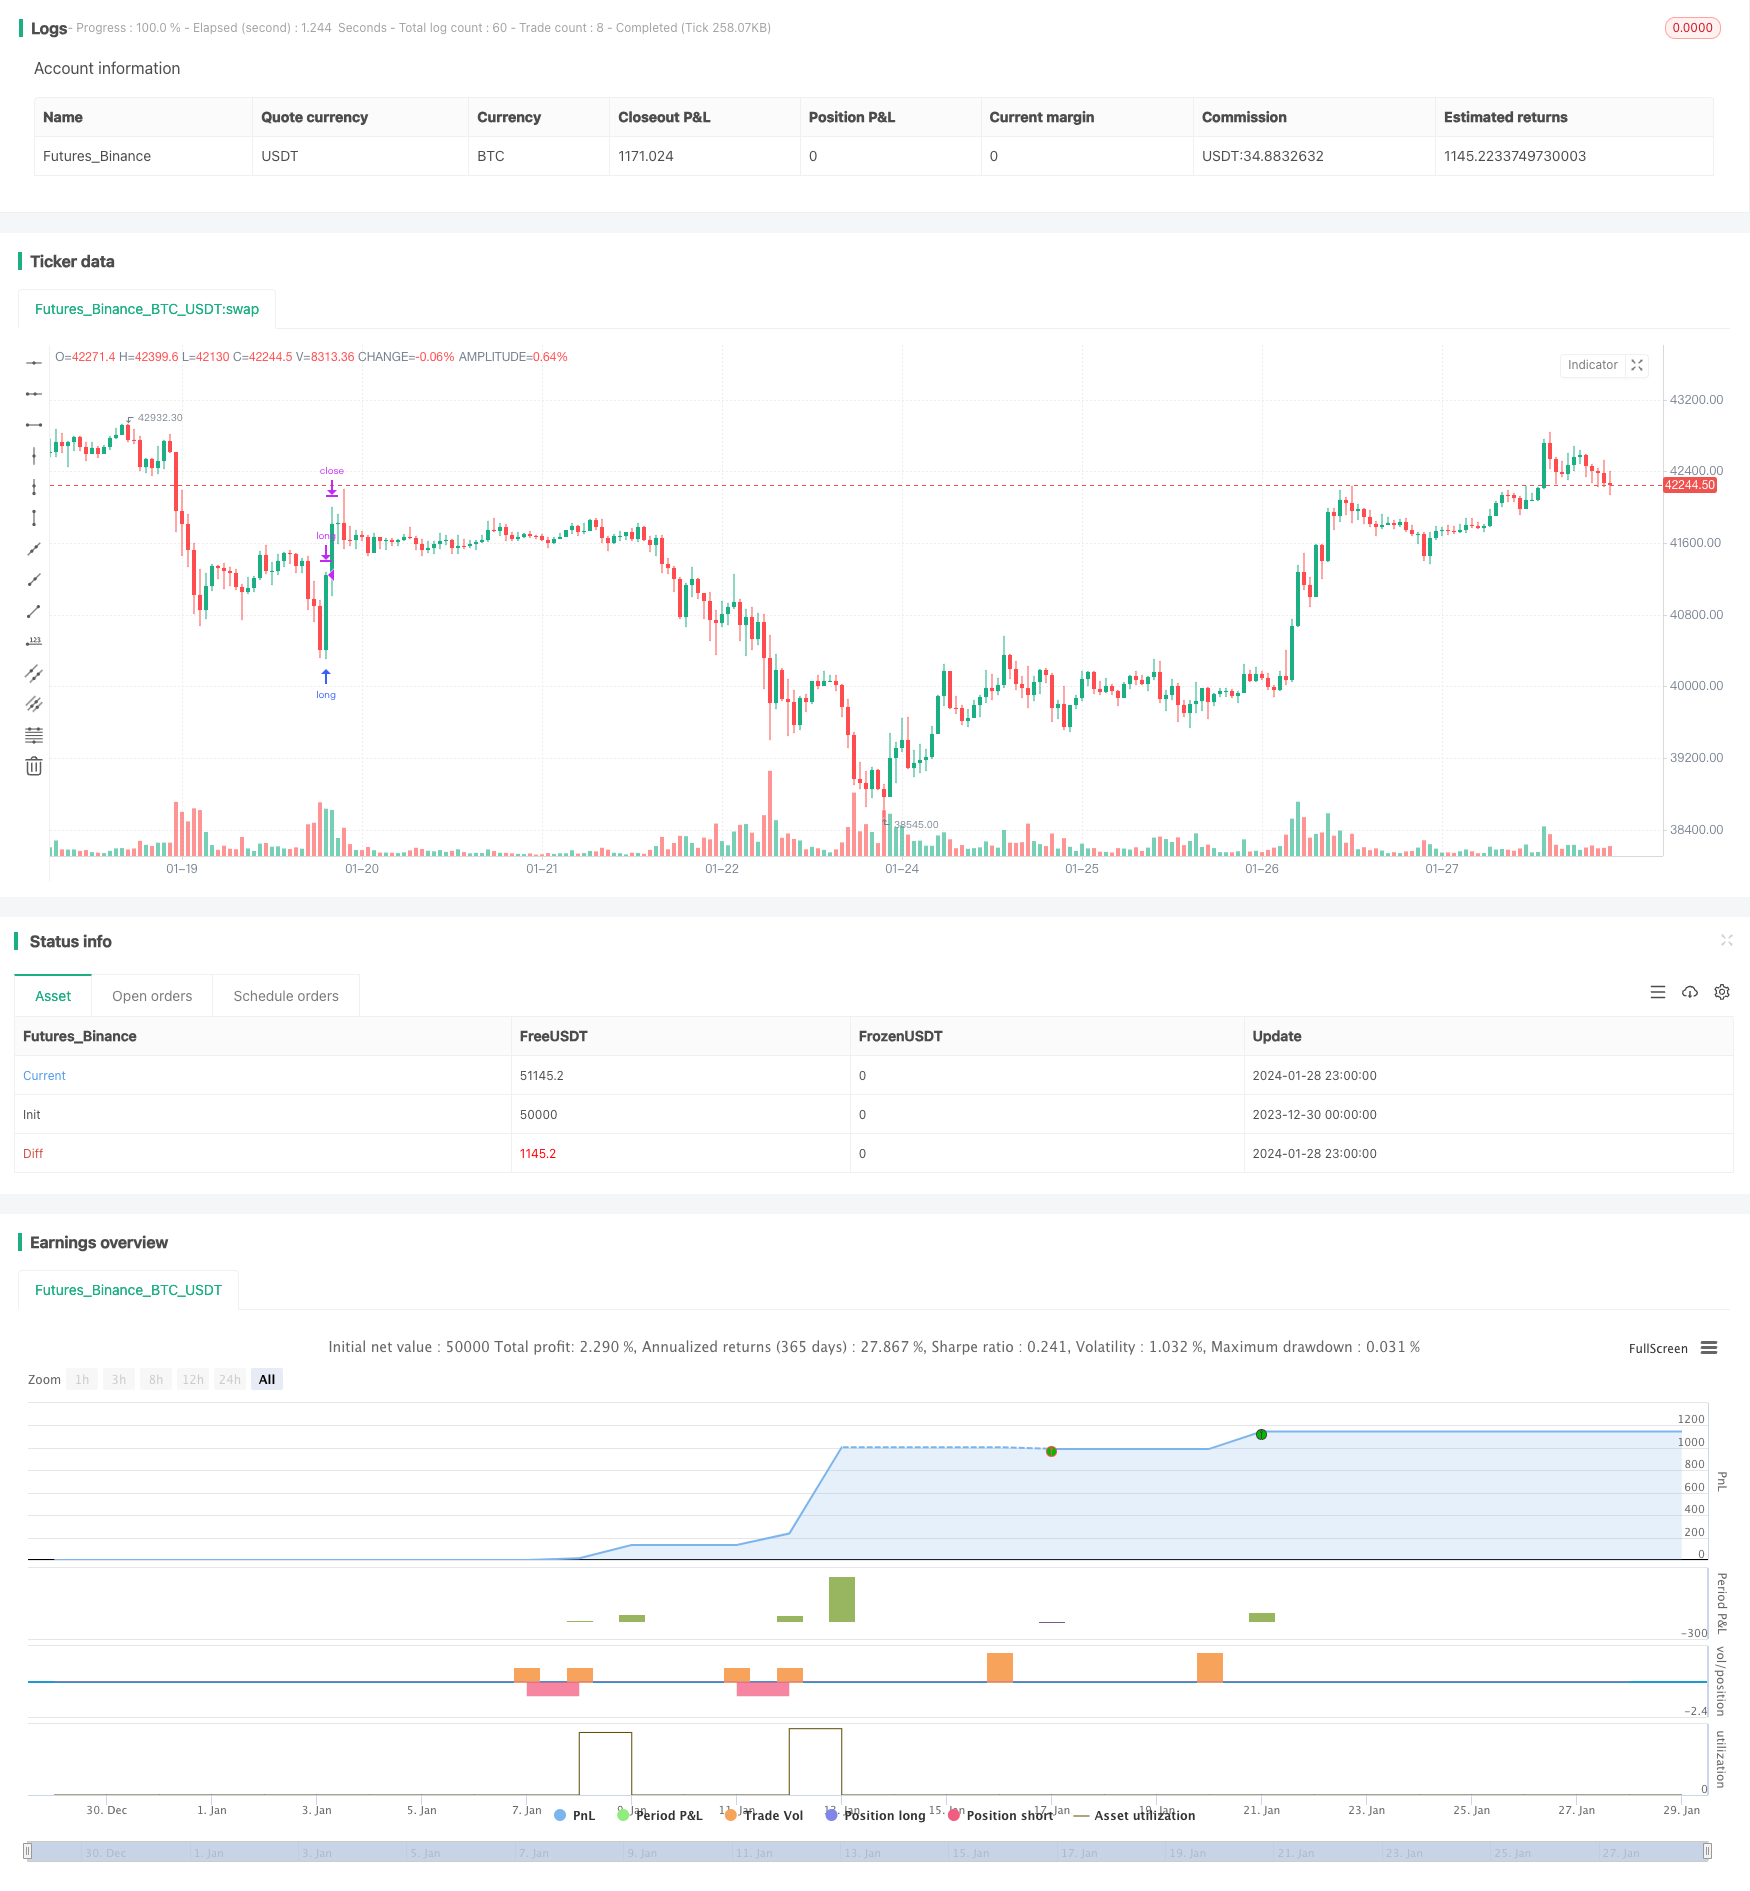
Overview
This is a trading strategy based on the crossover of Bollinger Bands and moving averages to make buy and sell decisions. It mainly uses the Bollinger Bands indicator on the 5-minute timeframe to determine price fluctuation range, combined with moving averages to determine trend direction, and forms trading strategy according to the crossover situations of upper band, lower band and middle band of Bollinger Bands. This strategy is suitable for the AUD/NZD currency pair.
Strategy Principle
Use Bollinger Bands indicator to determine the upper and lower limits of prices. The middle band of Bollinger Bands is a 20-period simple moving average, the upper band is the middle band plus two standard deviations, and the lower band is the middle band minus two standard deviations.
When the closing price breaks through the lower band upward, it indicates that the price starts to go up, so we make long entry here.
When the closing price exceeds the middle band of Bollinger Bands, it means the price has risen above the middle band, so we exit position here to finish this round of trading.
When the closing price breaks through the upper band downward, it means the price starts to go down, so we make short entry here.
When the closing price breaks down the middle band of Bollinger Bands, it means the price has fallen below the middle band, so we exit position here to finish this round of trading.
Advantage Analysis
Avoid missing reversal signals. This strategy makes full use of the characteristics of Bollinger Bands to capture price bounces from the lower band and drops from the upper band in a timely manner, avoiding losses caused by missing reversal opportunities.
Strong profitability. By making buy and sell entries at key points and setting reasonable stop loss, it can quickly switch directions during the transformation between bull and bear market to obtain better returns.
Appropriate trading frequency. Form trading signals based on 5-minute timeframe, which can capture short-term trends without trading too frequently to increase transaction costs.
Risk Analysis
Risk of too fast convergence of Bollinger Bands. When market prices fluctuate violently, the upper and lower bands of Bollinger Bands converge too fast, which can easily form false breaks and give out wrong signals. We need to adjust parameters or suspend trading at this point.
Stop loss risk. A stop loss that is too small may easily be broken through while a stop loss too large can lead to huge losses. We need to properly adjust the stop loss price.
High transaction cost risk. If the trading frequency is too high, transaction costs will also increase significantly. We need to properly adjust the parameters to reduce the trading frequency.
Optimization
Optimize Bollinger Bands parameters. We can test different combinations of cycle parameters and standard deviation parameters to find the set of parameters that best matches the volatility range of this particular product.
Add other indicators to filter false signals. Indicators like KDJ and MACD can be introduced to avoid issues caused by solely relying on Bollinger Bands.
Optimize stop loss strategy. We can set more accurate stop loss by tracking price changes in real time. Other strategies like stock line can also be used.
Conclusion
This strategy is relatively stable overall with some profitability. By optimizing parameters and stop loss strategies, trading risks can be further reduced to gain good returns in volatile market conditions. This strategy is worth further testing and optimization and has very good practical application prospects.
Parameters
| Name | Default | What it controls |
|---|---|---|
| v_input_1 | true | length |
| v_input_int_1 | 200 | emaLenght |
| v_input_int_2 | 20 | length1 |
| v_input_string_1 | 0 | Basis MA Type: SMA | EMA | SMMA (RMA) | WMA | VWMA |
| v_input_2_close | 0 | Source: close | high | low | open | hl2 | hlc3 | hlcc4 | ohlc4 |
| v_input_float_1 | 2 | StdDev |
| v_input_int_3 | false | Offset |
Source Pine Script
/*backtest
start: 2023-12-30 00:00:00
end: 2024-01-29 00:00:00
period: 1h
basePeriod: 15m
exchanges: [{"eid":"Futures_Binance","currency":"BTC_USDT"}]
*/

//@version=5
// This source code is subject to the terms of the Mozilla Public License 2.0 at https://mozilla.org/MPL/2.0/
// © theTradeAI

strategy('TradeAI - 5min AUDNZD Strategy', overlay=true)

//////////////////////////////
//////// STOP ORDERS DETECTING
//////////////////////////////

length = input(1)

h = ta.highest(high, length)
l = ta.lowest(low, length)

//////////////////////////////
//////// EMAS
//////////////////////////////

emaLenght = input.int(200)

ema200 = ta.ema(close,emaLenght)

//////////////////////////////
//////// BOLLINGER BANDS
//////////////////////////////

length1 = input.int(20, minval=1)
maType = input.string("SMA", "Basis MA Type", options = ["SMA", "EMA", "SMMA (RMA)", "WMA", "VWMA"])
src = input(close, title="Source")
mult = input.float(2.0, minval=0.001, maxval=50, title="StdDev")

ma(source, length1, _type) =>
    switch _type
        "SMA" => ta.sma(source, length1)
        "EMA" => ta.ema(source, length1)
        "SMMA (RMA)" => ta.rma(source, length1)
        "WMA" => ta.wma(source, length1)
        "VWMA" => ta.vwma(source, length1)

basis = ma(src, length1, maType)
dev = mult * ta.stdev(src, length1)
upperr = basis + dev
lowerr = basis - dev
offset = input.int(0, "Offset", minval = -500, maxval = 500)


//////////////////////////////
//////// ENTRY & EXIT
//////////////////////////////

// Buy entry
if ta.crossover(lowerr, close)
    strategy.entry('long', strategy.long, stop=h)

// Buy entry CANCEL
if close > lowerr
    strategy.cancel('long')

// Buy exit
if close > basis
    strategy.close('long')

// Sell entry
if ta.crossunder(upperr, close)
    strategy.entry('short', strategy.short, stop=l)

// Sell entry CANCEL
if close < upperr
    strategy.cancel('short')

// Sell exit
if close < basis
    strategy.close('short')
Published by ChaoZhang on the FMZ strategy square · last modified 2024-01-30. Collected in the Quant Trading Vault. Unvalidated research: re-test with your own data and costs before trusting it.
Build this with AgenKit
A spec is not a trading system. Paste this into your coding agent and AgenKit runs a specialist team — architecture, test-first build, risk gates, review — with paper trading on by default.
/agenkit build a production-grade trading bot with a backtest engine, risk controls and paper trading by default from strategies/Bollinger-Band-Moving-Average-Crossover-Strategy.md- npx agenkit install engineering-kit in your project
- Paste the command into your agent and approve each phase
- Get tests, backtest, risk controls and a paper-trading switch
Understand it first
Before you run this, read the lesson behind the idea and how to backtest it honestly. Specs like this one are the survivors of an unknown number of trials; deflate their results accordingly.
Related specs
- ATR and Moving Average Crossover Hybrid StrategyPine Script · Trend following · 1h
- Bollinger Bands and EMA Trend Following StrategyPine Script · Trend following · 1h
- Bollinger Bands and RSI Trend Following StrategyPine Script · Trend following · 1h
- Dual Moving Average Crossover Dynamic Position Optimization Strategy with EMA Cross Signal SystemPine Script · Trend following · 1h
- EMA Cross Trend Following Strategy with SMA Stop Loss and Re Entry MechanismPine Script · Trend following · 1h
- EMA and RSI Trend Trading StrategyPine Script · Trend following · 1d