Strategy vault / Mean reversion
Bollinger Band Reversal Based Quantitative Strategy
The strategy is named "Bollinger Band Reversal Based Quantitative Strategy". It utilizes the upper and lower rails of the Bollinger Bands to determine entries and exits. When the price is near the lower rail of the…
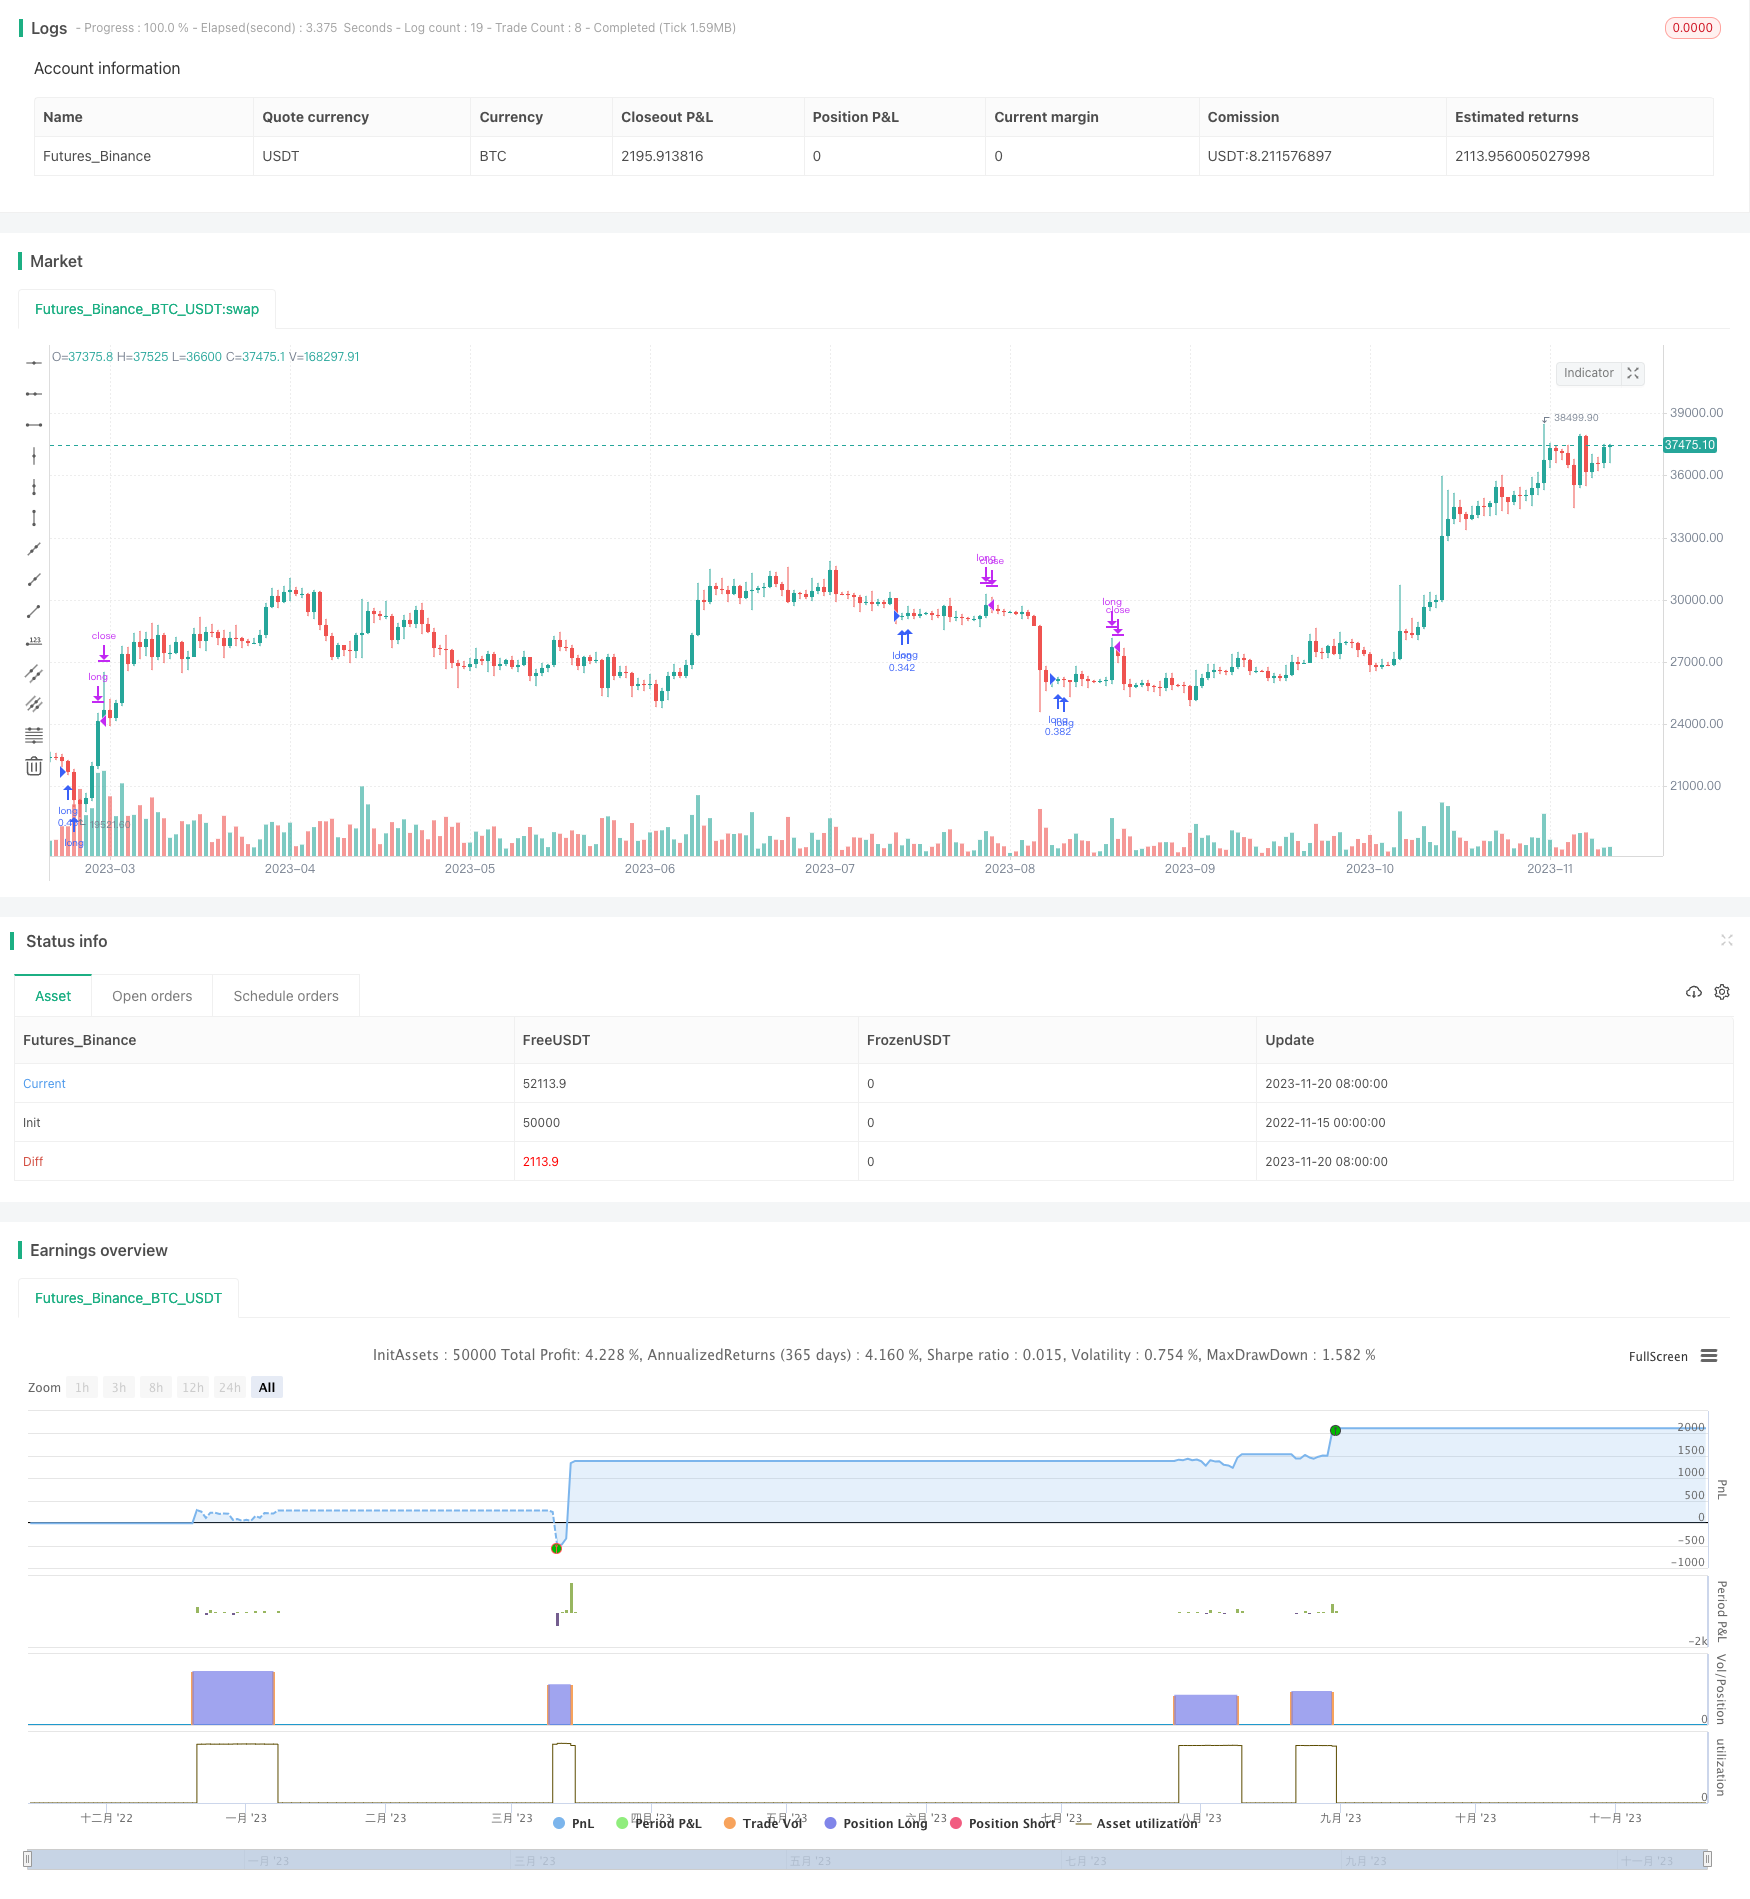
Overview
The strategy is named "Bollinger Band Reversal Based Quantitative Strategy". It utilizes the upper and lower rails of the Bollinger Bands to determine entries and exits. When the price is near the lower rail of the bands and shows signs of a downward breakthrough, it indicates the price may be reversing, so go long. When the price rises to the upper rail, it indicates the price may reverse downwards, so go short.
Strategy Logic
The strategy uses the RSI indicator to determine long entries. Specifically, it checks if the closing price of the most recent bar is lower than the lowest price of the previous 6 bars, meantime the Bollinger Band Width (BBW) is greater than a threshold, and the Bollinger Band Ratio (BBR) is within a range. If these criteria are met, it indicates the price may be reversing, so go long.
The exit is simple. When RSI goes above 70, indicating the price is overheated, close the long position.
Advantage Analysis
The biggest advantage of this strategy is utilizing the upper and lower rails of Bollinger Bands to determine entries. When BB reverses direction, go long or short to catch short-term reversal opportunities. Compared to simple RSI strategies, this strategy has more prudent criteria for entries, thus avoiding wrong trades.
Also, the strategy is sensitive to parameters. By tuning BBW and BBR, it can be optimized for different products and achieve better results.
Risk Analysis
The main risk is that BB does not perfectly predict price reversals. If the timing is inappropriate, it easily leads to missing best entries or floating losses.
Also, short-term fluctuations may trigger frequent entries and exits, increasing costs from commissions and slippages. If the reversing momentum is not enough, it risks taking losses from exits.
Optimization Directions
The strategy can be improved in the following aspects:
Optimize parameters. Test and tune BBW, BBR and other parameters more finely for different products.
Add stop loss mechanisms, such as trailing stop loss and time stop loss, to limit maximum losses.
Incorporate other indicators, like KDJ and MACD, to make entries more reliable.
Improve exit logic. The current exit is simple. Can optimize with trailing profit taking or exits based on volatility.
Conclusion
This strategy utilizes the characteristics of Bollinger Bands to determine potential reversal points for entries and exits. Compared to single indicators like RSI, it has more accurate timing. With parameter tuning, stop losses and take profits, it can be more reliable. But BB's prediction is not perfect, so there are still some randomness in performance.
Parameters
| Name | Default | What it controls |
|---|---|---|
| v_input_1 | 15 | bbw3 |
| v_input_2 | 0.45 | bbr3level |
| v_input_3 | 0.448 | bbrlower |
| v_input_4 | 0.456 | bbrhigher |
| v_input_5 | 7 | sincelowestmin |
| v_input_6 | 57 | sincelowestmax |
| v_input_7 | 20 | length |
Source Pine Script
/*backtest
start: 2022-11-15 00:00:00
end: 2023-11-21 00:00:00
period: 1d
basePeriod: 1h
exchanges: [{"eid":"Futures_Binance","currency":"BTC_USDT"}]
*/

//@version=4

//study(title = "Bolinger strategy", overlay=true)
strategy("Bolinger strategy",currency="SEK",default_qty_value=10000,default_qty_type=strategy.cash,max_bars_back=50)
len = 5
src = close
up = rma(max(change(src), 0), len)
down = rma(-min(change(src), 0), len)
rsi = down == 0 ? 100 : up == 0 ? 0 : 100 - (100 / (1 + up / down))


bbw3level = input(15, title="bbw3")
bbr3level = input(0.45, title="bbr3level")
bbrlower = input(0.4480, title="bbrlower")
bbrhigher = input(0.4560, title="bbrhigher")
sincelowestmin = input(7, title="sincelowestmin")
sincelowestmax = input(57, title="sincelowestmax")


length = input(20, minval=1)
mult = 20
src3 = close[3]
basis3 = sma(src3, length)
dev3 = mult * stdev(src3, length)
upper3 = basis3 + dev3
lower3 = basis3 - dev3
bbr3 = (src3 - lower3)/(upper3 - lower3)
bbw3 = (upper3-lower3)/basis3*100


basis = sma(src, length)
dev = mult * stdev(src, length)
upper = basis + dev
lower = basis - dev
bbr = (src - lower)/(upper - lower)
bbw = (upper-lower)/basis*100

criteriamet = 0
crossUnderB0 = crossunder(bbr,0)

since_x_under = barssince(crossUnderB0)


sincelowest = barssince(close[6] > close[3] and close[5] > close[3] and close[4] > close[3] and close[2] > close[3] and close[1] > close[3] and close > close[3] and bbw3 > bbw3level and bbr3 < bbr3level) //  and bbr3 < 0

if sincelowest > sincelowestmin and sincelowest < sincelowestmax and bbr > bbrlower and bbr < bbrhigher
	criteriamet := 1
else
	criteriamet := 0
//plot (criteriamet)

//exit
exitmet = 0
if rsi > 70
	exitmet := 1
else
	exitmet := 0

if criteriamet == 1
	strategy.entry("long", strategy.long)
if exitmet == 1
	strategy.close("long")
Published by ChaoZhang on the FMZ strategy square · last modified 2023-11-22. Collected in the Quant Trading Vault. Unvalidated research: re-test with your own data and costs before trusting it.
Build this with AgenKit
A spec is not a trading system. Paste this into your coding agent and AgenKit runs a specialist team — architecture, test-first build, risk gates, review — with paper trading on by default.
/agenkit build a production-grade trading bot with a backtest engine, risk controls and paper trading by default from strategies/Bollinger-Band-Reversal-Based-Quantitative-Strategy.md- npx agenkit install engineering-kit in your project
- Paste the command into your agent and approve each phase
- Get tests, backtest, risk controls and a paper-trading switch
Understand it first
Before you run this, read the lesson behind the idea and how to backtest it honestly. Specs like this one are the survivors of an unknown number of trials; deflate their results accordingly.
Related specs
- Advanced 15 Minute Chart Trading Signal StrategyPine Script · Mean reversion · 3h
- CCTBBO Reversal Tracking StrategyPine Script · Mean reversion · 45m
- Multi Timeframe Gold Reversal Tracking StrategyPine Script · Mean reversion · 2h
- Price Volatility Mean Reversion StrategyPine Script · Mean reversion · 2d
- Reversal Bollinger Band RSI MACD Quant StrategyPine Script · Mean reversion · 4h
- Bollinger Bands and VWAP based Quantitative Trading StrategyPine Script · Mean reversion · 1h