Bollinger Bands and RSI Combined Dynamic Trading Strategy
This strategy is an adaptive trading system that combines Bollinger Bands and Relative Strength Index (RSI). It identifies potential trading opportunities by utilizing Bollinger Bands' price channels and RSI's…
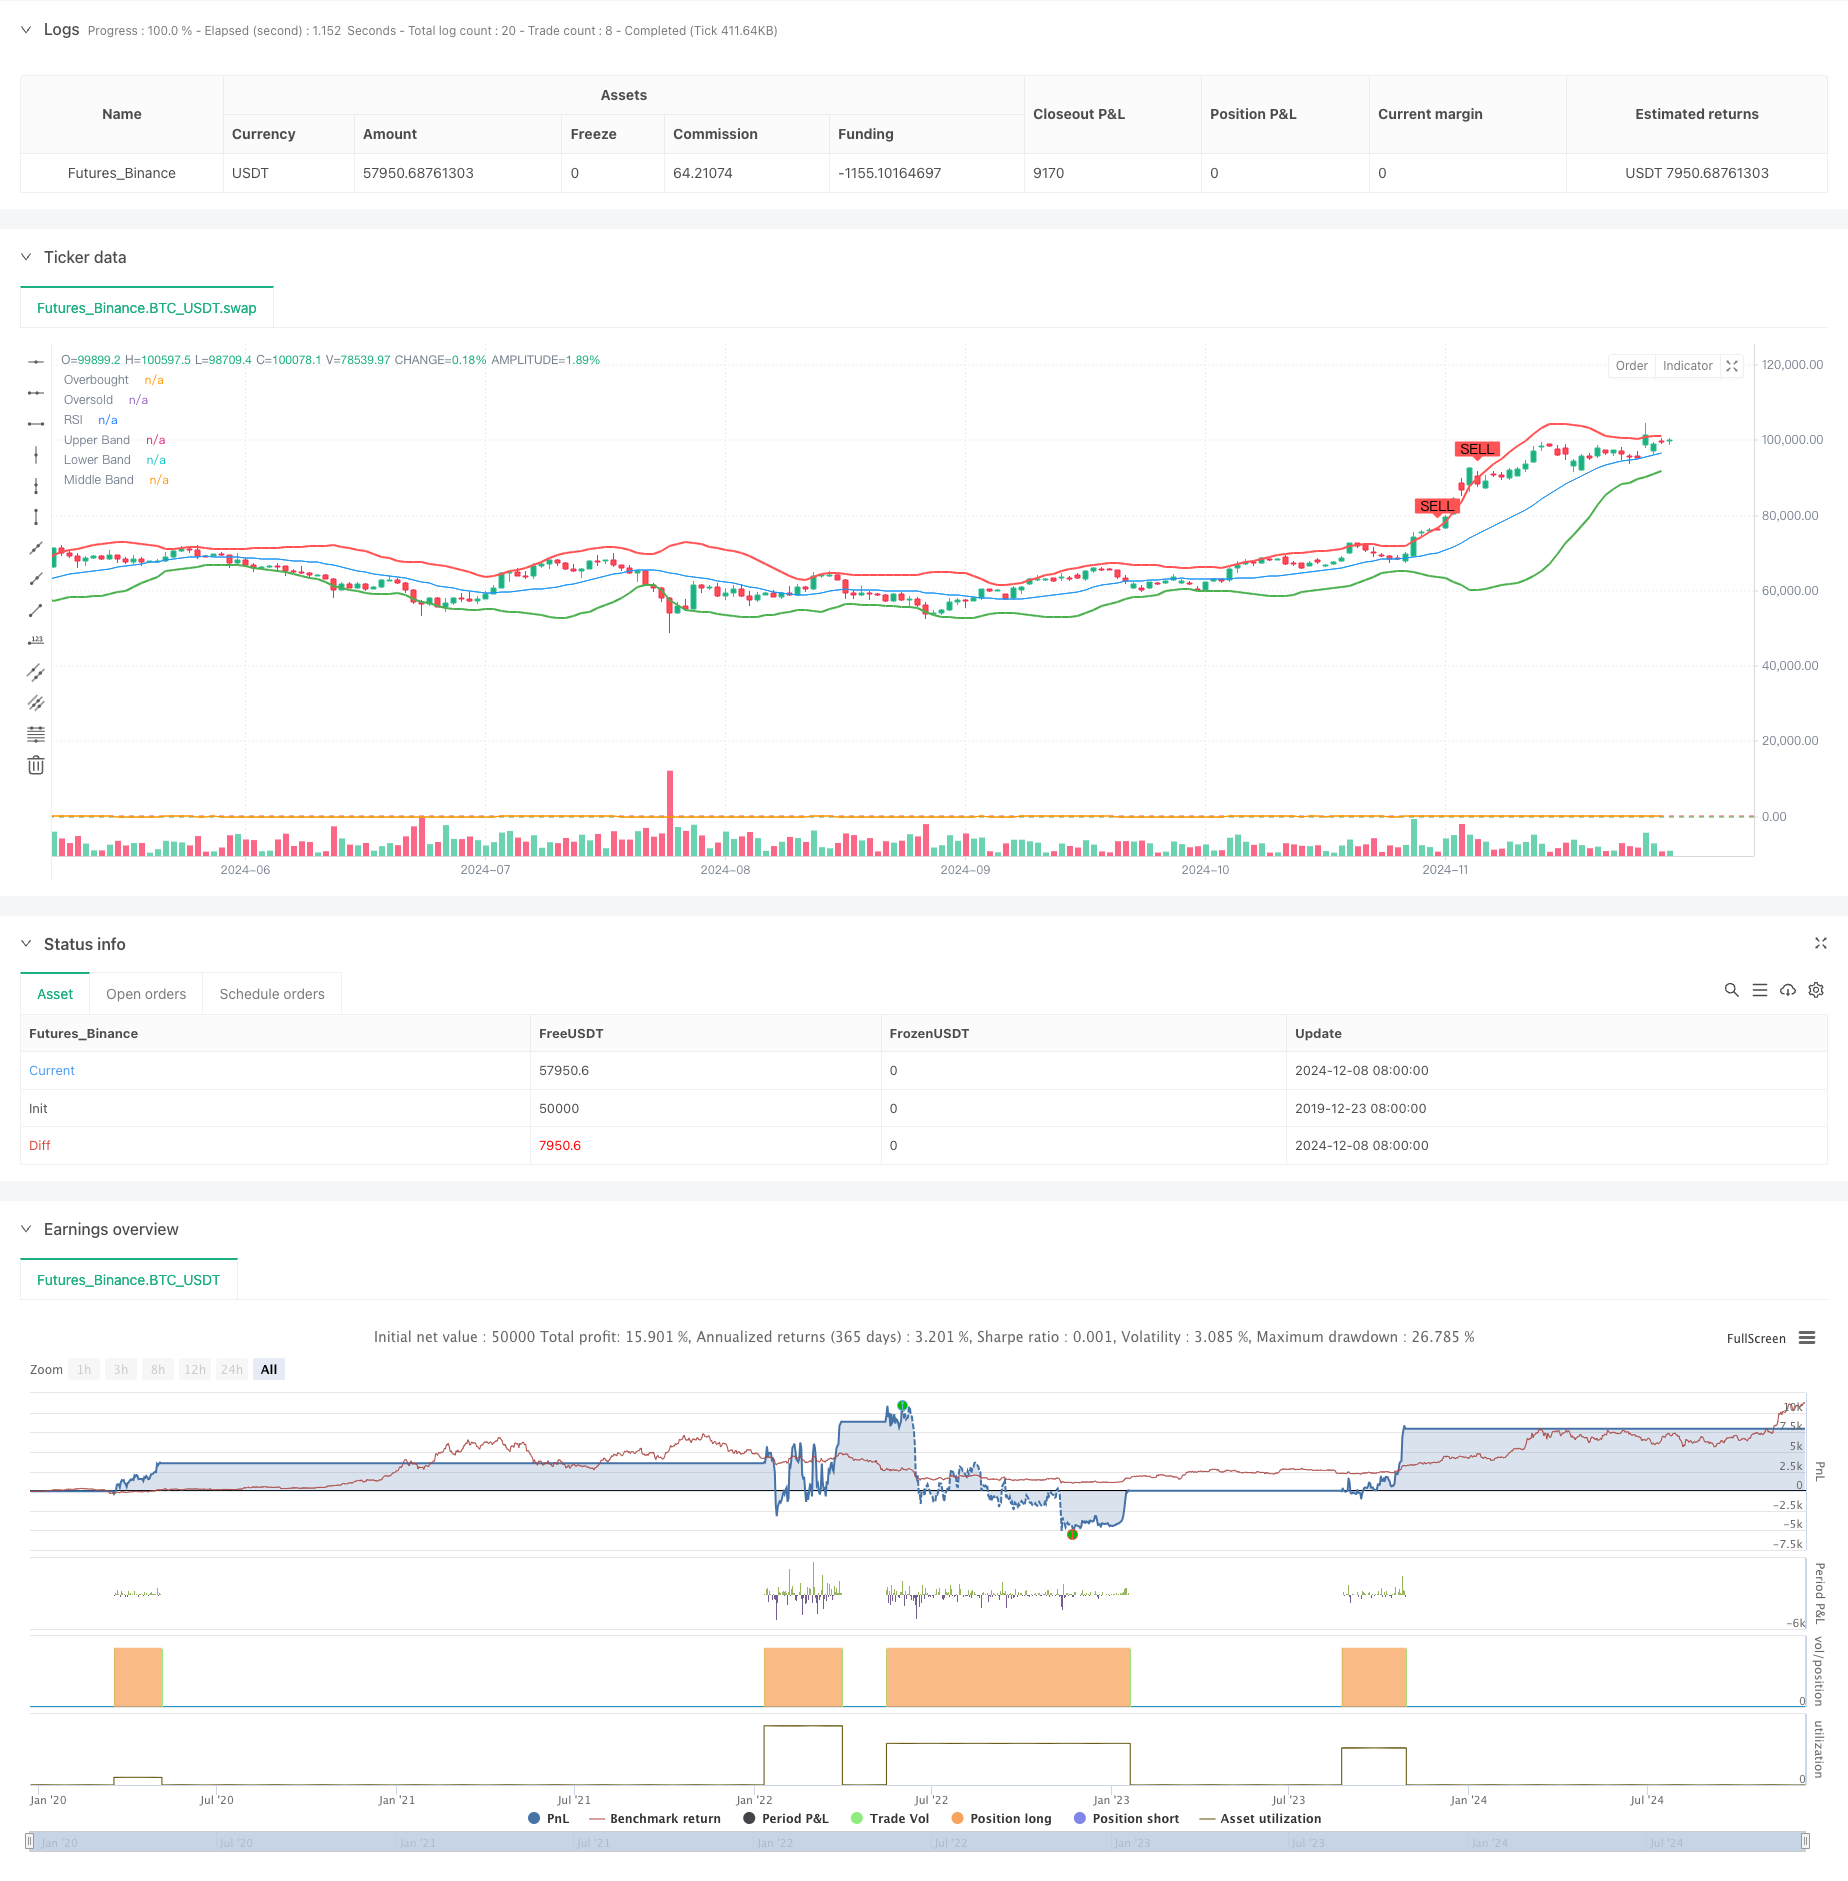
Overview
This strategy is an adaptive trading system that combines Bollinger Bands and Relative Strength Index (RSI). It identifies potential trading opportunities by utilizing Bollinger Bands' price channels and RSI's overbought/oversold signals to capture market trends and volatility. The strategy uses standard deviation to dynamically adjust trading ranges and combines RSI indicator's overbought/oversold levels to confirm trading signals, thereby improving trading accuracy.
Strategy Principles
The core of the strategy is to capture market volatility opportunities through Bollinger Bands' upper, middle, and lower bands in conjunction with the RSI indicator. Bollinger Bands are based on a 20-period moving average with 2 standard deviations for the upper and lower bands. RSI uses a 14-period calculation with 70 as overbought and 30 as oversold levels. Buy signals are generated when price touches the lower band and RSI is in oversold territory; sell signals occur when price touches the upper band and RSI is in overbought territory. This double confirmation mechanism effectively reduces false signals.
Strategy Advantages
- High Adaptability: Bollinger Bands automatically adjust trading ranges based on market volatility, adapting to different market environments.
- Reliable Signals: Double confirmation mechanism through Bollinger Bands and RSI significantly reduces false signals.
- Risk Control: Bollinger Bands' standard deviation calculation provides dynamic risk control.
- Visual Clarity: Strategy provides clear visual signals for easy understanding and execution.
- Flexible Parameters: Main parameters can be adjusted according to different market characteristics.
Strategy Risks
- Sideways Market Risk: May generate frequent false breakout signals in range-bound markets.
- Lag Risk: Moving averages and RSI indicators have inherent lag.
- Parameter Sensitivity: Different parameter settings may lead to significant variations in strategy performance.
- Market Environment Dependency: Performs better in trending markets, may underperform in ranging markets.
Strategy Optimization Directions
- Introduce Trend Filters: Add long-term moving averages or trend indicators to filter trading direction.
- Dynamic Parameter Adjustment: Automatically adjust Bollinger Bands and RSI parameters based on market volatility.
- Add Volume Confirmation: Incorporate volume analysis into the signal system.
- Optimize Stop Loss: Introduce dynamic stop-loss mechanisms like ATR stops or percentage trailing stops.
- Add Time Filters: Consider market time characteristics to avoid trading during unfavorable periods.
Summary
The strategy builds a relatively complete trading system through the combined application of Bollinger Bands and RSI. Its strength lies in its ability to adapt to market volatility and provide reliable trading signals, though market environment impact on strategy performance needs attention. Through the suggested optimization directions, the strategy's stability and reliability can be further enhanced. In practical application, traders are advised to adjust parameters according to specific market characteristics and combine with other technical analysis tools for trading decisions.
Source Pine Script
/*backtest
start: 2019-12-23 08:00:00
end: 2024-12-09 08:00:00
period: 1d
basePeriod: 1d
exchanges: [{"eid":"Futures_Binance","currency":"BTC_USDT"}]
*/

//@version=5
strategy("Bollinger Bands and RSI Strategy with Buy/Sell Signals", overlay=true)

// Input settings
bb_length = input.int(20, title="Bollinger Bands Length", minval=1)
bb_mult = input.float(2.0, title="Bollinger Bands Multiplier", minval=0.1)
rsi_length = input.int(14, title="RSI Length", minval=1)
rsi_overbought = input.int(70, title="RSI Overbought Level", minval=50)
rsi_oversold = input.int(30, title="RSI Oversold Level", minval=1)

// Bollinger Bands calculation
basis = ta.sma(close, bb_length)
dev = bb_mult * ta.stdev(close, bb_length)
upper_band = basis + dev
lower_band = basis - dev

// RSI calculation
rsi = ta.rsi(close, rsi_length)

// Buy signal: Price touches lower Bollinger Band and RSI is oversold
buy_signal = ta.crossover(close, lower_band) and rsi < rsi_oversold

// Sell signal: Price touches upper Bollinger Band and RSI is overbought
sell_signal = ta.crossunder(close, upper_band) and rsi > rsi_overbought

// Execute orders
if (buy_signal)
    strategy.entry("Buy", strategy.long)
if (sell_signal)
    strategy.close("Buy")

// Plotting Bollinger Bands and RSI
plot(upper_band, color=color.red, linewidth=2, title="Upper Band")
plot(lower_band, color=color.green, linewidth=2, title="Lower Band")
plot(basis, color=color.blue, linewidth=1, title="Middle Band")
hline(rsi_overbought, "Overbought", color=color.red, linestyle=hline.style_dashed)
hline(rsi_oversold, "Oversold", color=color.green, linestyle=hline.style_dashed)
plot(rsi, "RSI", color=color.orange)

// Add Buy/Sell signals on the chart
plotshape(series=buy_signal, title="Buy Signal", location=location.belowbar, color=color.green, style=shape.labelup, text="BUY")
plotshape(series=sell_signal, title="Sell Signal", location=location.abovebar, color=color.red, style=shape.labeldown, text="SELL")
Published by ChaoZhang on the FMZ strategy square · last modified 2024-12-11. Collected in the Quant Trading Vault. Unvalidated research: re-test with your own data and costs before trusting it.
Build this with AgenKit
A spec is not a trading system. Paste this into your coding agent and AgenKit runs a specialist team — architecture, test-first build, risk gates, review — with paper trading on by default.
/agenkit build a production-grade trading bot with a backtest engine, risk controls and paper trading by default from strategies/Bollinger-Bands-and-RSI-Combined-Dynamic-Trading-Strategy.md- npx agenkit install engineering-kit in your project
- Paste the command into your agent and approve each phase
- Get tests, backtest, risk controls and a paper-trading switch
Understand it first
Before you run this, read the lesson behind the idea and how to backtest it honestly. Specs like this one are the survivors of an unknown number of trials; deflate their results accordingly.
Related specs
- Enhanced Bollinger Breakout Quantitative Strategy with Momentum Filter Integration SystemPine Script · Breakout · 2d
- High Precision RSI and Bollinger Bands Breakout Strategy with Optimized Risk Reward RatioPine Script · Breakout · 1h
- Dynamic Range Breakout Trading Strategy Based on Bollinger Bands and RSIPine Script · Breakout · 1d
- RSI and Bollinger Bands Synergistic Swing Trading StrategyPine Script · Breakout · 1h
- Triple BB Bands Breakout with RSI StrategyPine Script · Breakout · 1h
- EMA and Bollinger Bands Breakout StrategyPine Script · Breakout · 1h