Strategy vault / Trend following
Bollinger Bands and RSI Crossover Trading Strategy
The Bollinger Bands and RSI Crossover Trading Strategy is a quantitative trading approach that combines technical analysis indicators. This strategy primarily utilizes Bollinger Bands and the Relative Strength Index…
Overview
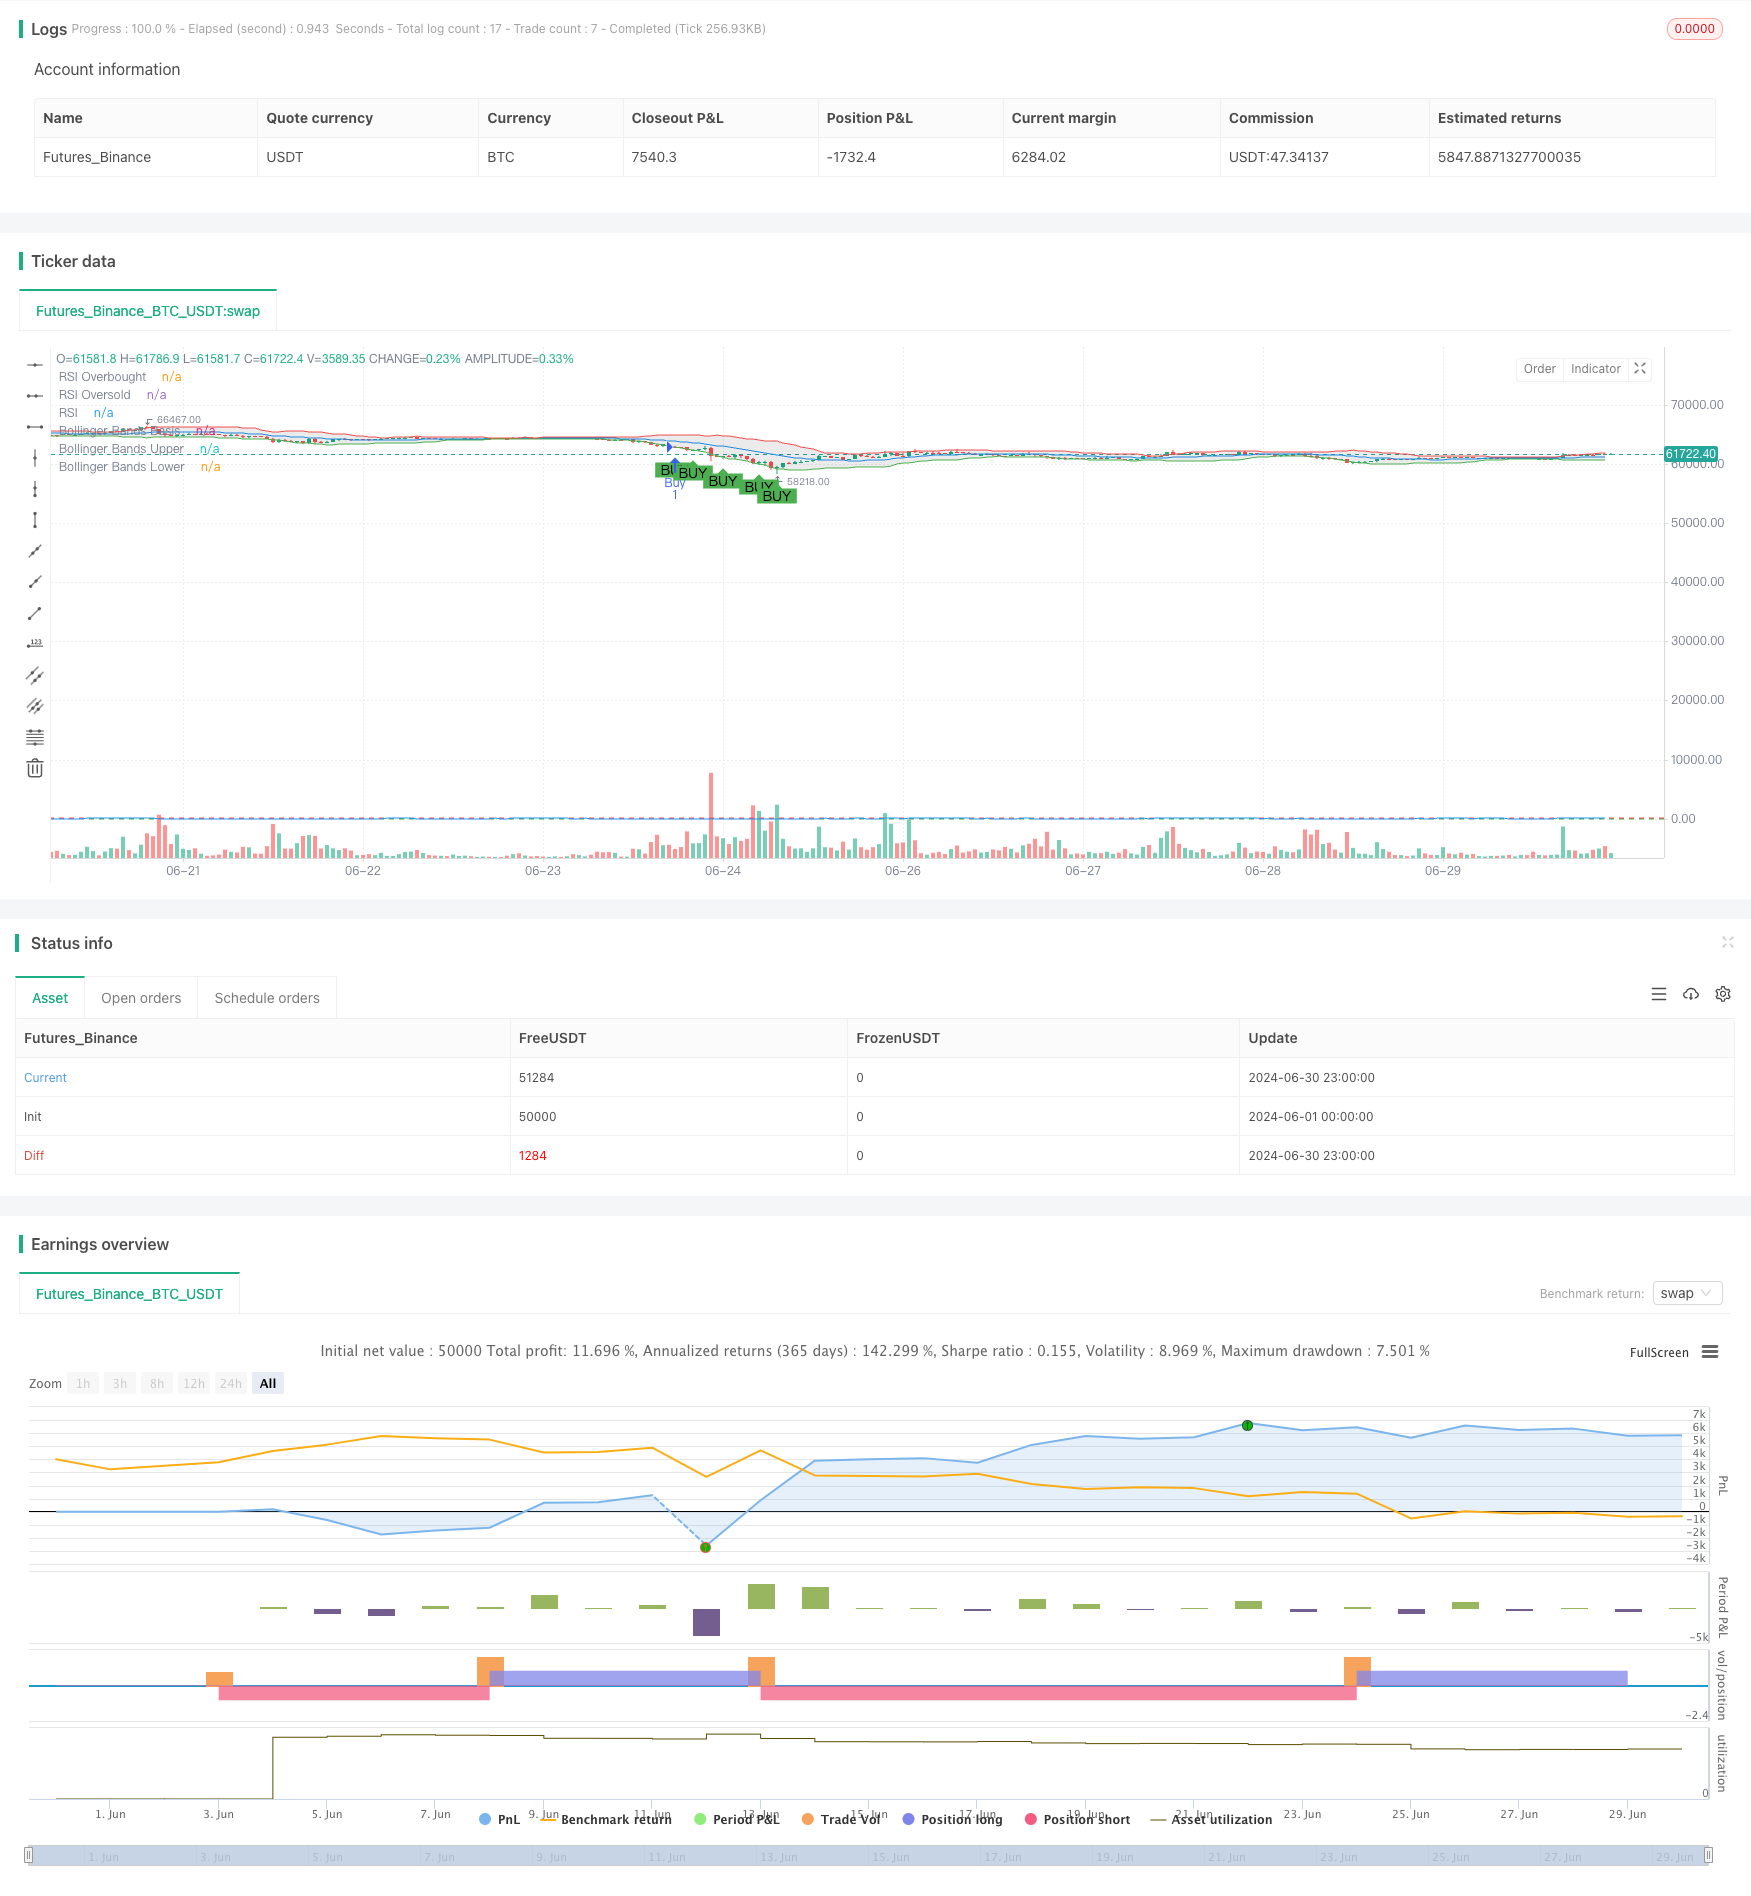
The Bollinger Bands and RSI Crossover Trading Strategy is a quantitative trading approach that combines technical analysis indicators. This strategy primarily utilizes Bollinger Bands and the Relative Strength Index (RSI) to generate trading signals. By monitoring price crossovers with Bollinger Bands and RSI overbought/oversold levels, the strategy aims to capture market reversal points and trend changes. This method seeks to identify potential buying and selling opportunities amidst market volatility while using the RSI indicator to confirm the reliability of signals.
Strategy Principles
Bollinger Bands Calculation:
- Uses a 20-day Simple Moving Average (SMA) as the middle band.
- Upper and lower bands are set at 2 standard deviations above and below the middle band.
RSI Calculation:
- Utilizes a 14-day period for RSI.
- Sets 70 as the overbought level and 30 as the oversold level.
Buy Signal Generation:
- When price crosses above the lower Bollinger Band from below.
- Simultaneously, RSI is below 30 (oversold condition).
Sell Signal Generation:
- When price crosses below the upper Bollinger Band from above.
- Simultaneously, RSI is above 70 (overbought condition).
Signal Visualization:
- Plots Bollinger Bands on the chart.
- Marks buy and sell signals at price breakout points.
Trade Execution:
- Automatically executes buy and sell operations based on generated signals.
Strategy Advantages
Multi-Indicator Integration: By combining Bollinger Bands and RSI, the strategy provides a more comprehensive market analysis, reducing false signals.
Trend and Reversal Capture: Bollinger Bands help identify price trends, while RSI assists in confirming potential reversal points.
Risk Management: Using Bollinger Bands as dynamic support and resistance levels aids in risk control.
High Adaptability: Bollinger Bands automatically adjust to market volatility, allowing the strategy to adapt to different market environments.
Visual Assistance: By visually displaying signals on the chart, traders can quickly understand market dynamics.
Automated Execution: The strategy can automatically generate and execute trade signals, reducing human intervention and emotional influence.
Strategy Risks
False Breakout Risk: Markets may experience brief breakouts of Bollinger Bands followed by retracements, leading to false signals.
Underperformance in Trending Markets: In strong trend markets, the strategy may frequently generate contrary signals, resulting in losses.
Parameter Sensitivity: Strategy performance is highly dependent on Bollinger Bands and RSI parameter settings, which may require different optimizations for various markets.
Lagging Nature: As lagging indicators, Bollinger Bands and RSI may not capture rapid market changes in a timely manner.
Overtrading: In highly volatile markets, the strategy may produce excessive trading signals, increasing transaction costs.
Market Noise: In range-bound markets or low volatility periods, the strategy may be affected by market noise, generating erroneous signals.
Strategy Optimization Directions
Dynamic Parameter Adjustment:
- Implement adaptive adjustment of Bollinger Bands period and multiplier.
- Dynamically adjust RSI overbought/oversold thresholds based on market volatility.
Add Trend Filters:
- Introduce long-term moving averages or ADX indicator to assess market trends.
- Suppress counter-trend trading signals during strong trends.
Integrate Volume Analysis:
- Incorporate volume indicators into the signal confirmation process.
- Require increased volume during breakouts to enhance signal reliability.
Optimize Stop-Loss and Profit-Taking Strategies:
- Implement dynamic stop-loss based on ATR.
- Design a tiered profit-taking mechanism.
Introduce Time Filtering:
- Analyze strategy performance during different time periods.
- Execute trades only during the most effective time frames.
Multi-Timeframe Analysis:
- Combine signals from longer and shorter time periods.
- Enhance signal reliability through multi-timeframe confirmation.
Conclusion
The Bollinger Bands and RSI Crossover Trading Strategy is a quantitative trading method that combines technical analysis tools. By simultaneously leveraging the trend-following characteristics of Bollinger Bands and the overbought/oversold indications of RSI, this strategy aims to capture significant market turning points. While this approach has advantages in identifying potential trading opportunities, it also faces challenges such as false breakouts and parameter sensitivity. To enhance the strategy's robustness and adaptability, considerations can be made to introduce dynamic parameter adjustments, trend filters, and multi-timeframe analysis. Overall, this strategy framework is worthy of further research and optimization, with the potential to generate consistent trading results across various market conditions.
Source Pine Script
//@version=5
strategy("Bollinger Bands and RSI Strategy", overlay=true)

// Define Bollinger Bands parameters
length = input(20, title="Bollinger Bands Length")
src = close
mult = input(2.0, title="Bollinger Bands Multiplier")
basis = ta.sma(src, length)
dev = mult * ta.stdev(src, length)
upper = basis + dev
lower = basis - dev

// Define RSI parameters
rsiLength = input(14, title="RSI Length")
rsiOverbought = input(70, title="RSI Overbought Level")
rsiOversold = input(30, title="RSI Oversold Level")
rsi = ta.rsi(close, rsiLength)

// Generate Buy Signal
buySignal = ta.crossover(close, lower) and rsi < rsiOversold

// Generate Sell Signal
sellSignal = ta.crossunder(close, upper) and rsi > rsiOverbought

// Plot Bollinger Bands on Chart
plot(basis, color=color.blue, title="Bollinger Bands Basis")
p1 = plot(upper, color=color.red, title="Bollinger Bands Upper")
p2 = plot(lower, color=color.green, title="Bollinger Bands Lower")
fill(p1, p2, color=color.rgb(0, 0, 0, 90))

// Plot Buy and Sell Signals on Chart
plotshape(series=buySignal, location=location.belowbar, color=color.green, style=shape.labelup, text="BUY")
plotshape(series=sellSignal, location=location.abovebar, color=color.red, style=shape.labeldown, text="SELL")

// Execute Buy and Sell Orders
if (buySignal)
    strategy.entry("Buy", strategy.long)
if (sellSignal)
    strategy.entry("Sell", strategy.short)

// Plot RSI on separate chart
hline(rsiOverbought, "RSI Overbought", color=color.red)
hline(rsiOversold, "RSI Oversold", color=color.green)
plot(rsi, color=color.blue, title="RSI")
Published by ChaoZhang on the FMZ strategy square · last modified 2024-07-26. Collected in the Quant Trading Vault. Unvalidated research: re-test with your own data and costs before trusting it.
Build this with AgenKit
A spec is not a trading system. Paste this into your coding agent and AgenKit runs a specialist team — architecture, test-first build, risk gates, review — with paper trading on by default.
/agenkit build a production-grade trading bot with a backtest engine, risk controls and paper trading by default from strategies/Bollinger-Bands-and-RSI-Crossover-Trading-Strategy.md- npx agenkit install engineering-kit in your project
- Paste the command into your agent and approve each phase
- Get tests, backtest, risk controls and a paper-trading switch
Understand it first
Before you run this, read the lesson behind the idea and how to backtest it honestly. Specs like this one are the survivors of an unknown number of trials; deflate their results accordingly.
Related specs
- Going with the Trend Moving Average Crossover StrategyPine Script · Trend following · 1d
- Concise Dynamic Trend StrategyPine Script · Trend following · 2h
- Price Drop Buy Strategy in Downtrend with Stop LossPine Script · Trend following · 30m
- Bollinger Bands RSI Multi MA Trend StrategyPine Script · Trend following · 1d
- Dynamic Risk Managed EMA Crossover with Bollinger Bands StrategyPine Script · Trend following · 1d
- EMA bands Leledc Bollinger bands trend following strategyPine Script · Trend following · 2h