Strategy vault / Mean reversion
Bollinger Bands and RSI Short Selling Strategy
The Bollinger Bands and RSI short selling strategy is a short-term trading strategy based on Bollinger Bands and Relative Strength Index (RSI). It combines Bollinger Bands to gauge whether the market is overheated…
Overview
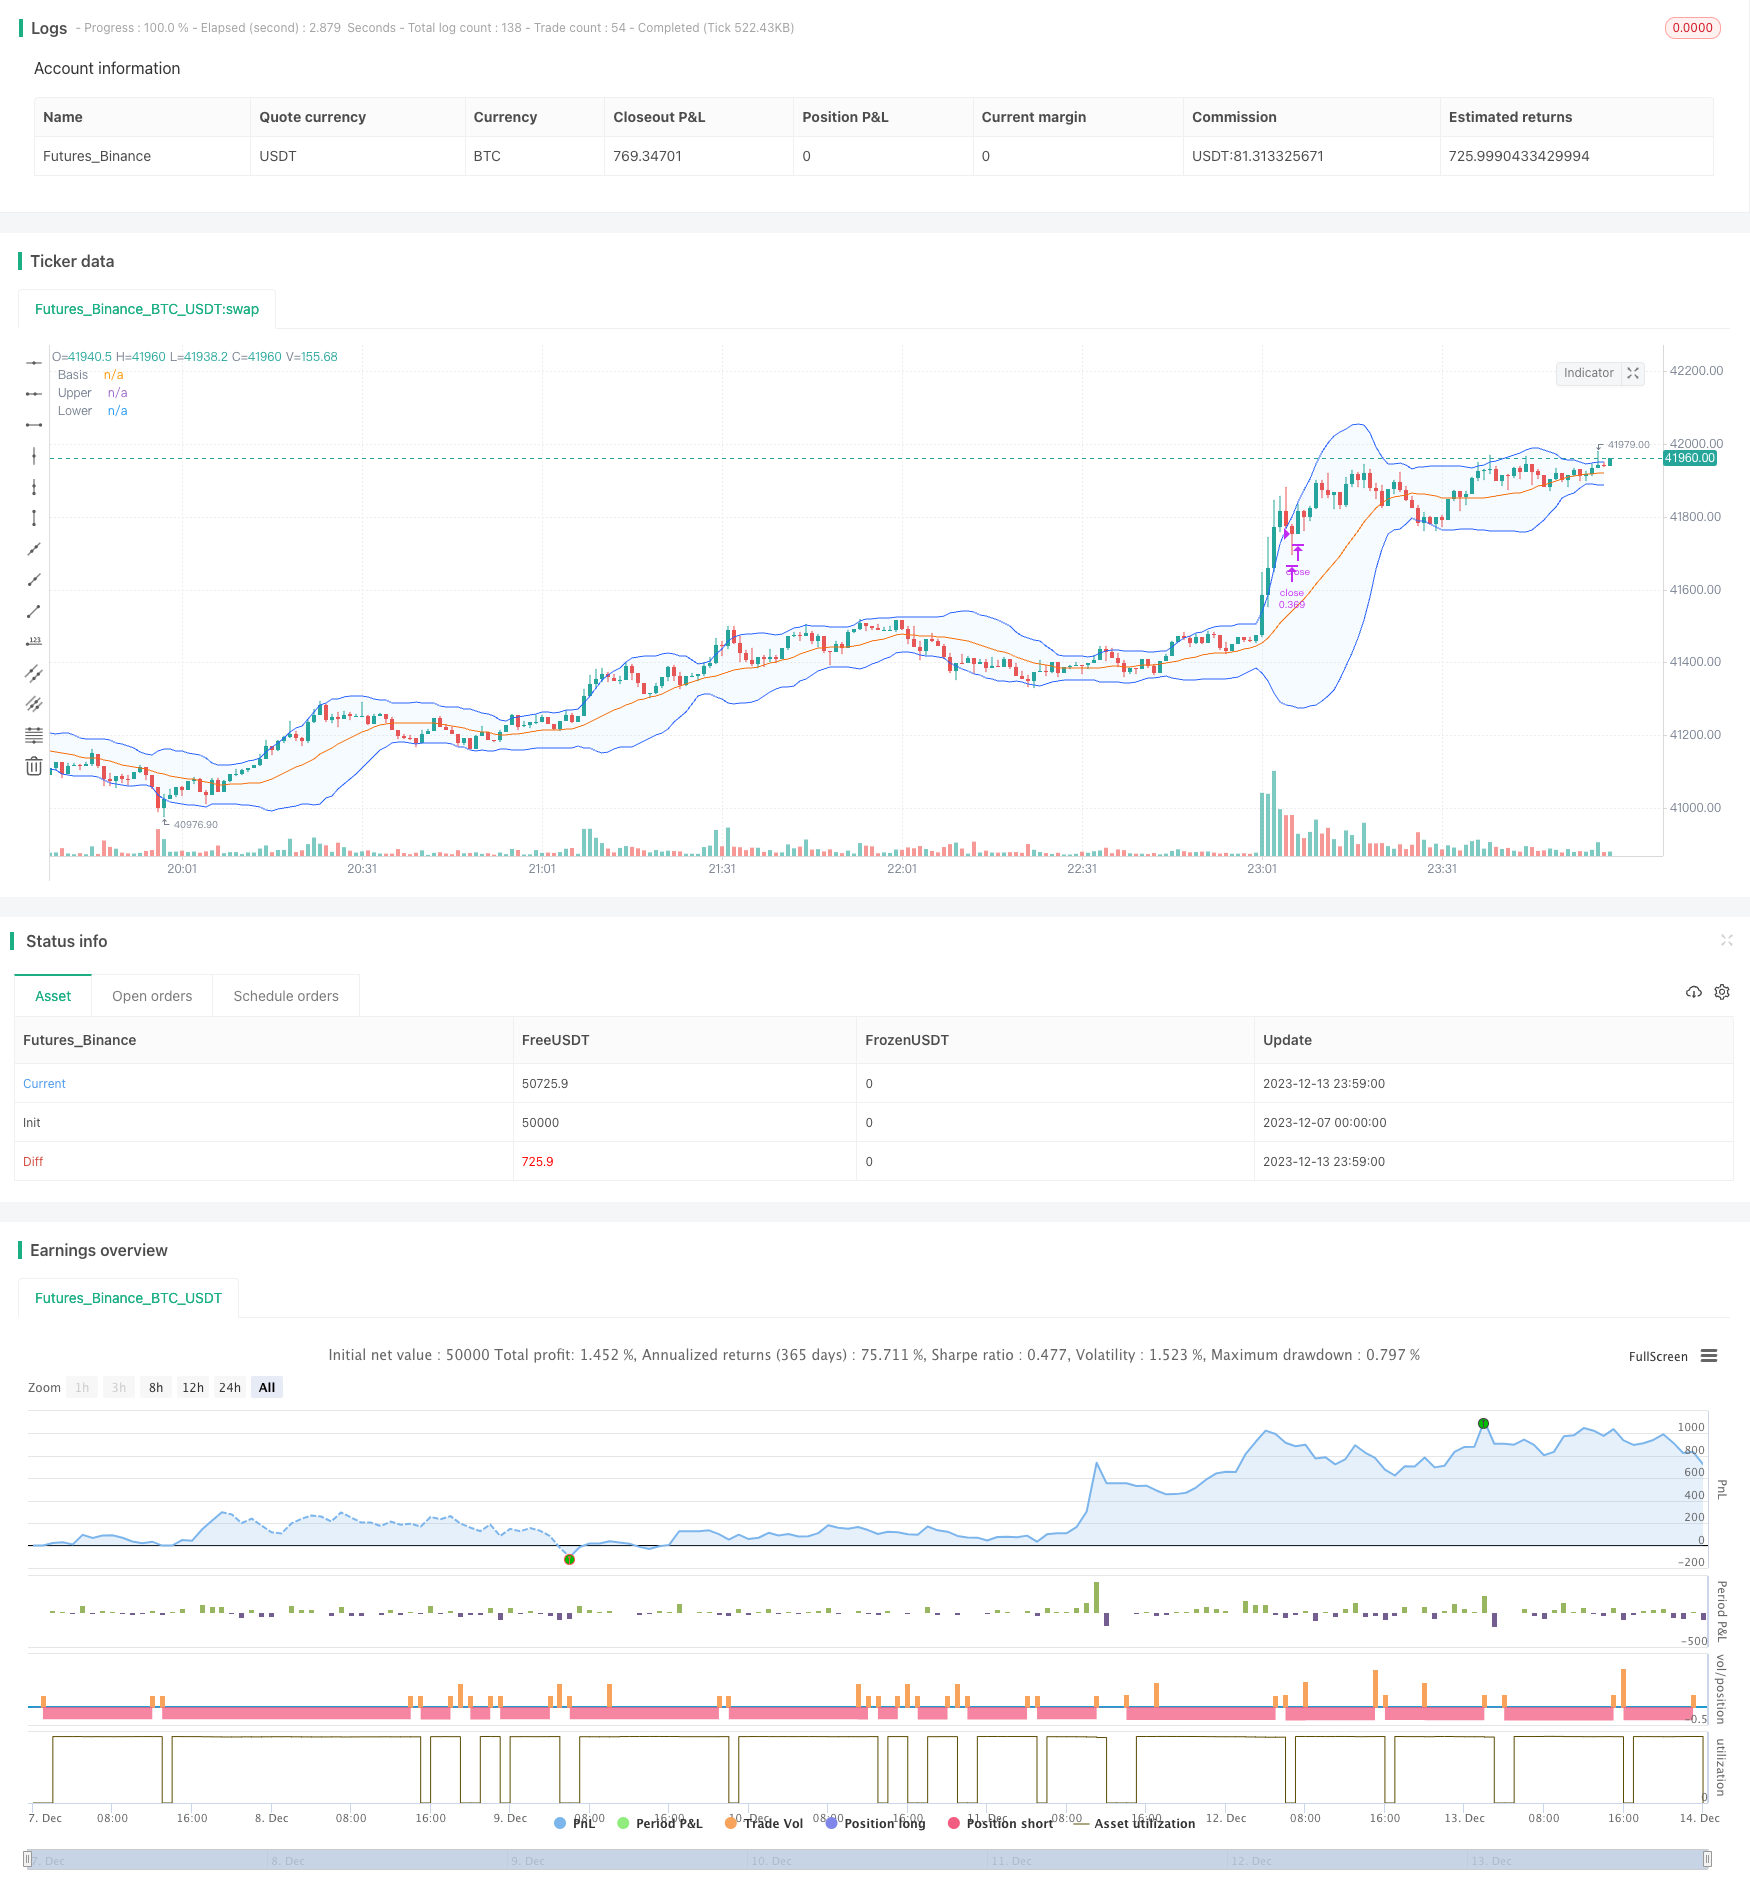
The Bollinger Bands and RSI short selling strategy is a short-term trading strategy based on Bollinger Bands and Relative Strength Index (RSI). It combines Bollinger Bands to gauge whether the market is overheated and RSI to determine the momentum of the market, to identify short selling opportunities. It goes short when the price breaks above the Bollinger upper band and RSI is greater than 70, indicating the market is overheated. It closes position when the Bollinger lower band breaks above the price, signaling a market reversal.
Strategy Logic
The strategy relies on two main indicators:
Bollinger Bands. Bollinger Bands consist of a middle band, an upper band and a lower band. The middle band is the n-day moving average. The upper and lower bands are n standard deviations above and below the middle band. When price bounces from the lower band to the upper band, the market is considered overheated. When price falls back from the upper band to the lower band, the market has cooled off.
RSI. RSI compares the average gain and loss over a period, to determine the strength of uptrends and downtrends. When RSI is above 70, it signals that the price is overheated. When RSI is below 30, it signals the price is oversold.
The specific trading logic is:
When price breaks above the Bollinger upper band and RSI is greater than 70, it triggers the Bollinger overheat signal and RSI overbought signal, thus goes short.
When price breaks below the Bollinger lower band, the market reverses colder, thus the position is closed.
The strategy also sets a stop loss and take profit:
Stop loss is set at entry price * (1+1%), i.e. withstanding 1% loss.
Take profit is set at entry price * (1-7%), i.e. taking 7% profit then closing position.
Advantages
The strategy has the following advantages:
Combines Bollinger Bands and RSI, avoids the probability of misjudgment from a single indicator.
Utilizes Bollinger Bands bands and RSI overbought-oversold areas to determine precise entry and exit timing for short-term trades.
Sets stop loss and take profit pre-entry to control risks.
Simple and clear logic, easy to understand and implement.
Flexible Bollinger Bands and RSI parameters adjustable to different periods and market environments.
Risks
Despite the advantages, the strategy has some risks to mitigate:
Both Bollinger Bands and RSI are trend following indicators, not suitable for ranging or directionless markets.
Cannot guarantee stop loss and take profit will always be triggered perfectly.
Extreme market moves could penetrate stop loss and cause above-expectation losses.
Requires constant parameter tuning of indicators to adapt to changing markets.
Corresponding risk management methods:
Incorporate baseline indicators like moving averages to determine local trend, avoiding unnecessary whipsaws.
Lower position sizing, diversify across strategies, to spread out risks.
Expand stop loss percentage or set super stops to withstand extreme market moves.
Continuously adjust parameters based on live testing results.
Optimization Opportunities
Several aspects could be considered to further optimize the strategy:
Incorporate other indicators to avoid unnecessary whipsaws, e.g. EMA, MACD.
Test for optimal parameters across different products and timeframes, e.g. 15m, 30m, 1h on leading cryptocurrencies and stocks.
Implement dynamic stops, adjusting stop level based on real-time market volatility, to smooth risk of stop runs.
Consider optimizing via machine learning algorithms to automatically discover optimal parameters or more complex patterns.
Conclusion
The short-term strategy first identifies optimal short sale timing through gauging market temperature and momentum with Bollinger Bands and RSI. It then controls risk with stop loss and take profit. Its advantage lies in simplicity and ease of implementation. Main risks stem from indicator limitations and stop runs. Solutions include incorporating more indicators, dynamically tuning parameters and allowing wider stops. Much room remains for optimization via introducing more indicators and computational enhancements.
Parameters
| Name | Default | What it controls |
|---|---|---|
| v_input_int_1 | 20 | length |
| v_input_1_close | 0 | Source: close | high | low | open | hl2 | hlc3 | hlcc4 | ohlc4 |
| v_input_float_1 | 2 | StdDev |
| v_input_int_2 | false | Offset |
| v_input_2 | 30 | oversold |
| v_input_3 | true | v_input_3 |
| v_input_4 | 7 | v_input_4 |
Source Pine Script
/*backtest
start: 2023-12-07 00:00:00
end: 2023-12-14 00:00:00
period: 1m
basePeriod: 1m
exchanges: [{"eid":"Futures_Binance","currency":"BTC_USDT"}]
*/

// This source code is subject to the terms of the Mozilla Public License 2.0 at https://mozilla.org/MPL/2.0/
// © Coinrule
// Works best on 30m, 45m timeframe

//@version=5
strategy("Bollinger Bands and RSI Short Selling",
         overlay=true,
         initial_capital = 1000,
         default_qty_value = 30,
         default_qty_type = strategy.percent_of_equity,
         commission_type=strategy.commission.percent,
         commission_value=0.1)

//Backtest period
timePeriod = time >= timestamp(syminfo.timezone, 2021, 12, 1, 0, 0)
notInTrade = strategy.position_size <= 0

//Bollinger Bands Indicator
length = input.int(20, minval=1)
src = input(close, title="Source")
mult = input.float(2.0, minval=0.001, maxval=50, title="StdDev")
basis = ta.sma(src, length)
dev = mult * ta.stdev(src, length)
upper = basis + dev
lower = basis - dev
offset = input.int(0, "Offset", minval = -500, maxval = 500)
plot(basis, "Basis", color=#FF6D00, offset = offset)
p1 = plot(upper, "Upper", color=#2962FF, offset = offset)
p2 = plot(lower, "Lower", color=#2962FF, offset = offset)
fill(p1, p2, title = "Background", color=color.rgb(33, 150, 243, 95))


// RSI inputs and calculations
lengthRSI = 14
RSI = ta.rsi(close, lengthRSI)
oversold= input(30)


//Stop Loss and Take Profit for Shorting
Stop_loss= ((input (1))/100)
Take_profit= ((input (7)/100))

shortStopPrice  = strategy.position_avg_price * (1 + Stop_loss)
shortTakeProfit = strategy.position_avg_price * (1 - Take_profit)

//Entry and Exit
strategy.entry(id="short", direction=strategy.short, when=ta.crossover(close, upper) and RSI < 70 and timePeriod and notInTrade)

if (ta.crossover(upper, close) and RSI > 70 and timePeriod)
    strategy.exit(id='close', stop = shortTakeProfit, limit = shortStopPrice)
Published by ChaoZhang on the FMZ strategy square · last modified 2023-12-15. Collected in the Quant Trading Vault. Unvalidated research: re-test with your own data and costs before trusting it.
Build this with AgenKit
A spec is not a trading system. Paste this into your coding agent and AgenKit runs a specialist team — architecture, test-first build, risk gates, review — with paper trading on by default.
/agenkit build a production-grade trading bot with a backtest engine, risk controls and paper trading by default from strategies/Bollinger-Bands-and-RSI-Short-Selling-Strategy.md- npx agenkit install engineering-kit in your project
- Paste the command into your agent and approve each phase
- Get tests, backtest, risk controls and a paper-trading switch
Understand it first
Before you run this, read the lesson behind the idea and how to backtest it honestly. Specs like this one are the survivors of an unknown number of trials; deflate their results accordingly.
Related specs
- Advanced 15 Minute Chart Trading Signal StrategyPine Script · Mean reversion · 3h
- Advanced Quantitative Trading Strategy Combining RSI Divergence and Moving AveragesPine Script · Mean reversion · 1h
- Bollinger Bands Stochastic RSI Extreme Strategy BBSR Extreme StrategyPine Script · Mean reversion · 1h
- Dual Moving Average RSI Synergy Options Quantitative Trading StrategyPine Script · Mean reversion · 1h
- Gods Bollinger Bands RSI Trading StrategyPine Script · Mean reversion · 1d
- Multi Indicator Reversal Point Capture Trading StrategyPine Script · Mean reversion · 1d