Strategy vault / Trend following
Bollinger Bands and Stochastic KD Crossover Strategy
This strategy combines two technical indicators, Bollinger Bands and Stochastic KD, to determine entry and exit points. It aims to capture the rebound after the market is oversold while controlling the drawdown risk…
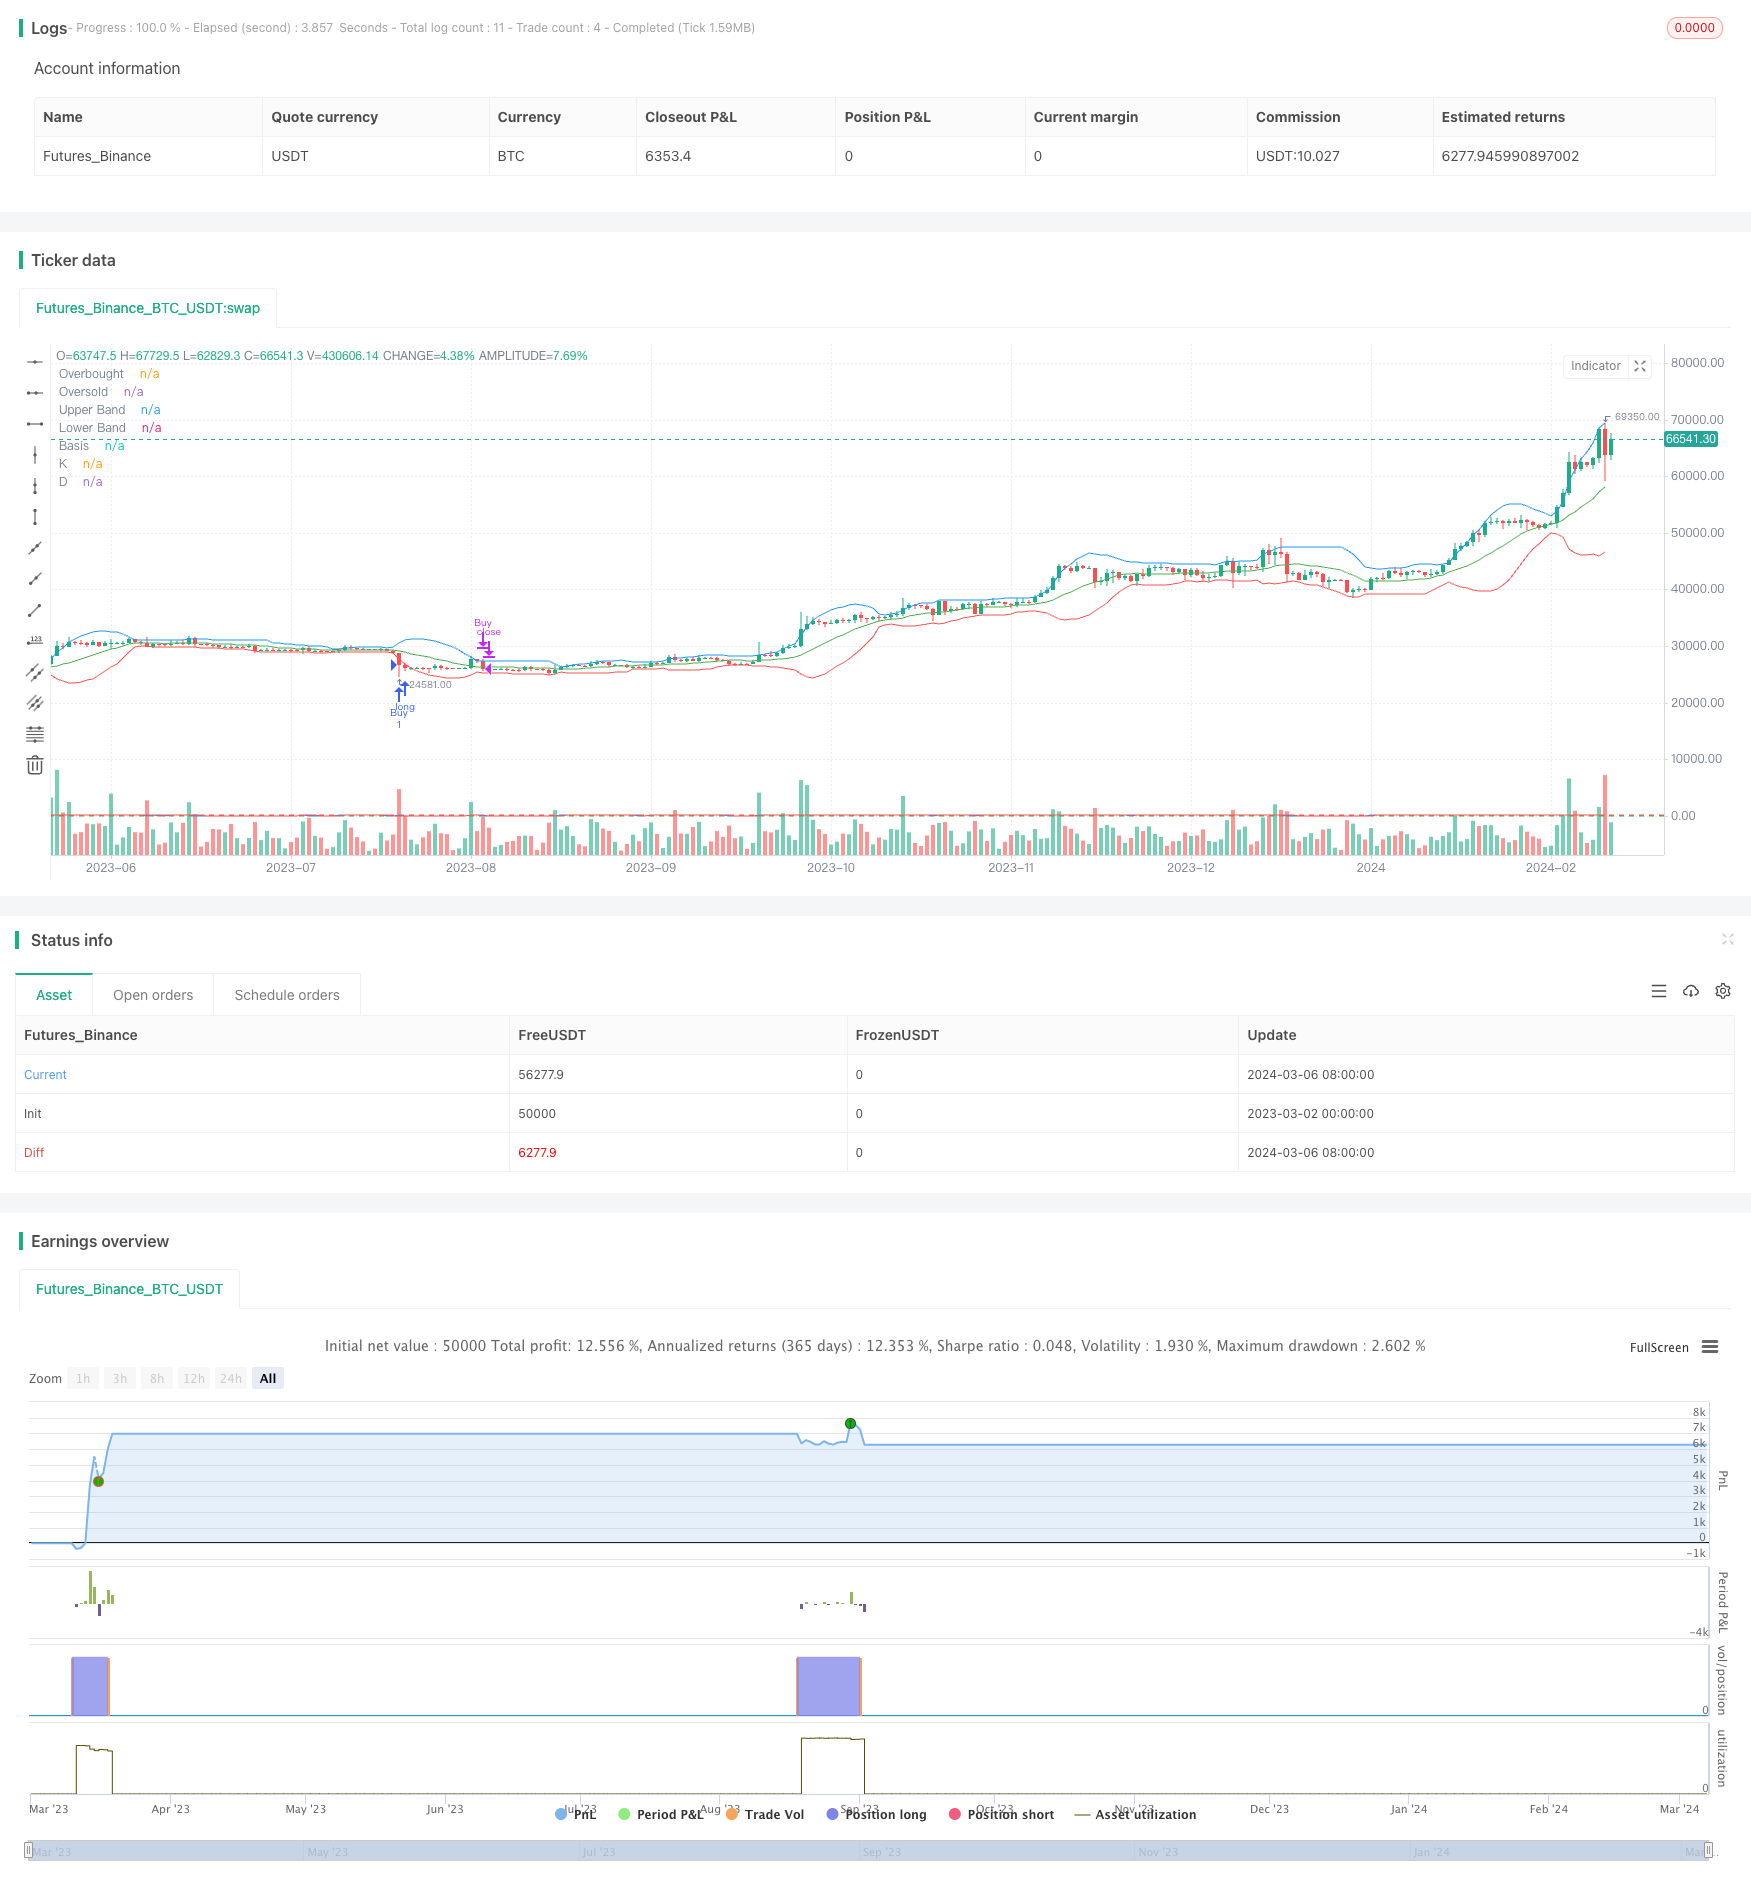
Overview
This strategy combines two technical indicators, Bollinger Bands and Stochastic KD, to determine entry and exit points. It aims to capture the rebound after the market is oversold while controlling the drawdown risk. The strategy enters a long position when the closing price breaks below the lower Bollinger Band and the Stochastic KD lines cross bullishly (K line crosses above D line). It closes the position when the closing price either breaks below the middle Bollinger Band or breaks above the upper Bollinger Band.
Strategy Principles
Calculate Bollinger Bands: Use the simple moving average of price as the middle band, and the upper and lower bands are calculated by adding and subtracting a fixed multiple of the price standard deviation from the middle band.
Calculate Stochastic KD: The K value represents the relative position of the current closing price within the range of the highest and lowest prices over the past N periods. The D value is the M-day simple moving average of the K value.
Entry condition: When the current closing price breaks below the lower Bollinger Band and the Stochastic KD lines cross bullishly (K line crosses above D line), the strategy enters a long position.
Exit condition: When the current closing price either breaks below the middle Bollinger Band or breaks above the upper Bollinger Band, the strategy closes the position.
By using Bollinger Bands to determine if the price is at a relatively low level and confirming the reversal signal with the Stochastic KD bullish crossover, the strategy seeks to capture the entry point. When the price returns to the vicinity of the middle Bollinger Band or becomes overbought and reaches the upper band, the strategy promptly exits to control risk and lock in profits.
Advantages
By combining price and momentum indicators, the strategy can effectively capture the rebound after oversold conditions.
Bollinger Bands dynamically depict the relative high and low levels of price, which is more objective and effective compared to fixed thresholds.
The Stochastic KD indicator reflects the overbought and oversold status of the price and its momentum changes, complementing the Bollinger Bands.
Clear stop-loss and take-profit levels are set to control the risk exposure of each trade.
Parameters are adjustable, making the strategy suitable for different markets and timeframes.
Risks
The strategy may underperform in range-bound markets or when the trend is unclear, requiring additional trend-detecting indicators for discernment.
The Stochastic KD indicator may occasionally give false signals, necessitating further confirmation using other methods.
The selection of parameters for Bollinger Bands and Stochastic KD needs to be optimized through backtesting. Inappropriate parameters may lead to premature stop-losses or prolonged holding periods.
The strategy lacks consideration for position sizing and money management, limiting its ability to control drawdowns.
Optimization Directions
Introduce trend-following indicators such as moving averages and only apply the strategy when the trend is clear.
Perform secondary confirmation on the Stochastic KD bullish crossover signal, such as checking if the K value is in the low range.
Optimize the parameters of Bollinger Bands and Stochastic KD to find the best combination.
Incorporate position sizing and money management modules into the strategy, such as using the Kelly Criterion to calculate position size and setting overall stop-loss levels.
Perform parameter optimization and backtesting for different markets and timeframes separately to improve the strategy's adaptability.
Conclusion
This article introduces a trading strategy based on Bollinger Bands and Stochastic KD. The strategy determines entry and exit points by comparing the price's position relative to the Bollinger Bands and the crossover signals of the Stochastic KD, aiming to capture the rebound after oversold conditions while controlling drawdown risk. The strategy's advantages lie in its ability to dynamically depict the relative high and low levels of price and make decisions based on the overbought and oversold status of the price, providing clear and complementary signals. However, the strategy also has certain limitations, such as underperforming in range-bound markets, the possibility of false signals from Stochastic KD, and lack of position sizing, among others. In the future, the strategy can be refined in terms of trend identification, signal confirmation, parameter optimization, and money management to improve its adaptability and robustness. Overall, the strategy provides an idea of combining Bollinger Bands and Stochastic KD, but it needs to be adjusted and optimized according to specific market characteristics and risk preferences when applied to real trading.
Parameters
| Name | Default | What it controls |
|---|---|---|
| v_input_1 | 14 | Bollinger Bands Length |
| v_input_2 | 2 | Bollinger Bands Multiplier |
| v_input_3 | 14 | KD Length |
| v_input_4 | 3 | KD Smooth |
| v_input_5 | 3 | KD D |
Source Pine Script
/*backtest
start: 2023-03-02 00:00:00
end: 2024-03-07 00:00:00
period: 1d
basePeriod: 1h
exchanges: [{"eid":"Futures_Binance","currency":"BTC_USDT"}]
*/

//@version=5
strategy("Bollinger Bands and KD Strategy with Take Profit", overlay=true)

// Input parameters
length = input(14, title="Bollinger Bands Length")
mult = input(2, title="Bollinger Bands Multiplier")
kdLength = input(14, title="KD Length")
kdSmooth = input(3, title="KD Smooth")
kdD = input(3, title="KD D")

// Calculate Bollinger Bands
basis = ta.sma(close, length)
upper_band = basis + mult * ta.stdev(close, length)
lower_band = basis - mult * ta.stdev(close, length)

// CalculateKDIndicator
k = ta.stoch(close, high, low, kdLength)
d = ta.sma(k, kdSmooth)  // UsesmaCalculateKD D

// Conditions for determining entry and exit points
price_below_lower_band = close < lower_band
cross_above_kd = ta.crossover(k, d)
price_above_upper_band = close > upper_band
cross_below_basis = ta.crossunder(close, basis)

// Strategy Entry/Exit Point
if (price_below_lower_band and cross_above_kd)
    strategy.entry("Buy", strategy.long)
if (cross_below_basis or price_above_upper_band)
    strategy.close("Buy")

// Draw Bollinger Bands
plot(upper_band, color=color.blue, title="Upper Band")
plot(lower_band, color=color.red, title="Lower Band")
plot(basis, color=color.green, title="Basis")

// DrawKDIndicator
hline(80, "Overbought", color=color.red)
hline(20, "Oversold", color=color.green)
plot(k, color=color.blue, title="K")
plot(d, color=color.red, title="D")
Published by ChaoZhang on the FMZ strategy square · last modified 2024-03-08. Collected in the Quant Trading Vault. Unvalidated research: re-test with your own data and costs before trusting it.
Build this with AgenKit
A spec is not a trading system. Paste this into your coding agent and AgenKit runs a specialist team — architecture, test-first build, risk gates, review — with paper trading on by default.
/agenkit build a production-grade trading bot with a backtest engine, risk controls and paper trading by default from strategies/Bollinger-Bands-and-Stochastic-KD-Crossover-Strategy.md- npx agenkit install engineering-kit in your project
- Paste the command into your agent and approve each phase
- Get tests, backtest, risk controls and a paper-trading switch
Understand it first
Before you run this, read the lesson behind the idea and how to backtest it honestly. Specs like this one are the survivors of an unknown number of trials; deflate their results accordingly.
Related specs
- Multi Indicator Trend Divergence Quantitative Trading StrategyPine Script · Trend following · 1d
- Multi Technical Indicator Moving Average Crossover Trend Following Quantitative Trading StrategyPine Script · Trend following · 1h
- Quantitative Trend Tracking Strategy Based on Multiple Technical IndicatorsPine Script · Trend following · 1m
- Triple SuperTrend Quantitative Trading StrategyPine Script · Trend following · 1d
- Enhanced Moving Average Crossover Sakkoulas Trading StrategyPine Script · Trend following · 1h
- Trend Following Strategy Based on Multiple IndicatorsPine Script · Trend following · 2h