Strategy vault / Machine learning
Bollinger Bands ATR Trailing Stop Strategy
This strategy combines the Bollinger Bands indicator and the Average True Range (ATR) indicator to form a breakout trading strategy with a trailing stop loss function. Trading signals are generated when prices break…
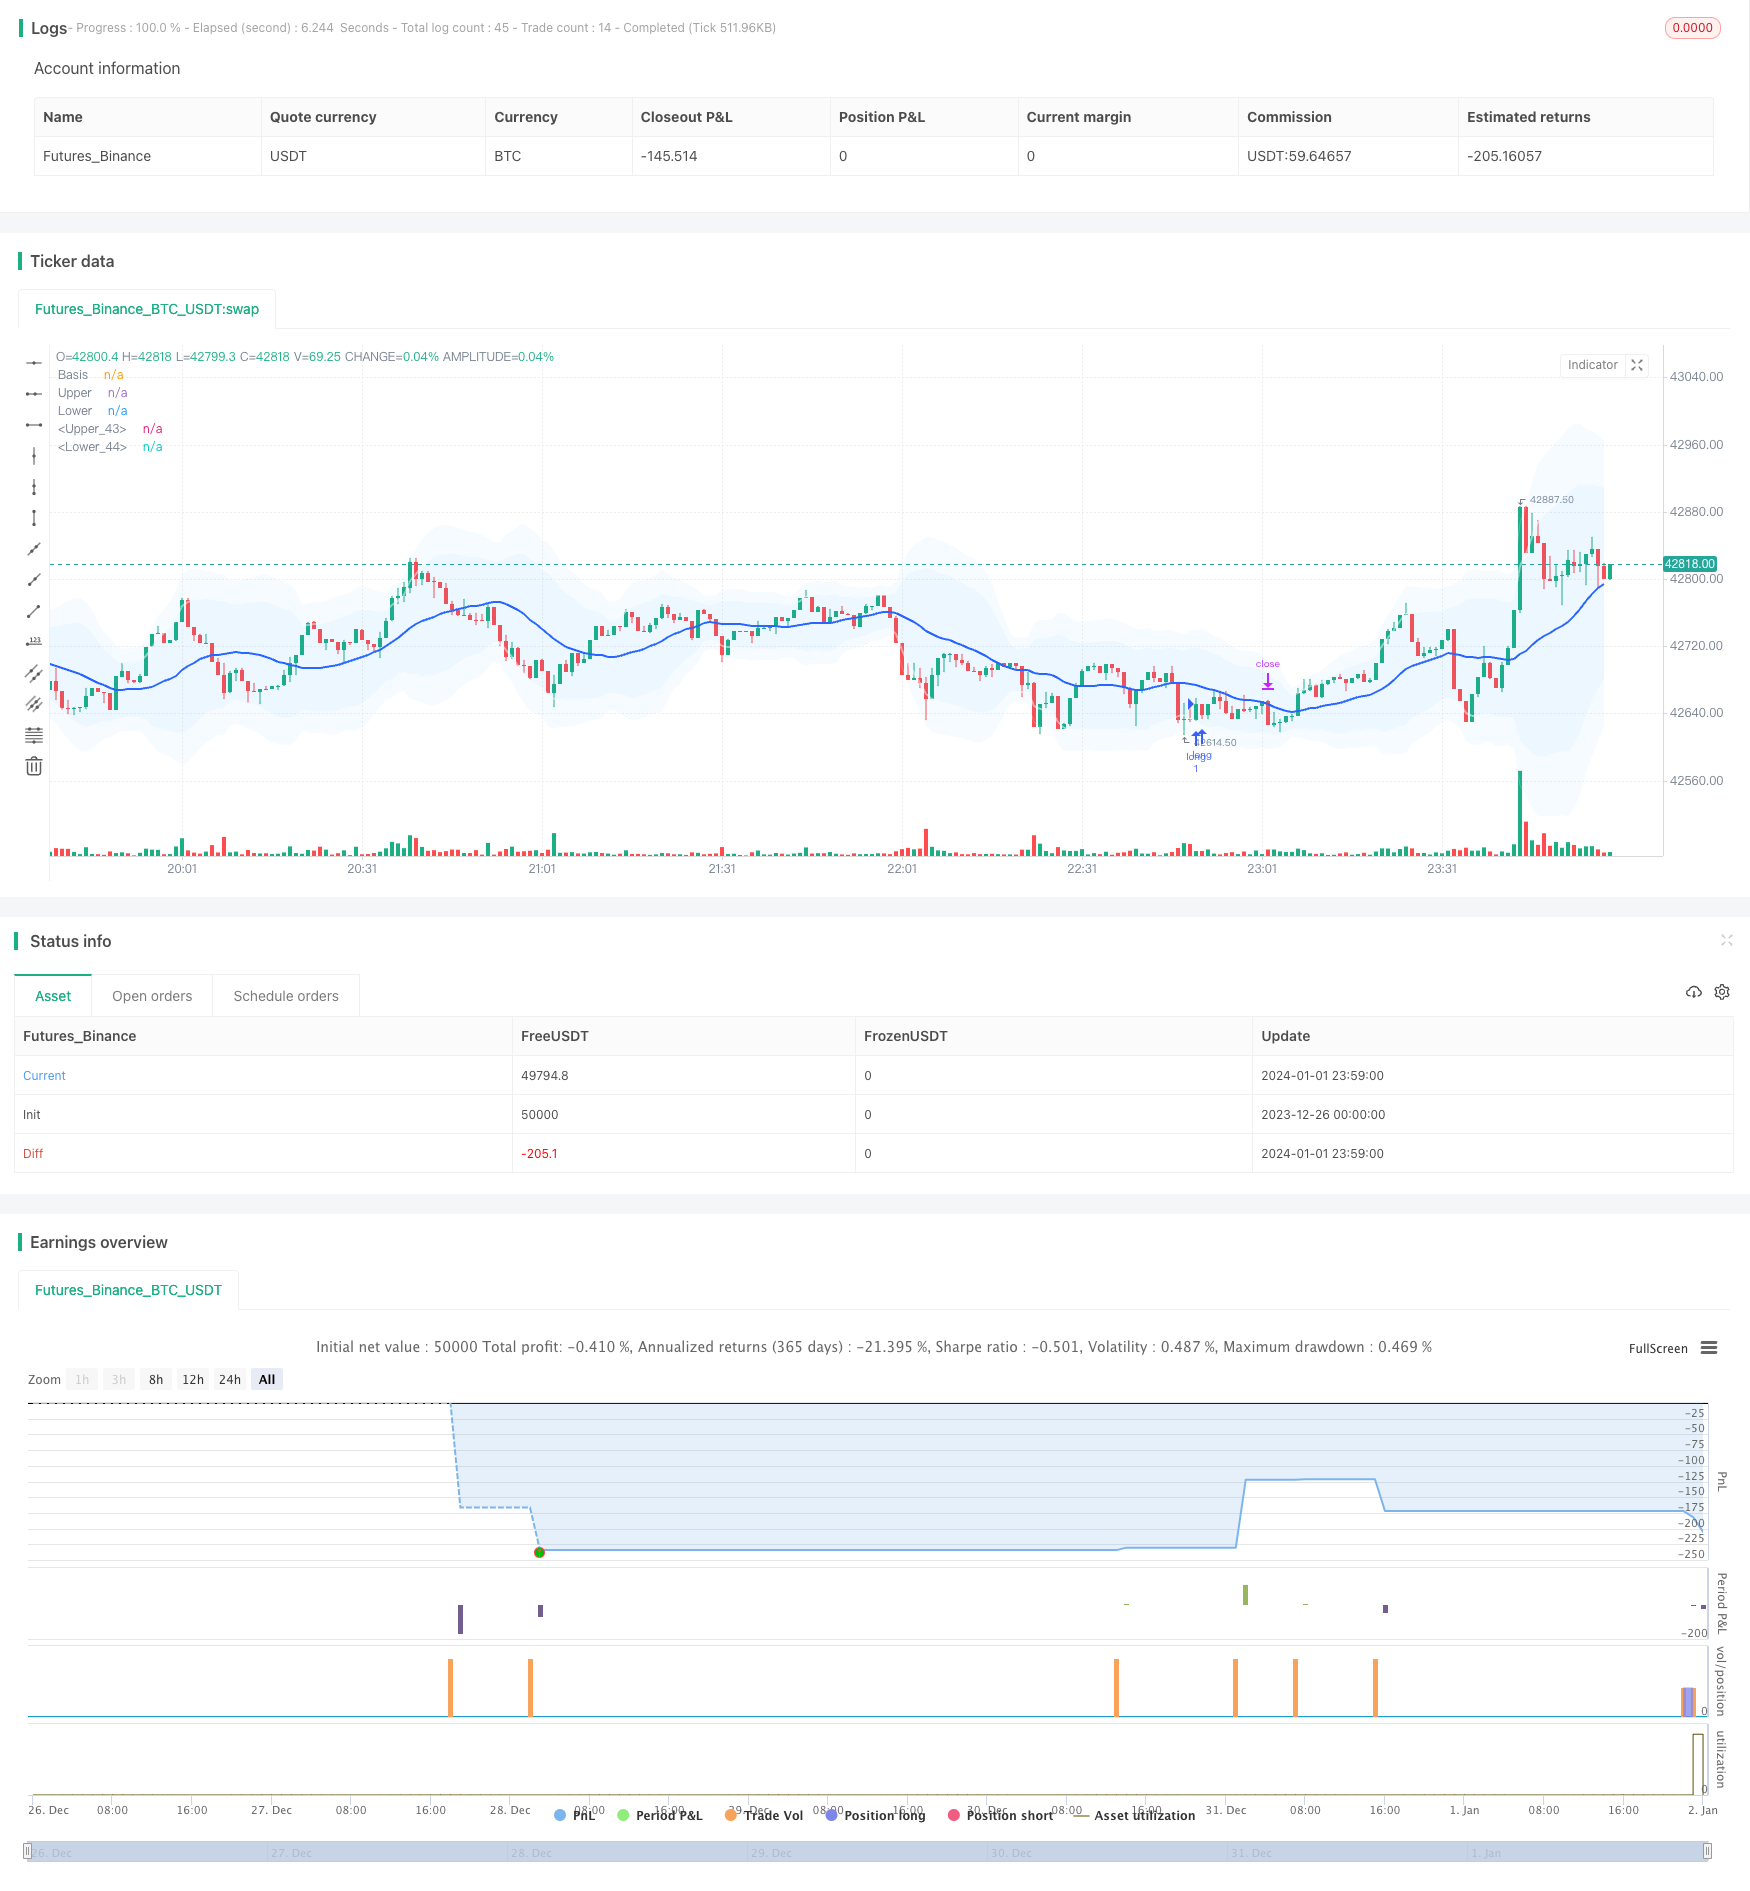
Overview
This strategy combines the Bollinger Bands indicator and the Average True Range (ATR) indicator to form a breakout trading strategy with a trailing stop loss function. Trading signals are generated when prices break through the Bollinger bands of specified standard deviations. At the same time, the ATR indicator is used to calculate stop loss and take profit to control the risk/reward ratio. In addition, the strategy also has features like time filter and parameter optimization.
Strategy Logic
Step 1, Calculate the middle band, upper band and lower band. The middle band is the simple moving average (SMA) of price, and the upper and lower bands are multiples of price standard deviation. When price breaks out upwards from the lower band, go long. When price breaks downwards from upper band, go short.
Step 2, Calculate the ATR indicator. The ATR indicator reflects the average volatility of price. According to the ATR value, set the stop loss for long positions and short positions. At the same time, set the take profit position based on ATR value to control risk/reward ratio.
Step 3, Use time filter to trade only in specified time period to avoid drastic fluctuations from major news events.
Step 4, Trailing stop mechanism. Keep adjusting stop loss based on latest ATR position to lock in more profits.
Advantage Analysis
Bollinger bands itself reflects price equilibrium more effectively than single moving average;
ATR stop loss controls risk/reward ratio of each trade;
Trailing stop adjusts automatically based on market volatility to lock in profits;
Abundant strategy parameters enable high customizability.
Risk Analysis
Multiple small losses may occur when market consolidates;
Failed breakout reversal with Bollinger bands crossover;
Higher risks associated with overnight sessions and major news events.
Counter measures:
- Strictly follow risk management principles, control loss per trade;
- Optimize parameters to improve win rate;
- Apply time filter to avoid high risk periods.
Optimization Directions
- Test different parameter combinations;
- Add timing indicator like OBV;
- Incorporate machine learning model.
Conclusion
This strategy combines Bollinger bands to determine trend equilibrium and breakout directions, ATR to calculate stop loss and take profit to control risk/reward ratio, and trailing stop to lock in profits. Its advantages lie in high customizability, controllable risks, and suitability for short-term intraday trading. Further improvements on win rate and profitability can be achieved through parameter optimization and machine learning.
Parameters
| Name | Default | What it controls |
|---|---|---|
| v_input_2 | timestamp(1 Jan 2099 00:00 +0000) | End Date |
| v_input_3 | 0300-1700 | Time Session To Analyze |
| v_input_string_1 | 0 | Basis MA Type: SMA | EMA | SMMA (RMA) | WMA | VWMA |
| v_input_4_close | 0 | Source: close | high | low | open | hl2 | hlc3 | hlcc4 | ohlc4 |
| v_input_float_1 | 2 | StdDev1 |
| v_input_float_2 | 3 | StdDev2 |
| v_input_int_2 | false | Offset |
| v_input_5 | false | Show Cross the Bands? |
| v_input_6 | true | Show second deviation entry point? |
| v_input_string_2 | 0 | Smoothing: RMA | SMA | EMA | WMA |
| v_input_float_3 | true | Multiplier |
| v_input_7_high | 0 | src1: high | close | low | open | hl2 | hlc3 | hlcc4 | ohlc4 |
| v_input_8_low | 0 | src2: low | high | close | open | hl2 | hlc3 | hlcc4 | ohlc4 |
| v_input_bool_1 | false | show ATR lines ? |
| v_input_float_4 | 1.5 | TP/SL |
| v_input_float_5 | 10 | candle/pip |
| v_input_float_6 | 1.5 | distance to midline/pip |
| v_input_bool_2 | true | use trailing stop loss? |
| v_input_1 | timestamp(01 Aug 2023 00:00 +0000) | (?Time Filter)Start Date |
| v_input_int_1 | 20 | (?Bollinger Band)length |
| v_input_int_3 | 5 | (?ATR)Length |
Source Pine Script
/*backtest
start: 2023-12-26 00:00:00
end: 2024-01-02 00:00:00
period: 1m
basePeriod: 1m
exchanges: [{"eid":"Futures_Binance","currency":"BTC_USDT"}]
*/

// This source code is subject to the terms of the Mozilla Public License 2.0 at https://mozilla.org/MPL/2.0/
// © sadeq_haddadi

//@version=5

strategy('Bollinger Bands + ATR / trail- V2', overlay=true ) // Interactive Brokers rate)


//date and time
startDate   = input(title="Start Date", defval=timestamp("01 Aug 2023 00:00 +0000"), tooltip="Date & time to begin analysis",group = 'Time Filter')
endDate     = input(title="End Date", defval=timestamp("1 Jan 2099 00:00 +0000"), tooltip="Date & time to stop analysis")
timeSession = input(title="Time Session To Analyze", defval="0300-1700", tooltip="Time session to analyze")
inSession(sess) => true

// indicators

length = input.int(20, minval=1,group = 'Bollinger Band')
maType = input.string("SMA", "Basis MA Type", options = ["SMA", "EMA", "SMMA (RMA)", "WMA", "VWMA"])
src = input(close, title="Source")
mult1 = input.float(2.0, minval=0.001, maxval=50, title="StdDev1")
mult2 = input.float(3.0, minval=0.001, maxval=50, title="StdDev2")

ma(source, length, _type) =>
    switch _type
        "SMA" => ta.sma(source, length)
        "EMA" => ta.ema(source, length)
        "SMMA (RMA)" => ta.rma(source, length)
        "WMA" => ta.wma(source, length)
        "VWMA" => ta.vwma(source, length)

basis = ma(src, length, maType)
dev1 = mult1 * ta.stdev(src, length)
dev2 = mult2 * ta.stdev(src, length)
upper1 = basis + dev1
lower1 = basis - dev1
upper2 = basis + dev2
lower2 = basis - dev2
offset = input.int(0, "Offset", minval = -500, maxval = 500)
plot(basis, "Basis", color=#2962FF, offset = offset,linewidth=2)
p1 = plot(upper1, "Upper", color=color.new(color.white,50), offset = offset,linewidth=2)
p2 = plot(lower1, "Lower", color=color.new(color.white,50), offset = offset,linewidth=2)
p3 = plot(upper2, "Upper", color=color.new(color.white,80), offset = offset,linewidth=1)
p4 = plot(lower2, "Lower", color=color.new(color.white,80), offset = offset,linewidth=1)

fill(p1, p2, title = "Background", color=color.rgb(33, 150, 243, 95))
fill(p3, p4, title = "Background", color=color.rgb(33, 150, 243, 95))

show_crosses = input(false, "Show Cross the Bands?")

plotshape(show_crosses and ta.crossover(close, upper2)  ? src : na, "S", style = shape.triangledown, location =location.abovebar, color = color.yellow, size = size.tiny)
plotshape(show_crosses and ta.crossunder(low, lower2) ? src : na ,"L", style = shape.triangleup, location =  location.belowbar, color = color.purple, size = size.tiny)

second_entry = input(true, "Show second deviation entry point?")

//atr

length_ATR = input.int(title="Length", defval=5, minval=1,group = 'ATR')
smoothing = input.string(title="Smoothing", defval="RMA", options=["RMA", "SMA", "EMA", "WMA"])
m = input.float(1, "Multiplier")
src1 = input(high)
src2 = input(low)
pline = input.bool(title = 'show ATR lines ?', defval=false)


ma_function(source, length_ATR) =>
	if smoothing == "RMA"
		ta.rma(source, length_ATR)
	else
		if smoothing == "SMA"
			ta.sma(source, length_ATR)
		else
			if smoothing == "EMA"
				ta.ema(source, length_ATR)
			else
				ta.wma(source, length_ATR)

a = ma_function(ta.tr(true), length_ATR) * m
x = ma_function(ta.tr(true), length_ATR) * m + src1
x2 = src2 - ma_function(ta.tr(true), length_ATR) * m

PP1 = plot(pline ? x :na , title = "ATR Short Stop Loss", color= color.new(color.red,20) )
PP2 = plot(pline ? x2:na , title = "ATR Long Stop Loss",  color=color.new(color.green,20) )

Tp_to_Sl = input.float(1.5, "TP/SL")
candle_size =  input.float(10, "candle/pip")
distance_source =  input.float(1.5, "distance to midline/pip")
//strategy

buyCondition = low[2] < lower1 and  ta.crossover(close[1], lower1)  and strategy.position_size == 0 and (close[1] - open[1]) < candle_size * 0.0001 and close > open and ( basis - close) > distance_source * 0.0001

sellCondition = high[2] > upper1 and ta.crossunder(close[1], upper1)  and strategy.position_size == 0 and (open[1] - close[1]) < candle_size * 0.0001 and close < open  and (close - basis) > distance_source * 0.0001
//
buyCondition2 = low[2] < lower2 and  ta.crossover(close[1], lower2)  and (close[1] - open[1]) < candle_size * 0.0001 and close > open and ( basis - close) > distance_source * 0.0001
sellCondition2 = high[2] > upper2 and ta.crossunder(close[1], upper2)   and (open[1] - close[1]) < candle_size * 0.0001 and close < open  and (close - basis) > distance_source * 0.0001

plotshape(second_entry and  sellCondition2 ? src : na, "S", style = shape.triangledown, location =location.abovebar, color = color.rgb(241, 153, 177), size = size.tiny)
plotshape(second_entry and buyCondition2 ? src : na ,"L", style = shape.triangleup, location =  location.belowbar, color = color.rgb(177, 230, 168), size = size.tiny)
//
since_buy  =ta.barssince(buyCondition)
since_sell =ta.barssince(sellCondition)
entry_price = ta.valuewhen(buyCondition or sellCondition, src, 0)

sl_long = ta.valuewhen(buyCondition, x2[1], 0)
sl_short = ta.valuewhen(sellCondition, x[1], 0)
buyprofit = entry_price + (Tp_to_Sl*( entry_price - sl_long))
sellprofit= entry_price + (Tp_to_Sl*( entry_price - sl_short))

//alert_massage = "new strategy position is {{strategy.position_size}}"
//prof = ta.crossover(high,upper1)
//buyexit=ta.valuewhen(prof,upper1,0)

if buyCondition and inSession(timeSession)

    strategy.entry( id = "long", direction = strategy.long , alert_message='Open Long Position' )

if sellCondition and inSession(timeSession)

    strategy.entry(id= "short", direction = strategy.short, alert_message='Open Short Position')

//trail-stop loss
use_trailing = input.bool(title = 'use trailing stop loss?', defval=true)
pricestop_long=0.00
pricestop_short=100000.00
if (strategy.position_size > 0)

    if use_trailing == false
        pricestop_long := sl_long
    else
        pricestop_long := math.max (x2, pricestop_long[1]) //trail - long

if (strategy.position_size < 0)

    if use_trailing == false
        pricestop_short := sl_short
    else
        pricestop_short := math.min (x, pricestop_short[1])  // trail - short

if strategy.position_size > 0

    strategy.exit(id = 'close', limit =  buyprofit , stop = pricestop_long  )

if strategy.position_size < 0

    strategy.exit(id = 'close', limit = sellprofit  , stop = pricestop_short  )

alertcondition(buyCondition or sellCondition, 'Enter_position')
Published by ChaoZhang on the FMZ strategy square · last modified 2024-01-03. Collected in the Quant Trading Vault. Unvalidated research: re-test with your own data and costs before trusting it.
Build this with AgenKit
A spec is not a trading system. Paste this into your coding agent and AgenKit runs a specialist team — architecture, test-first build, risk gates, review — with paper trading on by default.
/agenkit build a production-grade trading bot with a backtest engine, risk controls and paper trading by default from strategies/Bollinger-Bands-ATR-Trailing-Stop-Strategy.md- npx agenkit install engineering-kit in your project
- Paste the command into your agent and approve each phase
- Get tests, backtest, risk controls and a paper-trading switch
Understand it first
Before you run this, read the lesson behind the idea and how to backtest it honestly. Specs like this one are the survivors of an unknown number of trials; deflate their results accordingly.
Related specs
- Dynamic Price Swing Oscillator StrategyPine Script · Machine learning · 1m
- Dual Moving Average Matching Strategy Based on Bollinger BandsPine Script · Machine learning · 1h
- Bull Bear Power Trading Strategy with Volume Percentile Based Dynamic Take Profit SystemPine Script · Machine learning · 1d
- ADX EFI 50 Moving Average Channel Pullback StrategyPine Script · Machine learning · 1h
- Bollinger Bands and K line Combined StrategyPine Script · Machine learning · 3m
- Dual CCI Quantitative StrategyPine Script · Machine learning · 1h