Bollinger Bands Momentum Trend Following Strategy
This strategy implements a robust trend-following strategy based on Bollinger Bands, moving averages, and volume analysis. It aims to capture potential trend reversals and capitalize on market momentum.
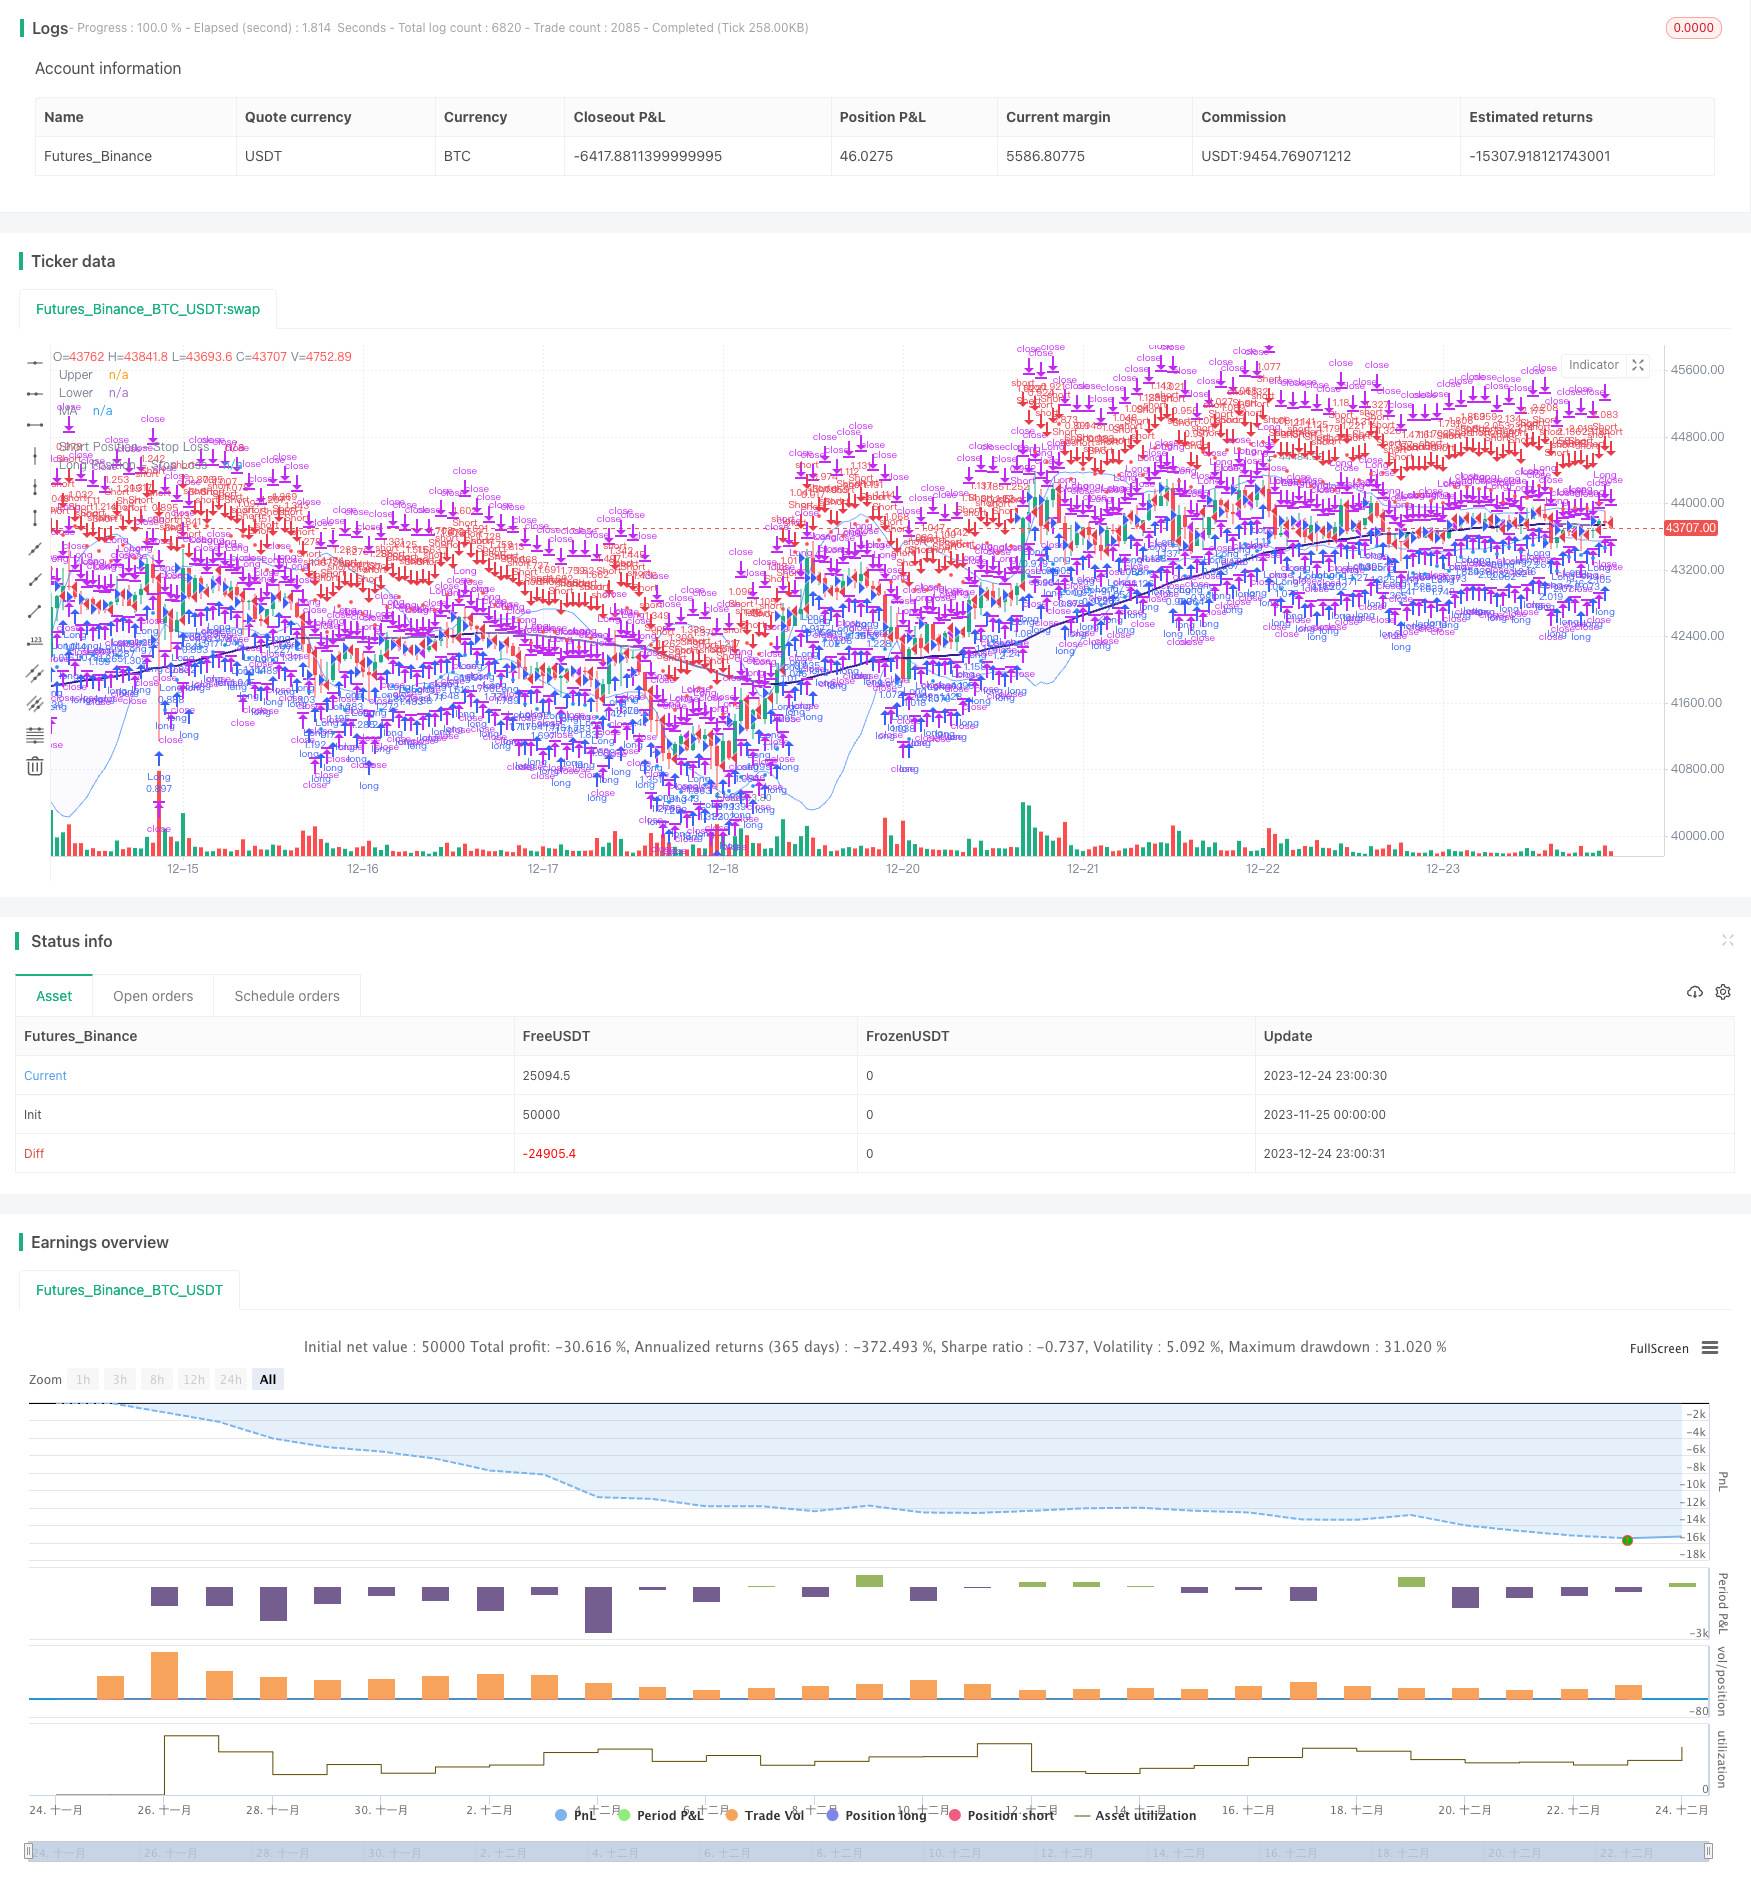
Overview
This strategy implements a robust trend-following strategy based on Bollinger Bands, moving averages, and volume analysis. It aims to capture potential trend reversals and capitalize on market momentum.
Strategy Logic
Bollinger Bands
Utilizes Bollinger Bands to identify overbought and oversold conditions in the market. Provides clear upper and lower band visualizations to aid decision-making.
Calculates bands based on the middle value and standard deviation over a certain period. Price crossing upper or lower band indicates overbought or oversold signals.
Moving Average Filter
Implements a moving average (MA) filter to enhance trend identification. Users can choose from various MA types including Simple, Exponential, Weighted.
Generates buy (sell) signals when price crosses above (below) moving average.
Volume Analysis
Allows users to integrate volume analysis into the strategy for enhanced signal confirmation. Color-coded volume bars indicate whether volume is above or below the average.
Volume crossing average can be used to confirm price signals.
Advantages
Robust Trend Following
Identifies market trend reversals based on Bollinger Bands, moving averages and volume.
Captures price trends in a timely manner for trend trading.
Flexibility & Customization
Users can optimize parameters like BB period, MA type and length.
Long and short positions can be controlled separately.
Visualization & Confirmation
Dual signal mechanism confirming price signals using MA and volume.
Intuitive display of key trading signals like moving averages, stop-loss levels.
Risk Management
Calculates stop-loss based on ATR. Customizable ATR period and multiplier.
Adjusts position size based on percentage of equity at risk to control single trade loss.
Risks
Backtest Period Risks
- Performance may vary across different historical periods. Robustness should be validated via multi-period backtests.
Trend Reversal Risks
- Increased stop-loss triggers during range-bound markets. Can be mitigated by optimizing MA parameters.
Over-optimization
- Multi-parameter optimization may lead to overfitting. Robustness should be verified across different parameter sets.
Lagging Indicator Risks
- Indicators have inherent lag. Price action should supplement indicator signals.
Enhancement Opportunities
Parameter Optimization
- Optimize BB, MA, ATR parameters for different products and timeframes.
Position Optimization
- Test different equity percentage at risk levels, stop-loss multipliers.
Signal Optimization
- Introduce additional filters like KD, MACD to supplement entry and exit signals.
Code Optimization
- Refine signal logic to avoid unnecessary trades. Adopt OOP for extensibility.
Conclusion
The strategy integrates Bollinger Bands, moving averages and volume analysis into a mechanical trend trading system. Its strength lies within robust signal confirmation and risk control mechanisms. Further improvements can be made via parameter and signal optimization to enhance stability and profitability. The strategy methodology serves as a reference for trend followers.
Parameters
| Name | Default | What it controls |
|---|---|---|
| v_input_int_3 | false | Offset |
| v_input_bool_1 | true | (?Backtest Time Period)Filter Date Range of Backtest |
| v_input_1 | timestamp(1 jan 2017) | Start Date |
| v_input_2 | timestamp(1 jul 2100) | End Date |
| v_input_bool_2 | true | (?Long & Short Position)On/Off Long Postion |
| v_input_bool_3 | true | On/Off Short Postion |
| v_input_string_1 | 0 | (?MA)MA Type: WMA | EMA | SMA | HMA | RMA | SWMA | ALMA | VWMA | VWAP |
| v_input_int_1 | 99 | MA Lenght |
| v_input_3_close | 0 | MA Source: close | high | low | open | hl2 | hlc3 | hlcc4 | ohlc4 |
| v_input_int_2 | 20 | (?BB)length |
| v_input_4_close | 0 | Source: close | high | low | open | hl2 | hlc3 | hlcc4 | ohlc4 |
| v_input_float_1 | 2 | StdDev |
| v_input_bool_4 | false | (?Volume Inputs)Use Volume Filter? |
| v_input_int_4 | 30 | MA length |
| v_input_int_5 | 3 | Width of volume bars |
| v_input_bool_5 | false | Color bars? |
| v_input_int_6 | 14 | (?Risk Management Inputs)ATR Length |
| v_input_float_2 | 2 | Long Position - Stop Loss - ATR Multiplier |
| v_input_float_3 | 2 | Short Position - Stop Loss - ATR Multiplier |
| v_input_float_4 | 2 | % of Equity at Risk |
Source Pine Script
/*backtest
start: 2023-11-25 00:00:00
end: 2023-12-25 00:00:00
period: 1h
basePeriod: 15m
exchanges: [{"eid":"Futures_Binance","currency":"BTC_USDT"}]
*/

// This source code is subject to the terms of the Mozilla Public License 2.0 at https://mozilla.org/MPL/2.0/
// © sosacur01

//@version=5
strategy(title="Bollinger Band | Trend Following", overlay=true, pyramiding=1, commission_type=strategy.commission.percent, commission_value=0.2, initial_capital=10000)

//--------------------------------------

//BACKTEST RANGE
useDateFilter = input.bool(true, title="Filter Date Range of Backtest",
     group="Backtest Time Period")
backtestStartDate = input(timestamp("1 jan 2017"),
     title="Start Date", group="Backtest Time Period",
     tooltip="This start date is in the time zone of the exchange " +
     "where the chart's instrument trades. It doesn't use the time " +
     "zone of the chart or of your computer.")
backtestEndDate = input(timestamp("1 jul 2100"),
     title="End Date", group="Backtest Time Period",
     tooltip="This end date is in the time zone of the exchange " +
     "where the chart's instrument trades. It doesn't use the time " +
     "zone of the chart or of your computer.")
inTradeWindow = true
if not inTradeWindow and inTradeWindow[1]
    strategy.cancel_all()
    strategy.close_all(comment="Date Range Exit")

//--------------------------------------

//LONG/SHORT POSITION ON/OFF INPUT
LongPositions   = input.bool(title='On/Off Long Postion', defval=true, group="Long & Short Position")
ShortPositions  = input.bool(title='On/Off Short Postion', defval=true, group="Long & Short Position")

//--------------------------------------
//MA INPUTS
averageType1    = input.string(defval="WMA", group="MA", title="MA Type", options=["SMA", "EMA", "WMA", "HMA", "RMA", "SWMA", "ALMA", "VWMA", "VWAP"])
averageLength1  = input.int(defval=99, title="MA Lenght", group="MA")
averageSource1  = input(close, title="MA Source", group="MA")

//MA TYPE
MovAvgType1(averageType1, averageSource1, averageLength1) =>
	switch str.upper(averageType1)
        "SMA"  => ta.sma(averageSource1, averageLength1)
        "EMA"  => ta.ema(averageSource1, averageLength1)
        "WMA"  => ta.wma(averageSource1, averageLength1)
        "HMA"  => ta.hma(averageSource1, averageLength1)
        "RMA"  => ta.rma(averageSource1, averageLength1)
        "SWMA" => ta.swma(averageSource1)
        "ALMA" => ta.alma(averageSource1, averageLength1, 0.85, 6)
        "VWMA" => ta.vwma(averageSource1, averageLength1)
        "VWAP" => ta.vwap(averageSource1)
        => runtime.error("Moving average type '" + averageType1 +
             "' not found!"), na


//MA VALUES
ma  = MovAvgType1(averageType1, averageSource1, averageLength1)

//MA CONDITIONS
bullish_ma = close > ma
bearish_ma = close < ma

//PLOT COLOR
ma_plot    = if close > ma
    color.navy
else
    color.rgb(49, 27, 146, 40)

//MA PLOT
plot(ma,color=ma_plot, linewidth=2, title="MA")

//--------------------------------------
//BB INPUTS
length  = input.int(20, minval=1, group="BB")
src     = input(close, title="Source", group="BB")
mult    = input.float(2.0, minval=0.001, maxval=50, title="StdDev", group="BB")

//BB VALUES
basis = ta.sma(src, length)
dev = mult * ta.stdev(src, length)
upper = basis + dev
lower = basis - dev
offset = input.int(0, "Offset", minval = -500, maxval = 500)

//BBPLOT
//plot(basis, "Basis", color=#FF6D00, offset = offset)
p1 = plot(upper, "Upper", color=#2978ffa4, offset = offset)
p2 = plot(lower, "Lower", color=#2978ffa4, offset = offset)
fill(p1, p2, title = "Background", color=color.rgb(33, 47, 243, 97))

//BB ENTRY AND EXIT CONDITIONS
bb_long_entry  = close >= upper
bb_long_exit   = close <= lower
bb_short_entry = close <= lower
bb_short_exit  = close >= upper

//---------------------------------------------------------------
//VOLUME INPUTS
useVolumefilter  = input.bool(title='Use Volume Filter?', defval=false, group="Volume Inputs")
dailyLength      = input.int(title = "MA length", defval = 30, minval = 1, maxval = 100, group = "Volume Inputs")
lineWidth        = input.int(title = "Width of volume bars", defval = 3, minval = 1, maxval = 6, group = "Volume Inputs")
Volumefilter_display  = input.bool(title="Color bars?", defval=false, group="Volume Inputs", tooltip = "Change bar colors when Volume is above average")

//VOLUME VALUES
volumeAvgDaily = ta.sma(volume, dailyLength)

//VOLUME SIGNAL
v_trigger  = (useVolumefilter ? volume > volumeAvgDaily : inTradeWindow)

//PLOT VOLUME SIGNAL
barcolor(Volumefilter_display ? v_trigger ? color.new(#6fe477, 77):na: na, title="Volume Filter")
//---------------------------------------------------------------

//ENTRIES AND EXITS
long_entry  = if inTradeWindow and bullish_ma and bb_long_entry and v_trigger and LongPositions
    true
long_exit   = if inTradeWindow and bb_long_exit
    true

short_entry = if inTradeWindow  and bearish_ma and bb_short_entry and v_trigger and ShortPositions
    true
short_exit  = if inTradeWindow  and bb_short_exit
    true

//--------------------------------------

//RISK MANAGEMENT - SL, MONEY AT RISK, POSITION SIZING
atrPeriod                = input.int(14, "ATR Length", group="Risk Management Inputs")
sl_atr_multiplier        = input.float(title="Long Position - Stop Loss - ATR Multiplier", defval=2, group="Risk Management Inputs", step=0.5)
sl_atr_multiplier_short  = input.float(title="Short Position - Stop Loss - ATR Multiplier", defval=2, group="Risk Management Inputs", step=0.5)
i_pctStop                = input.float(2, title="% of Equity at Risk", step=.5, group="Risk Management Inputs")/100

//ATR VALUE
_atr = ta.atr(atrPeriod)

//CALCULATE LAST ENTRY PRICE
lastEntryPrice = strategy.opentrades.entry_price(strategy.opentrades - 1)

//STOP LOSS - LONG POSITIONS
var float sl = na

//CALCULTE SL WITH ATR AT ENTRY PRICE - LONG POSITION
if (strategy.position_size[1] != strategy.position_size)
    sl := lastEntryPrice - (_atr * sl_atr_multiplier)

//IN TRADE - LONG POSITIONS
inTrade = strategy.position_size > 0

//PLOT SL - LONG POSITIONS
plot(inTrade ? sl : na, color=color.blue, style=plot.style_circles, title="Long Position - Stop Loss")

//CALCULATE ORDER SIZE - LONG POSITIONS
positionSize = (strategy.equity * i_pctStop) / (_atr * sl_atr_multiplier)

//============================================================================================

//STOP LOSS - SHORT POSITIONS
var float sl_short = na

//CALCULTE SL WITH ATR AT ENTRY PRICE - SHORT POSITIONS
if (strategy.position_size[1] != strategy.position_size)
    sl_short := lastEntryPrice + (_atr * sl_atr_multiplier_short)

//IN TRADE SHORT POSITIONS
inTrade_short = strategy.position_size < 0

//PLOT SL - SHORT POSITIONS
plot(inTrade_short ? sl_short : na, color=color.red, style=plot.style_circles, title="Short Position - Stop Loss")

//CALCULATE ORDER - SHORT POSITIONS
positionSize_short = (strategy.equity * i_pctStop) / (_atr * sl_atr_multiplier_short)


//===============================================

//LONG STRATEGY
strategy.entry("Long", strategy.long, comment="Long", when = long_entry, qty=positionSize)
if (strategy.position_size > 0)
    strategy.close("Long", when = (long_exit), comment="Close Long")
    strategy.exit("Long", stop = sl, comment="Exit Long")

//SHORT STRATEGY
strategy.entry("Short", strategy.short, comment="Short", when = short_entry, qty=positionSize_short)
if (strategy.position_size < 0)
    strategy.close("Short", when = (short_exit), comment="Close Short")
    strategy.exit("Short", stop = sl_short, comment="Exit Short")

//ONE DIRECTION TRADING COMMAND (BELLOW ONLY ACTIVATE TO CORRECT BUGS)
//strategy.risk.allow_entry_in(strategy.direction.long)
Published by ChaoZhang on the FMZ strategy square · last modified 2023-12-26. Collected in the Quant Trading Vault. Unvalidated research: re-test with your own data and costs before trusting it.
Build this with AgenKit
A spec is not a trading system. Paste this into your coding agent and AgenKit runs a specialist team — architecture, test-first build, risk gates, review — with paper trading on by default.
/agenkit build a production-grade trading bot with a backtest engine, risk controls and paper trading by default from strategies/Bollinger-Bands-Momentum-Trend-Following-Strategy.md- npx agenkit install engineering-kit in your project
- Paste the command into your agent and approve each phase
- Get tests, backtest, risk controls and a paper-trading switch
Understand it first
Before you run this, read the lesson behind the idea and how to backtest it honestly. Specs like this one are the survivors of an unknown number of trials; deflate their results accordingly.
Related specs
- Multi Trend Momentum Crossover Strategy with Volatility Optimization SystemPine Script · Momentum · 1d
- Multi Indicator Comprehensive Analysis Quantitative Trading Strategy Trend Momentum and Volatility Collaborative Prediction ModelPine Script · Momentum · 3m
- Multi Indicator Dynamic Stop Loss Momentum Trend Trading StrategyPine Script · Momentum · 1h
- Advanced Multi Indicator Trend Following and Momentum Quantitative Trading StrategyPine Script · Momentum · 1h
- KST EMA Momentum Trend Following StrategyPine Script · Momentum · 1d
- Moving Average Candle Regression StrategyPine Script · Momentum · 15m