Strategy vault / Mean reversion
Bollinger Bands Strategy
Definition The Bollinger Bands strategy is often used with the assistance of other indicators to make conceptual and strategic trading decisions. Bollinger Bands consist of three bands total: an upper band, middle…
Definition The Bollinger Bands strategy is often used with the assistance of other indicators to make conceptual and strategic trading decisions. Bollinger Bands consist of three bands total: an upper band, middle band, and lower band. These separate bands are each used to highlight extreme prices in a specific security. The upper band is associated with overbought securities, whereas the lower band points to securities that are oversold, and the middle band acts as a moving average.
It is common after a lower band has been broken by heavy selling for the price of the stock to revert back above the point of the lower band and move closer to the middle band. The Bollinger Bands strategy specifically profits from this type of occurrence - where the strategy demands for a close below the lower band. Therefore, it can be determined that buying the breaks of the lower Bollinger Band is a specific way that traders and analysts are able to take advantage of oversold conditions.
History Bollinger Bands were created in the 1980s by John Bollinger. This strategy has become one of the most frequently used tools by technical analysts since its inception towards the end of the 20th century.
Takeaways and what to look for The Bollinger Bands strategy is commonly used to point out oversold market conditions. However, instances may occur when the strategy is correct, yet selling pressure continues. During these instances, it can be hard to determine when the selling pressure will end and therefore, a protection of sorts is needed for once there has been an acute decision to buy.
Stop-loss orders are one of the many strategies that were developed in order to protect traders and analysts from trades that continue to ride the band lower than necessary.
Limitations There are quite a few limitations to this strategy, but they often depend on the specific case and how the strategy is being used to track market trends. Price is a factor that does not often rebound quickly with the Bollinger Bands strategy. Although the strategy can often correct itself, this doesn't always stop traders and analysts from experiencing significant losses due to rebound delay.
Additionally, as mentioned above, it can be hard to determine when selling pressure will end and so it is essential for the strategy to be paired with a protection that will ensure stability when a trader has decided to go ahead with a buy.
Summary The Bollinger Bands strategy is often used with the assistance of other indicators to make strategic trading decisions based on the status of the market and position of stocks. When there is consistent seller pressure present, and this pressure is not corrected in a timely manner, stocks then continue to make new lows into oversold conditions. In order to use the Bollinger Bands strategy effectively, it is advised that you have a decent exit strategy, such as stop-loss orders. This is to ensure that you and your trade are protected from a stock that continues to ride the lower band, without knowing at what point selling pressure will end.
backtest
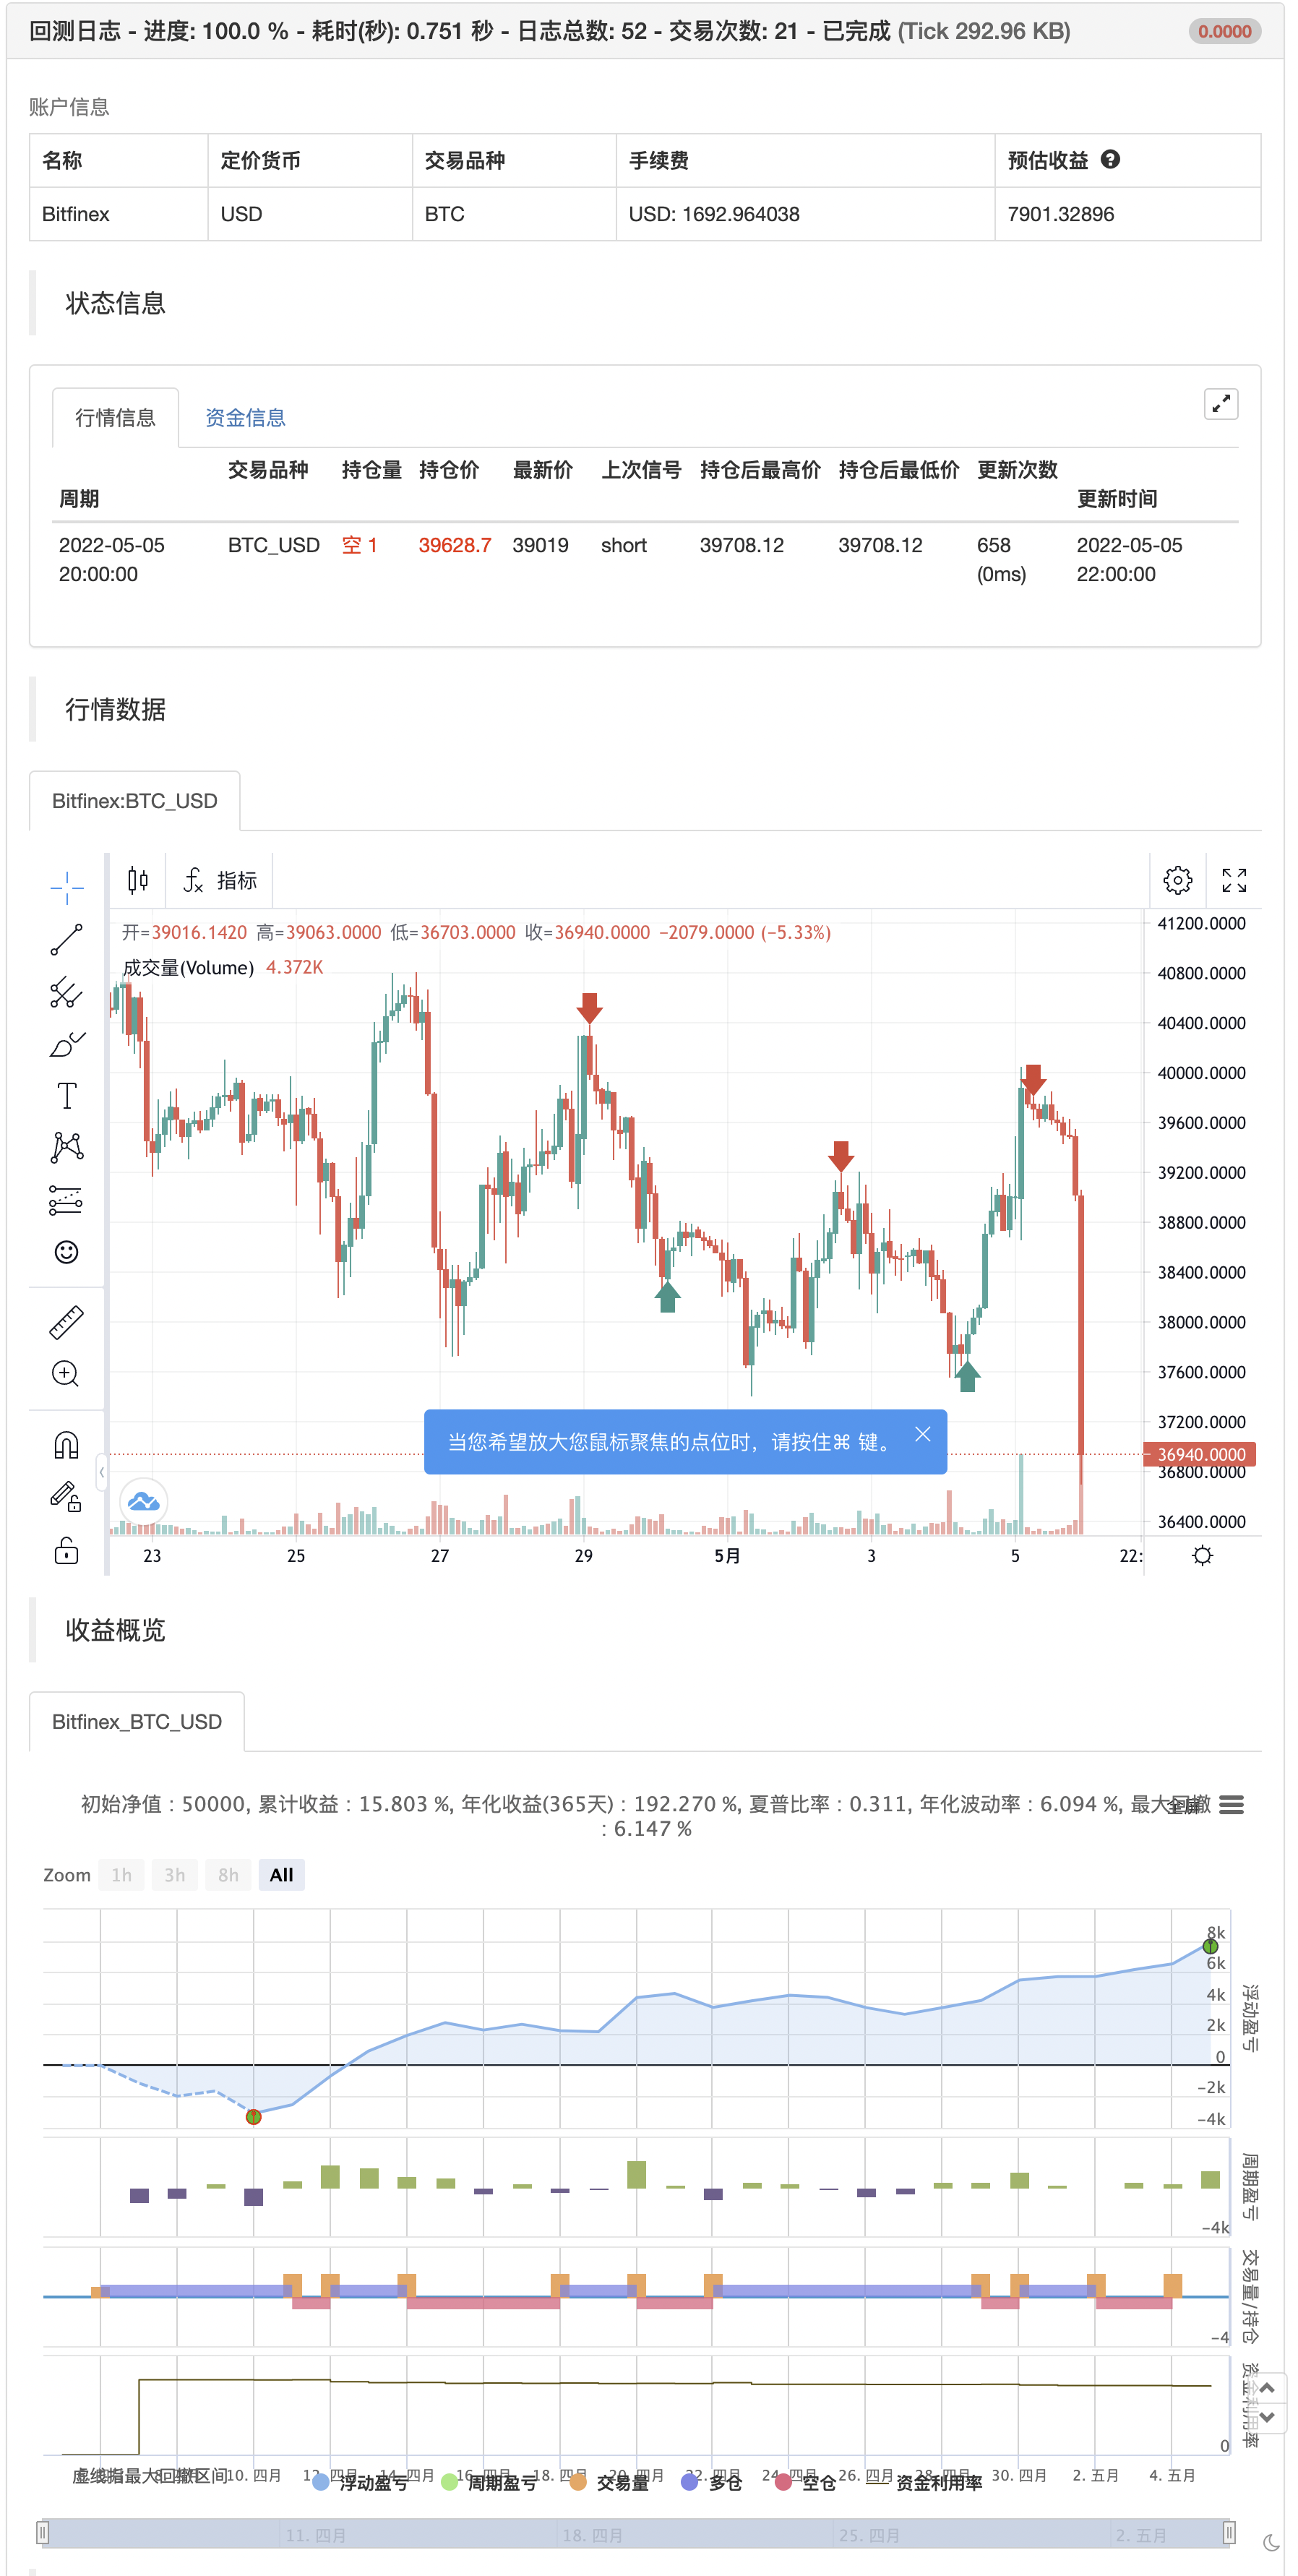
Parameters
| Name | Default | What it controls |
|---|---|---|
| v_input_int_1 | 22 | length |
| v_input_float_1 | 2 | mult |
Source Pine Script
/*backtest
start: 2022-04-06 00:00:00
end: 2022-05-05 23:59:00
period: 2h
basePeriod: 15m
exchanges: [{"eid":"Bitfinex","currency":"BTC_USD"}]
*/

//@version=5
strategy("Bollinger Bands Strategy", overlay=true)
source = close
length = input.int(22, minval=1)
mult = input.float(2.0, minval=0.001, maxval=50)
basis = ta.sma(source, length)
dev = mult * ta.stdev(source, length)
upper = basis + dev
lower = basis - dev
buyEntry = ta.crossover(source, lower)
sellEntry = ta.crossunder(source, upper)
if (ta.crossover(source, lower))
	strategy.entry("BBandLE", strategy.long, stop=lower, oca_name="BollingerBands",  comment="BBandLE")
if (ta.crossunder(source, upper))
	strategy.entry("BBandSE", strategy.short, stop=upper, oca_name="BollingerBands",  comment="BBandSE")
Published by ChaoZhang on the FMZ strategy square · last modified 2022-05-07. Collected in the Quant Trading Vault. Unvalidated research: re-test with your own data and costs before trusting it.
Build this with AgenKit
A spec is not a trading system. Paste this into your coding agent and AgenKit runs a specialist team — architecture, test-first build, risk gates, review — with paper trading on by default.
/agenkit build a production-grade trading bot with a backtest engine, risk controls and paper trading by default from strategies/Bollinger-Bands-Strategy.md- npx agenkit install engineering-kit in your project
- Paste the command into your agent and approve each phase
- Get tests, backtest, risk controls and a paper-trading switch
Understand it first
Before you run this, read the lesson behind the idea and how to backtest it honestly. Specs like this one are the survivors of an unknown number of trials; deflate their results accordingly.
Related specs
- Advanced 15 Minute Chart Trading Signal StrategyPine Script · Mean reversion · 3h
- Advanced Quantitative Trading Strategy Combining RSI Divergence and Moving AveragesPine Script · Mean reversion · 1h
- Bollinger Bands ATR Risk Reward Trading StrategyPine Script · Mean reversion · 1d
- Bollinger Bands Long Only StrategyPine Script · Mean reversion · 1d
- Bollinger Bands Momentum Reversal Quantitative StrategyPine Script · Mean reversion · 45m
- Bollinger Bands Stochastic RSI Extreme Strategy BBSR Extreme StrategyPine Script · Mean reversion · 1h