Bollinger Breakout Stock Strategy
The Bollinger breakout stock strategy is a quantitative trading strategy that tracks stock price fluctuations using Bollinger Bands to identify when prices break out of their normal volatility range and generate…
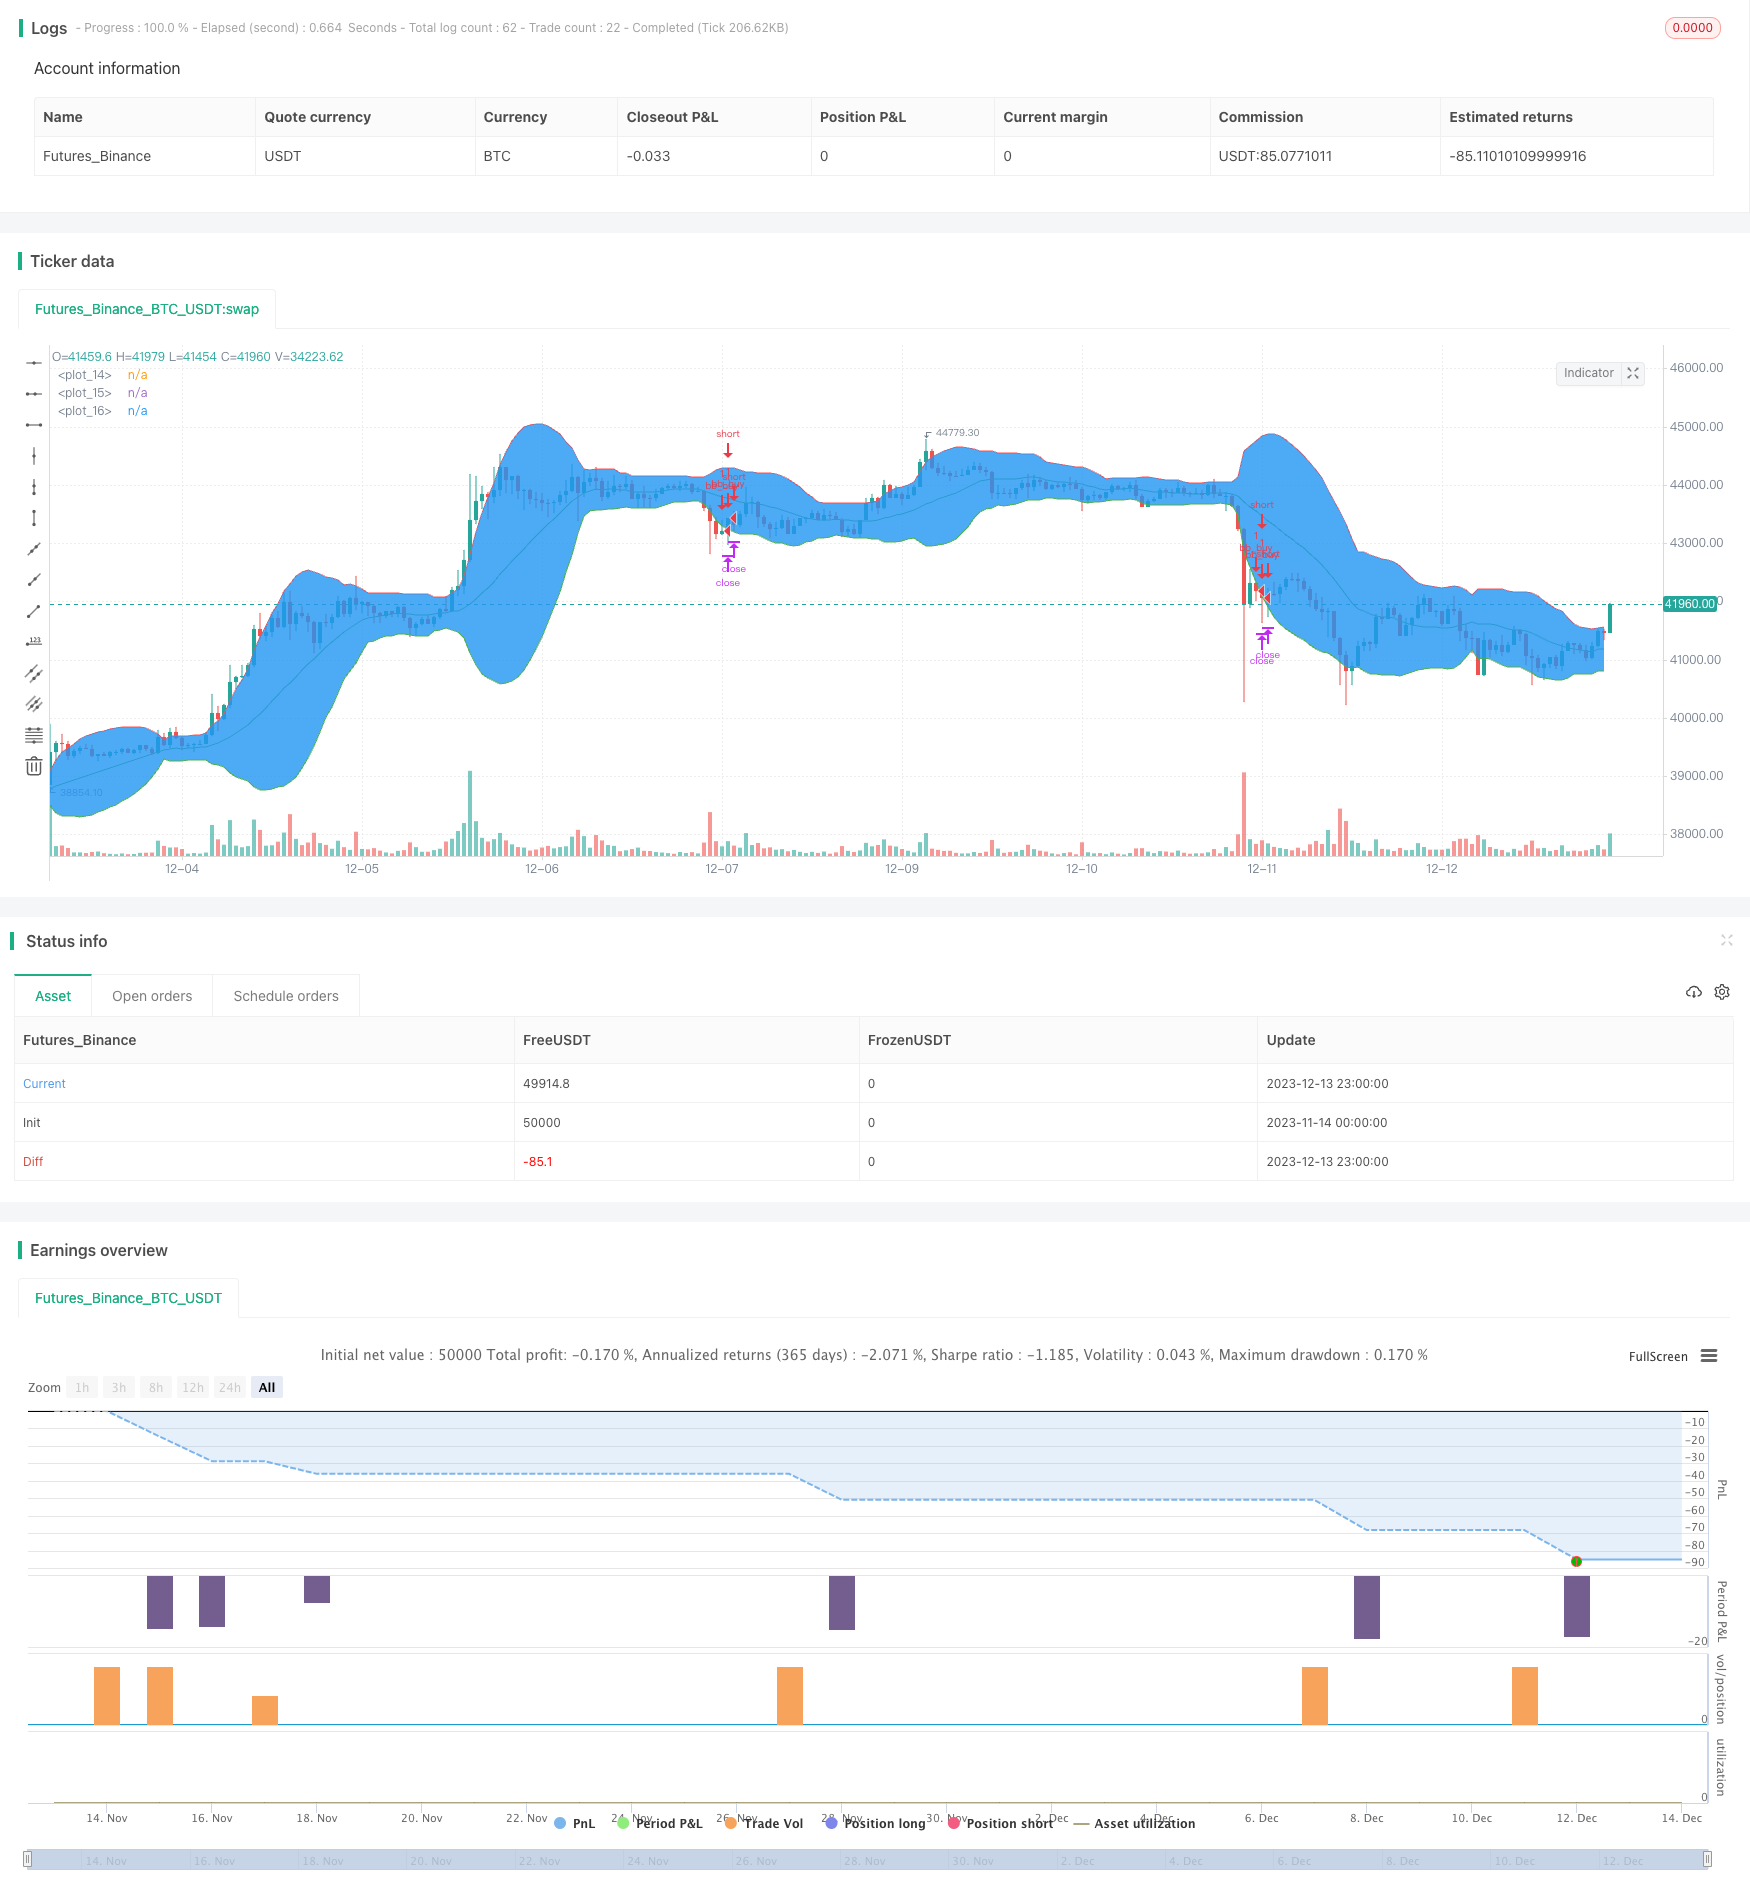
Overview
The Bollinger breakout stock strategy is a quantitative trading strategy that tracks stock price fluctuations using Bollinger Bands to identify when prices break out of their normal volatility range and generate trade signals. It goes long when prices break below the lower Bollinger Band and goes short when prices break above the upper Bollinger Band. The strategy tracks short-term price trends and is suitable for short-term trading.
Strategy Logic
The strategy calculates the middle band, upper band and lower band using 20-day closing prices. The middle band is a 20-day simple moving average, while the upper and lower bands are placed at a distance of 2 standard deviations from the middle band.
When stock closing prices break below the lower band, it signals that prices have broken out of the normal volatility range and are starting a new uptrend. The strategy would go long at this point based on the code. The stop loss is set at the lowest low of the recent 10 bars, while take profit is set at the highest high of recent 10 bars.
When prices break above the upper band, it signals the start of a new downtrend. The strategy would go short here. Stop loss is the 10-bar highest level and take profit is the 10-bar lowest level.
The strategy effectively utilizes Bollinger Bands to identify trend changes and volatility range, entering early when prices are likely to reverse.
Advantage Analysis
The main advantages of this strategy are:
Effectively identifies trend change points using Bollinger Bands, catching short-term trends efficiently.
Smaller drawdown risk due to stop loss set at recent lowest swing low, which limits losses.
Take profit set at the recent highest level allows maximizing profits from one-sided trend moves.
Simple and clear logic, easy to understand and modify, suitable for quant trading beginners.
Risk Analysis
There are also some risks to consider:
Bollinger Bands are very sensitive to volatility changes, inappropriate parameters may cause false signals. Parameters like period should be adjusted accordingly.
High stock price fluctuations, stop loss triggered too early, unable to ride the trend. Can consider widening bands for stop loss.
Signal delay, may cause excessive unrealized profits. Other indicators can be added to identify earlier entries.
Market unpredictability makes take profit/stop loss difficult, manual intervention required to fine tune parameters.
Improvement Areas
Some ways to further improve the strategy:
Add other indicators to confirm signals, e.g. volume spike.
Dynamically adjust Bollinger parameters to fit changing volatility.
Enhance stop loss/take profit, e.g. trailing stop loss, staged profit taking.
Test parameters across different stocks to find best fit.
Introduce machine learning to auto optimize parameters.
Summary
The Bollinger breakout strategy has clear logic to identify reversals. Limited drawdown risk allows catching short-term trends. But also has profit target limitations and signal delay issues. Can be improved via parameter tuning, better stop loss/take profit, adding filters etc. Suitable for short-term stock trading to track medium-term trends.
Source Pine Script
/*backtest
start: 2023-11-14 00:00:00
end: 2023-12-14 00:00:00
period: 1h
basePeriod: 15m
exchanges: [{"eid":"Futures_Binance","currency":"BTC_USDT"}]
*/

//@version=4

// Initial settings
strategy("Bulle de bollinger", overlay = true)

// Parameter Settings
mdl = sma(close, 20)
dev = stdev(close, 20)

upr = mdl + 2*dev
lwr = mdl - 2*dev

// Plot
plot(mdl, color = color.green) // Plot moving average
p1 = plot(upr, color = color.red) // Plot Upper_band
p2 = plot(lwr, color = color.green) // Plot lower band
fill(p1, p2, color = color.blue) // Fill transparant color between the 2 plots

// Strategy entry & close

if open[1] < lwr[1] and close[1] < lwr[1] // Previous price lower than lower band and current close is higher than lower band
    stop_level = lowest(10)
    profit_level = highest(10)
    strategy.entry(id = 'bb_buy', long = true)
    strategy.exit("TP/SL", "bb_buy", stop=stop_level, limit=profit_level)

if open[1] > upr[1] and close[1] > upr // Previous price is higher than higher band & current close is lower the higher band
    stop_level = highest(10)
    profit_level = lowest(10)
    //strategy.entry(id = 'bb_sell', long = false)
    //strategy.exit("TP/SL", "bb_sell", stop=stop_level, limit=profit_level)
Published by ChaoZhang on the FMZ strategy square · last modified 2023-12-15. Collected in the Quant Trading Vault. Unvalidated research: re-test with your own data and costs before trusting it.
Build this with AgenKit
A spec is not a trading system. Paste this into your coding agent and AgenKit runs a specialist team — architecture, test-first build, risk gates, review — with paper trading on by default.
/agenkit build a production-grade trading bot with a backtest engine, risk controls and paper trading by default from strategies/Bollinger-Breakout-Stock-Strategy.md- npx agenkit install engineering-kit in your project
- Paste the command into your agent and approve each phase
- Get tests, backtest, risk controls and a paper-trading switch
Understand it first
Before you run this, read the lesson behind the idea and how to backtest it honestly. Specs like this one are the survivors of an unknown number of trials; deflate their results accordingly.
Related specs
- Dynamic Bollinger Bands Breakout Quantitative Trading StrategyPine Script · Breakout · 2d
- Multi Indicator Momentum Breakout with Smoothed Candlestick Trading StrategyPine Script · Breakout · 6h
- Multi factor Intelligent Trading StrategyPine Script · Breakout · 1d
- Bollinger Band Breakout Trading StrategyPine Script · Breakout · 2h
- Bollinger Bands Breakout Strategy 442259Pine Script · Breakout · 1h
- Enhanced Bollinger Breakout Quantitative Strategy with Momentum Filter Integration SystemPine Script · Breakout · 2d