Strategy vault / Mean reversion
Bottom Reversal Strategy
This strategy is based on market bottoms for reversal trading. It uses the lowest points of the 200-day EMA combined with Camarilla support/resistance levels to determine market bottoms. It goes long when prices…
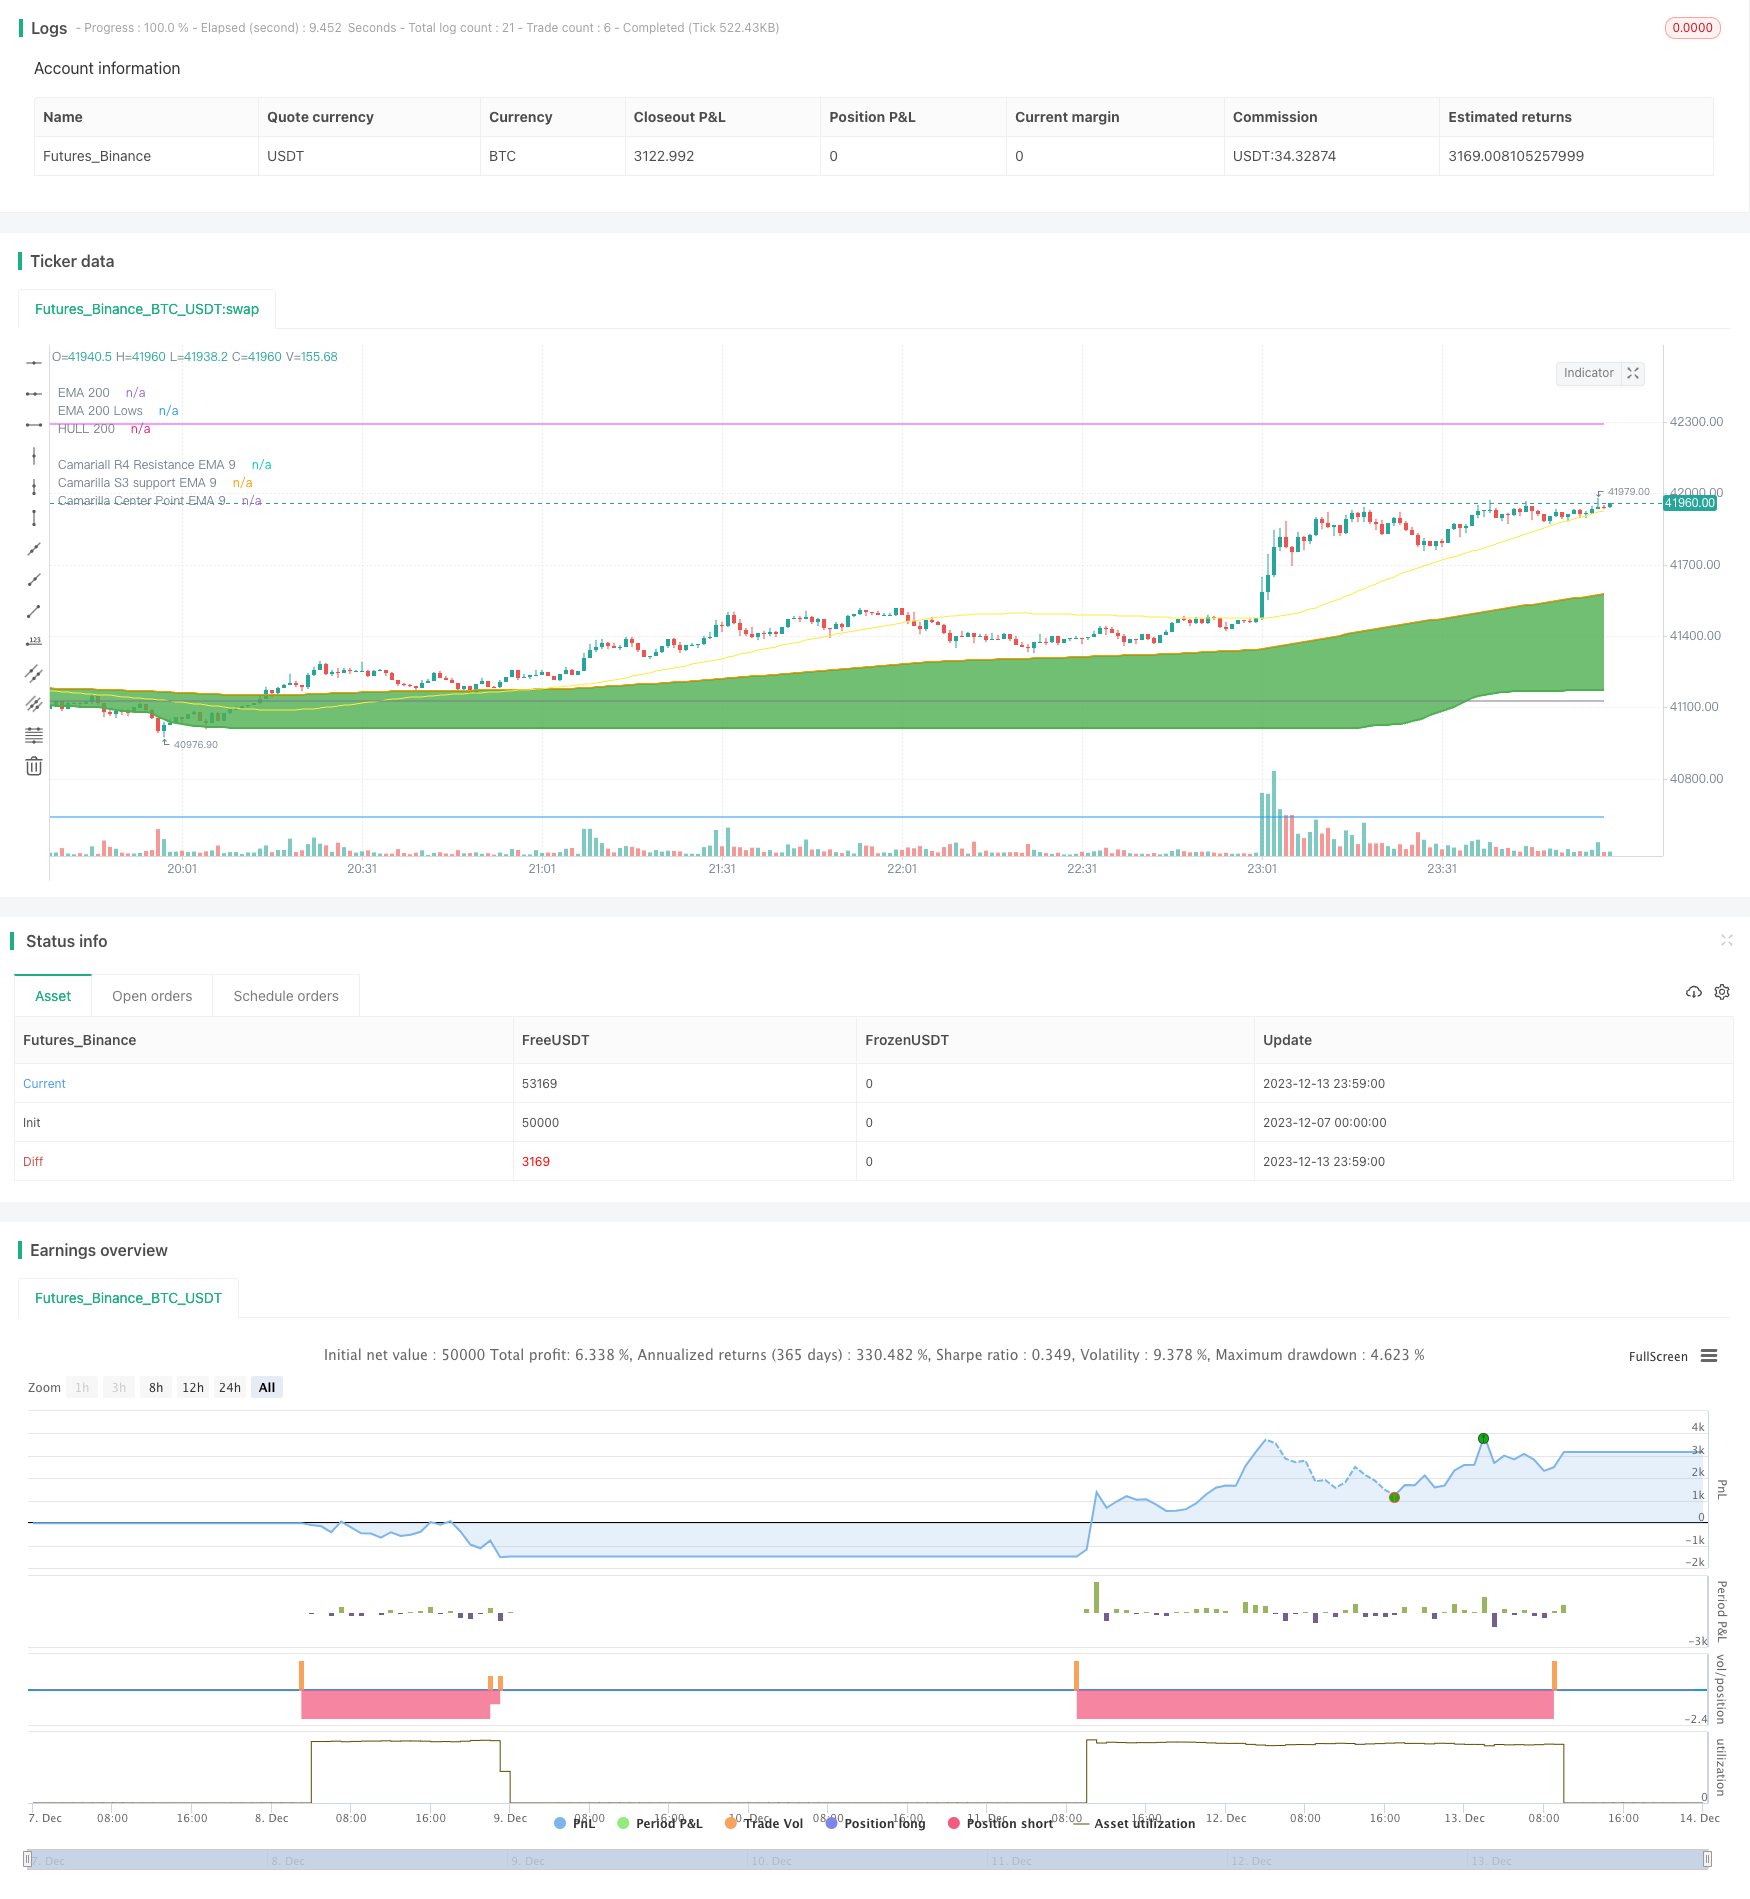
Overview
This strategy is based on market bottoms for reversal trading. It uses the lowest points of the 200-day EMA combined with Camarilla support/resistance levels to determine market bottoms. It goes long when prices bounce back.
Strategy Logic
- Calculate the lowest price EMA200Lows of the 200-day EMA. When prices close below this EMA, the market is considered near the bottom.
- Calculate the 9-day EMA of Camarilla support level 3 (S3), ema_s3_9, as an important support level.
- Also calculate the 9-day EMA of the Camarilla midpoint ema_center_9 as the signal for reversal.
- When ema_center_9 crosses over ema200Lows, and the last 3 bars are lower than ema200Lows, go long.
- Use ATR trailing stop loss to lock profit, tracking the lowest price.
- Profit targets are ema_h4_9 (Camarilla Resistance Level 4) and ema_s3_9.
Advantage Analysis
- The 200-day EMA lowest price avoids taking positions before the actual bottom.
- Camarilla levels combined with the midpoint identifies reversals reliably.
- ATR stop loss is more reasonable. Tracking lower prices allows bigger profit.
Risk Analysis
- Long holding periods increase risk. This strategy favors short-term trading.
- Large market moves can result in big stop loss. Adjust ATR parameters accordingly.
- Camarilla reversal signals are not always accurate. Expect some whipsaws.
Optimization Directions
- Consider adding indicators like RSI to supplement reversal signals.
- Research optimal parameters for different products.
- Explore machine learning for dynamic ATR stop loss.
Summary
This strategy identifies market bottoms and reversals using EMA lows and Camarilla levels. It locks in profits with ATR trailing stops. Overall it is fairly complete with practical value. Further optimizations will improve robustness.
Parameters
| Name | Default | What it controls |
|---|---|---|
| v_input_1 | 200 | EMA 1 Length |
| v_input_2 | 50 | EMA 2 Length |
| v_input_3 | 20 | EMA 3 Length |
| v_input_4_hlc3 | 0 | Source for Highs: hlc3 | high | low | open | hl2 | close | hlcc4 | ohlc4 |
| v_input_5_hlc3 | 0 | Source for Lows: hlc3 | high | low | open | hl2 | close | hlcc4 | ohlc4 |
| v_input_6 | 7 | HiLo Band Length |
| v_input_7 | 14 | ATR Length |
| v_input_8 | 3.5 | ATR Multiplier |
| v_input_9 | 0 | Pivot Resolution: D | W | M |
Source Pine Script
/*backtest
start: 2023-12-07 00:00:00
end: 2023-12-14 00:00:00
period: 1m
basePeriod: 1m
exchanges: [{"eid":"Futures_Binance","currency":"BTC_USDT"}]
*/

// This source code is subject to the terms of the Mozilla Public License 2.0 at https://mozilla.org/MPL/2.0/
// © mohanee

//Using the lowest of low of ema200, you can find the bottom
//wait for price to close below ema200Lows line
//when pivot

//@version=4
strategy(title="PickingupFromBottom Strategy", overlay=true )  //default_qty_value=10, default_qty_type=strategy.fixed,

//HMA
HMA(src1, length1) =>  wma(2 * wma(src1, length1/2) - wma(src1, length1), round(sqrt(length1)))


//variables BEGIN
length1=input(200,title="EMA 1 Length")
length2=input(50,title="EMA 2 Length")
length3=input(20,title="EMA 3 Length")

sourceForHighs= input(hlc3, title="Source for Highs", type=input.source)
sourceForLows = input(hlc3, title="Source for Lows" , type=input.source)

hiLoLength=input(7, title="HiLo Band Length")

atrLength=input(14, title="ATR Length")
atrMultiplier=input(3.5, title="ATR Multiplier")

//takePartialProfits = input(true, title="Take Partial Profits (if this selected, RSI 13 higher reading over 80 is considered for partial closing ) ")


ema200=ema(close,length1)
hma200=HMA(close,length1)


////Camarilla pivot points
//study(title="Camarilla Pivots", shorttitle="Camarilla", overlay=true)
t = input(title = "Pivot Resolution", defval="D", options=["D","W","M"])

//Get previous day/week bar and avoiding realtime calculation by taking the previous to current bar
sopen = security(syminfo.tickerid, t, open[1], barmerge.gaps_off, barmerge.lookahead_on)
shigh = security(syminfo.tickerid, t, high[1], barmerge.gaps_off, barmerge.lookahead_on)
slow = security(syminfo.tickerid, t, low[1], barmerge.gaps_off, barmerge.lookahead_on)
sclose = security(syminfo.tickerid, t, close[1], barmerge.gaps_off, barmerge.lookahead_on)
r = shigh-slow

//Calculate pivots
//center=(sclose)
//center=(close[1] + high[1] + low[1])/3
center=sclose - r*(0.618)

h1=sclose + r*(1.1/12)
h2=sclose + r*(1.1/6)
h3=sclose + r*(1.1/4)
h4=sclose + r*(1.1/2)
h5=(shigh/slow)*sclose
l1=sclose - r*(1.1/12)
l2=sclose - r*(1.1/6)
l3=sclose - r*(1.1/4)
l4=sclose - r*(1.1/2)
l5=sclose - (h5-sclose)

//Colors (<ternary conditional operator> expression prevents continuous lines on history)
c5=sopen != sopen[1] ? na : color.red
c4=sopen != sopen[1] ? na : color.purple
c3=sopen != sopen[1] ? na : color.fuchsia
c2=sopen != sopen[1] ? na : color.blue
c1=sopen != sopen[1] ? na : color.gray
cc=sopen != sopen[1] ? na : color.blue

//Plotting
//plot(center, title="Central",color=color.blue, linewidth=2)
//plot(h5, title="H5",color=c5, linewidth=1)
//plot(h4, title="H4",color=c4, linewidth=2)
//plot(h3, title="H3",color=c3, linewidth=1)
//plot(h2, title="H2",color=c2, linewidth=1)
//plot(h1, title="H1",color=c1, linewidth=1)
//plot(l1, title="L1",color=c1, linewidth=1)
//plot(l2, title="L2",color=c2, linewidth=1)
//plot(l3, title="L3",color=c3, linewidth=1)
//plot(l4, title="L4",color=c4, linewidth=2)
//plot(l5, title="L5",color=c5, linewidth=1)////Camarilla pivot points

ema_s3_9=ema(l3, 9)
ema_s3_50=ema(l3, 50)
ema_h4_9=ema(h4, 9)

ema_center_9=ema(center, 9)


plot(ema_h4_9, title="Camariall R4 Resistance EMA 9", color=color.fuchsia)
plot(ema_s3_9, title="Camarilla S3 support EMA 9", color=color.gray, linewidth=1)

//plot(ema_s3_50, title="Camarilla S3 support EMA 50", color=color.green, linewidth=2)

plot(ema_center_9, title="Camarilla Center Point EMA 9", color=color.blue)


plot(hma200, title="HULL 200", color=color.yellow,  transp=25)
plotEma200=plot(ema200, title="EMA 200",  style=plot.style_linebr, linewidth=2 , color=color.orange)

ema200High = ema(highest(sourceForHighs,length1), hiLoLength)
ema200Low= ema(lowest(sourceForLows,length1), hiLoLength)

ema50High = ema(highest(sourceForHighs,length2), hiLoLength)
ema50Low= ema(lowest(sourceForLows,length2), hiLoLength)

ema20High = ema(highest(sourceForHighs,length3), hiLoLength)
ema20Low= ema(lowest(sourceForLows,length3), hiLoLength)

//plot(ema200High, title="EMA 200 Highs", linewidth=2, color=color.orange, transp=30)
plotEma200Low=plot(ema200Low, title="EMA 200 Lows", linewidth=2, color=color.green, transp=30, style=plot.style_linebr)

//plot(ema50High, title="EMA 50 Highs", linewidth=2, color=color.blue, transp=30)
//plotEma50Low=plot(ema50Low, title="EMA 50 Lows", linewidth=2, color=color.blue, transp=30)


fill(plotEma200, plotEma200Low, color=color.green )


// Drawings /////////////////////////////////////////


//Highlight when centerpont crossing up ema200Low a
ema200LowBuyColor=color.new(color.green, transp=50)
bgcolor(crossover(ema_center_9,ema200Low) and (close[1]<ema200Low or close[2]<ema200Low or close[3]<ema200Low)? ema200LowBuyColor : na)
//ema200LowBuyCondition= (close[1]<ema200Low or close[2]<ema200Low or close[3]<ema200Low)
strategy.entry(id="ema200Low Buy", comment="LE2", qty=2, long=true,  when= crossover(ema_center_9,ema200Low) and (close[1]<ema200Low or close[2]<ema200Low or close[3]<ema200Low) )  //or (close>open and low<ema20Low and close>ema20Low) ) )     //  // aroonOsc<0


//Trailing StopLoss
////// Calculate trailing SL
/////////////////////////////////////////////////////
sl_val = atrMultiplier * atr(atrLength)


trailing_sl = 0.0
//trailing_sl :=   max(low[1]  - sl_val, nz(trailing_sl[1]))
trailing_sl :=   strategy.position_size>=1 ?  max(low  - sl_val, nz(trailing_sl[1])) :  na

//draw initil stop loss
//plot(strategy.position_size>=1 ? trailing_sl : na, color = color.blue , style=plot.style_linebr,  linewidth = 2, title = "stop loss")
plot(trailing_sl, title="ATR Trailing Stop Loss", style=plot.style_linebr, linewidth=1, color=color.red, transp=30)
//Trailing StopLoss
////// Calculate trailing SL
/////////////////////////////////////////////////////


strategy.close(id="ema200Low Buy", comment="TP1="+tostring(close - strategy.position_avg_price, "####.##"), qty=1, when=abs(strategy.position_size)>=1 and crossunder(close, ema_h4_9)  )  //close<ema55 and rsi5Val<20 //ema34<ema55  //close<ema89
strategy.close(id="ema200Low Buy", comment="TP2="+tostring(close - strategy.position_avg_price, "####.##"),  qty=1, when=abs(strategy.position_size)>=1 and crossunder(close, ema_s3_9)  )  //close<ema55 and rsi5Val<20 //ema34<ema55  //close<ema89
Published by ChaoZhang on the FMZ strategy square · last modified 2023-12-15. Collected in the Quant Trading Vault. Unvalidated research: re-test with your own data and costs before trusting it.
Build this with AgenKit
A spec is not a trading system. Paste this into your coding agent and AgenKit runs a specialist team — architecture, test-first build, risk gates, review — with paper trading on by default.
/agenkit build a production-grade trading bot with a backtest engine, risk controls and paper trading by default from strategies/Bottom-Reversal-Strategy.md- npx agenkit install engineering-kit in your project
- Paste the command into your agent and approve each phase
- Get tests, backtest, risk controls and a paper-trading switch
Understand it first
Before you run this, read the lesson behind the idea and how to backtest it honestly. Specs like this one are the survivors of an unknown number of trials; deflate their results accordingly.
Related specs
- Advanced Momentum EMA Trend Following with RSI Overbought Oversold Trading StrategyPine Script · Mean reversion · 1d
- Oma and Apollo Dual Rail Trading StrategyPine Script · Mean reversion · 5m
- Bollinger Bands Trend Reversal StrategyPine Script · Mean reversion · 10m
- MACD RSI and EMA StrategyPine Script · Mean reversion · 1d
- RSI Divergence StrategyPine Script · Mean reversion · 30m
- ATR and EMA based Dynamic Take Profit and Stop Loss Adaptive StrategyPine Script · Mean reversion · 1h