Breakthrough Highs and Lows Backtesting Strategy
This strategy judges trend direction based on breaking through periodic highs and lows. It goes long when price breaks through the periodic high and goes short when price breaks below the periodic low. It belongs to…
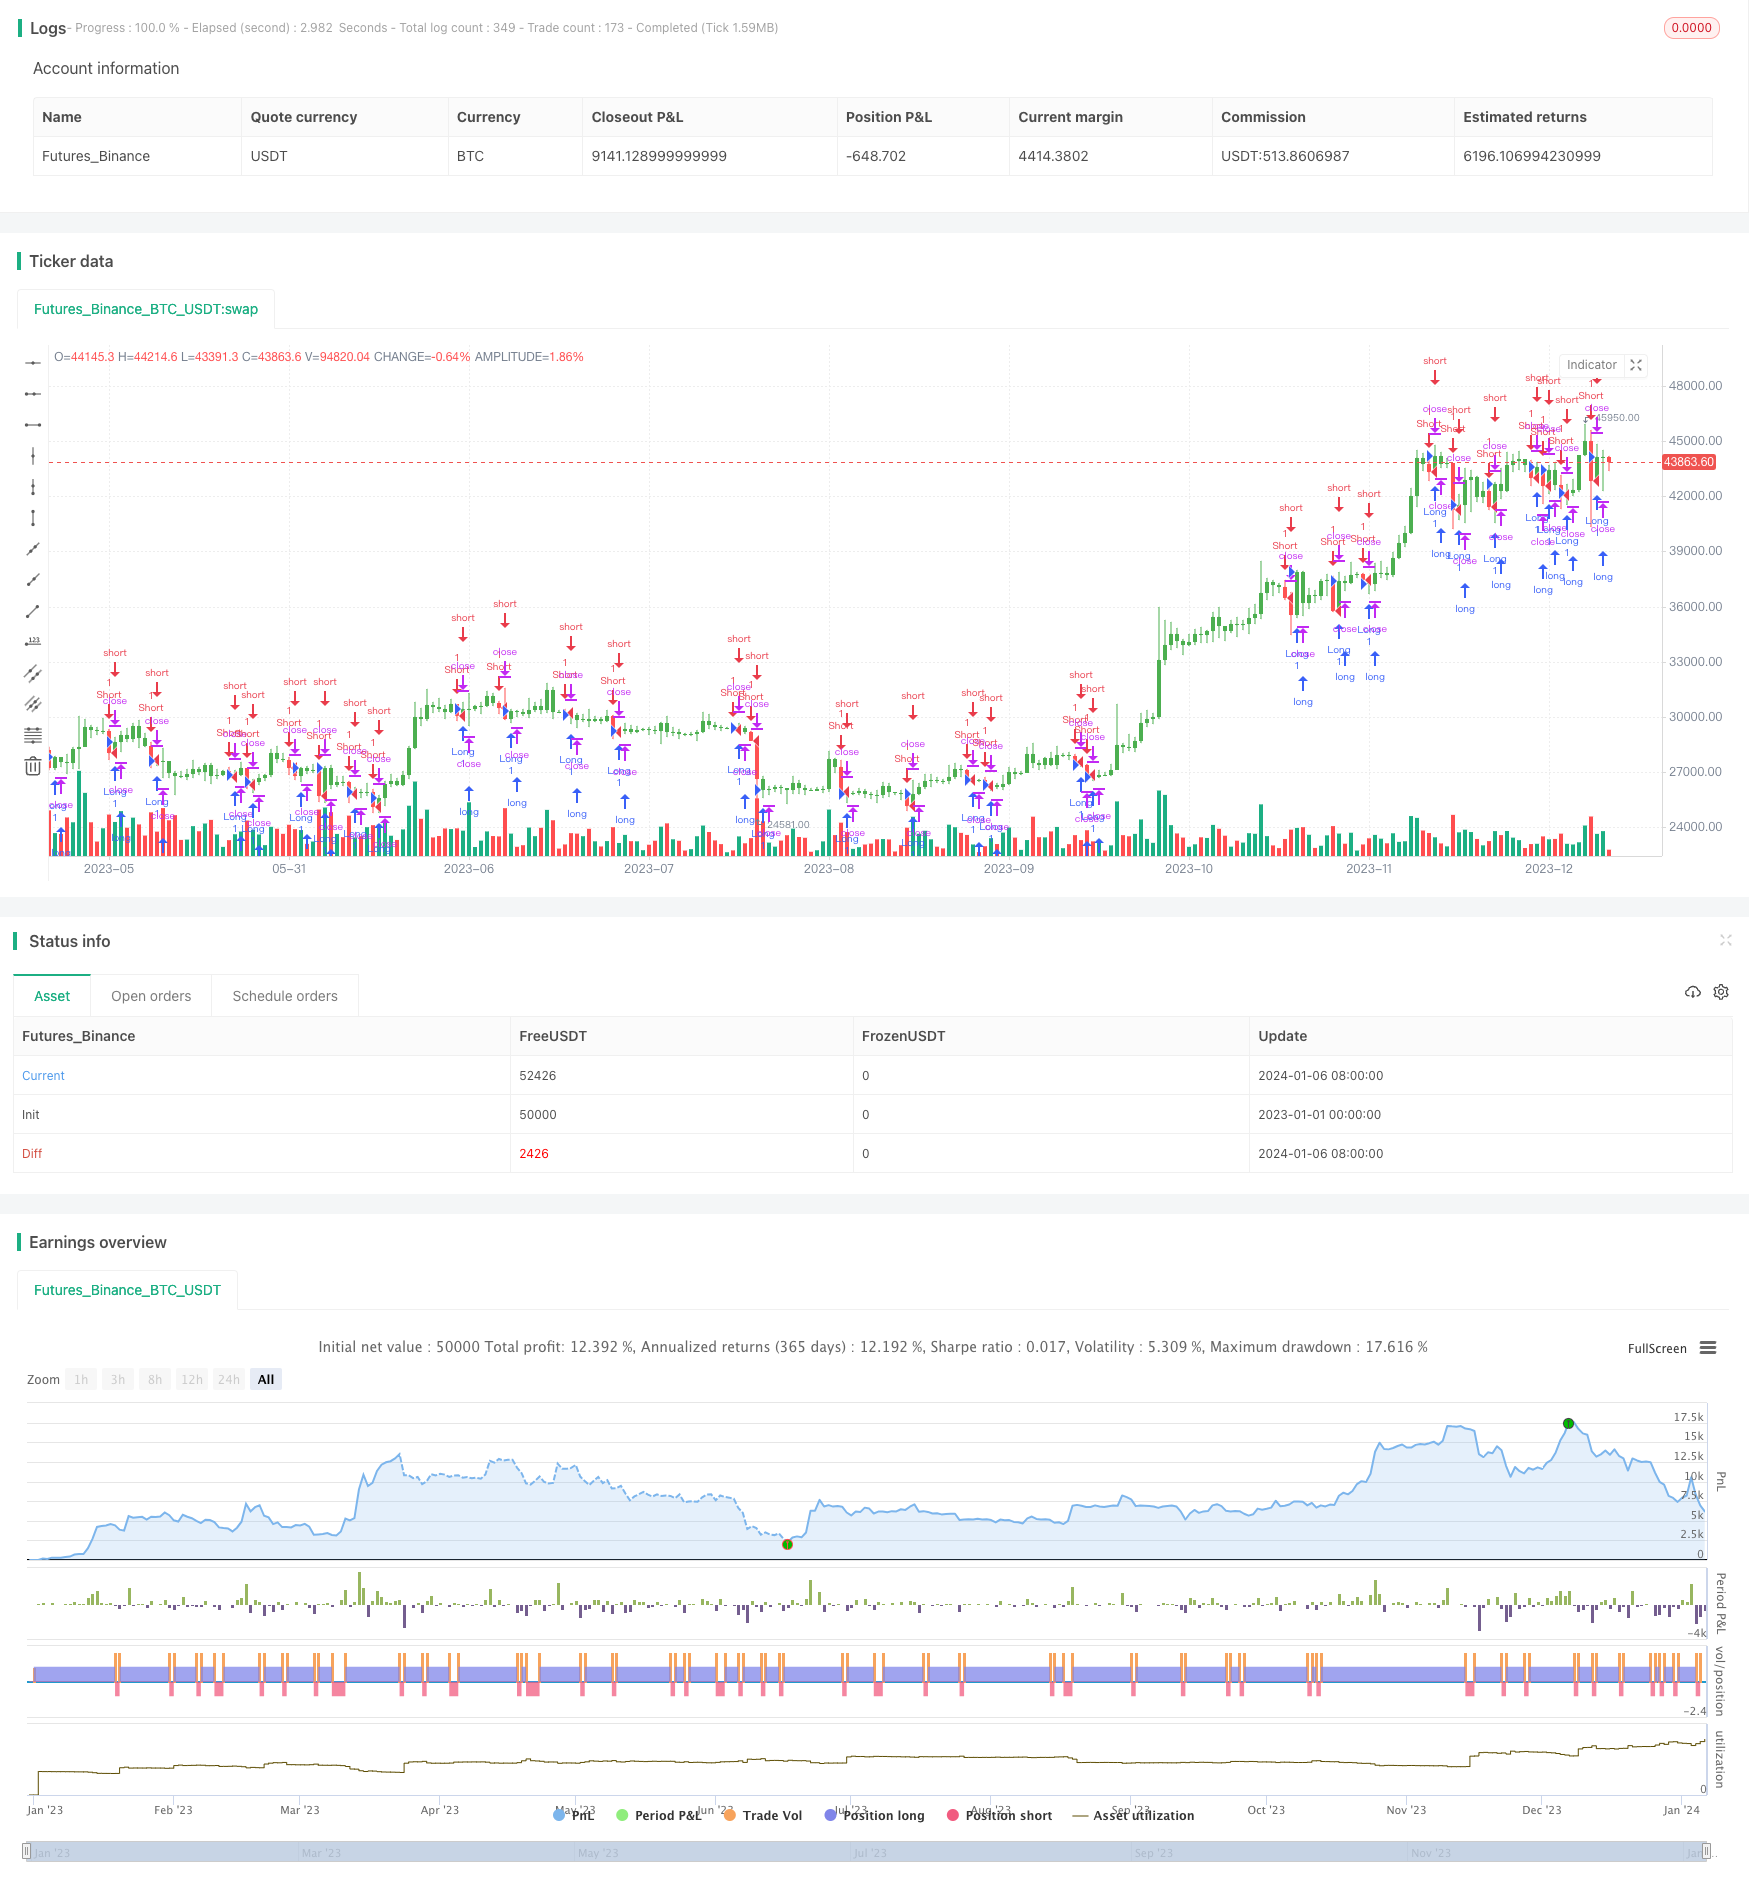
Overview
This strategy judges trend direction based on breaking through periodic highs and lows. It goes long when price breaks through the periodic high and goes short when price breaks below the periodic low. It belongs to the trend tracking strategy.
Principle
The strategy first reads the user-defined cycle (daily, weekly, etc.) and lookback periods. Then it gets the highest and lowest prices for the lookback period based on these parameters. For example, if it is set to daily cycle and lookback 1 period, it takes the highest and lowest prices for the previous day.
In actual trading, if the closing price is greater than or equal to the lowest price of the lookback period, it is judged as an upward breakthrough and it goes long. If the closing price is less than or equal to the highest price of the lookback period, it is judged as a downward breakthrough and it goes short.
By capturing the trend direction through breaking through periodic highs and lows, this strategy belongs to a kind of trend tracking strategy.
Advantage Analysis
The main advantages of this strategy are:
Capturing the big trend after strong consolidation by judging direction based on breakthrough points.
Simple and easy to understand, very suitable for beginners to learn and use.
Easy to optimize by adjusting periodic parameters, applicable to different varieties.
Can set reverse input for reverse operation, enriching strategy use.
Drawing periodic highs and lows to assist judgement and form multi-validation.
Risk Analysis
There are also some risks:
Cannot effectively filter sideways volatility, possible multiple mis-operations.
Cannot control stop loss, certain degree of loss risk exists.
Sensitive to trading costs, actual PnL may deviate.
Cannot limit position size, over-trading risk exists.
To address these risks, methods like setting stop loss, optimizing filter conditions, controlling position size can be used.
Optimization
The main optimization directions are:
Adding filter mechanisms to avoid frequent opening during sideways. Set price channel, volatility filters etc.
Set trailing stop loss or time stop loss to control single loss risk and ensure overall profitability.
Optimize position sizing and money management to prevent over-trading and ensure stability.
Test effects of different periodic parameters and select optimal parameter combinations.
Increase algorithmic trading modules, use machine learning algorithms to improve decision efficiency.
Summary
In summary, this breakthrough high low backtest strategy is simple to operate based on trend tracking, suitable for beginners to learn, but risks being trapped exist. By adding optimizations like filters, stops, position control, these risks can be reduced and strategy results improved. It can provide ideas and references for our further research and improvements.
Parameters
| Name | Default | What it controls |
|---|---|---|
| v_input_1 | D | SelectPeriod |
| v_input_2 | true | LookBack |
| v_input_3 | false | Trade reverse |
Source Pine Script
/*backtest
start: 2023-01-01 00:00:00
end: 2024-01-07 00:00:00
period: 1d
basePeriod: 1h
exchanges: [{"eid":"Futures_Binance","currency":"BTC_USDT"}]
*/

//@version=2
////////////////////////////////////////////////////////////
//  Copyright by HPotter v1.0 03/07/2018
// This script shows a high and low period value.
//    Width - width of lines
//    SelectPeriod - Day or Week or Month and etc.
//    LookBack - Shift levels 0 - current period, 1 - previous and etc.
//
// You can change long to short in the Input Settings
// WARNING:
// - For purpose educate only
// - This script to change bars colors.
////////////////////////////////////////////////////////////
strategy(title="High and Low Levels Backtest", shorttitle="HL Levels", overlay = true)
SelectPeriod = input("D", defval="D")
LookBack = input(1,  minval=0)
reverse = input(false, title="Trade reverse")
xHigh  = request.security(syminfo.tickerid, SelectPeriod, high[LookBack])
xLow   = request.security(syminfo.tickerid, SelectPeriod, low[LookBack])
vS1 = xHigh
vR1 = xLow
pos = iff(close > vR1, 1,
       iff(close < vS1, -1, nz(pos[1], 0)))
possig = iff(reverse and pos == 1, -1,
          iff(reverse and pos == -1, 1, pos))
if (possig == 1)
    strategy.entry("Long", strategy.long)
if (possig == -1)
    strategy.entry("Short", strategy.short)
barcolor(possig == -1 ? red: possig == 1 ? green : blue )
Published by ChaoZhang on the FMZ strategy square · last modified 2024-01-08. Collected in the Quant Trading Vault. Unvalidated research: re-test with your own data and costs before trusting it.
Build this with AgenKit
A spec is not a trading system. Paste this into your coding agent and AgenKit runs a specialist team — architecture, test-first build, risk gates, review — with paper trading on by default.
/agenkit build a production-grade trading bot with a backtest engine, risk controls and paper trading by default from strategies/Breakthrough-Highs-and-Lows-Backtesting-Strategy.md- npx agenkit install engineering-kit in your project
- Paste the command into your agent and approve each phase
- Get tests, backtest, risk controls and a paper-trading switch
Understand it first
Before you run this, read the lesson behind the idea and how to backtest it honestly. Specs like this one are the survivors of an unknown number of trials; deflate their results accordingly.
Related specs
- 5 Day Moving Average Channel Breakout Strategy Combined With Mileage ConceptPine Script · Breakout · 1d
- ATR Trailing Stops StrategyPine Script · Breakout · 1h
- ATR Trend Breakout StrategyPine Script · Breakout · 1d
- Adaptive Bollinger Breakout with Moving Average Quantitative Strategy SystemPine Script · Breakout · 1h
- Adaptive Channel Breakout StrategyPine Script · Breakout · 1d
- Adaptive Multi Period Trading Strategy Based on Wave Trend Momentum BreakoutPine Script · Breakout · 2h