Strategy vault / Machine learning
Bull Bear Power Trading Strategy with Volume Percentile Based Dynamic Take Profit System
This strategy combines the Bull Bear Power (BBP) indicator with a multi-level dynamic take-profit system based on volume percentiles. It creates an adaptive and risk-controlled trading system through…
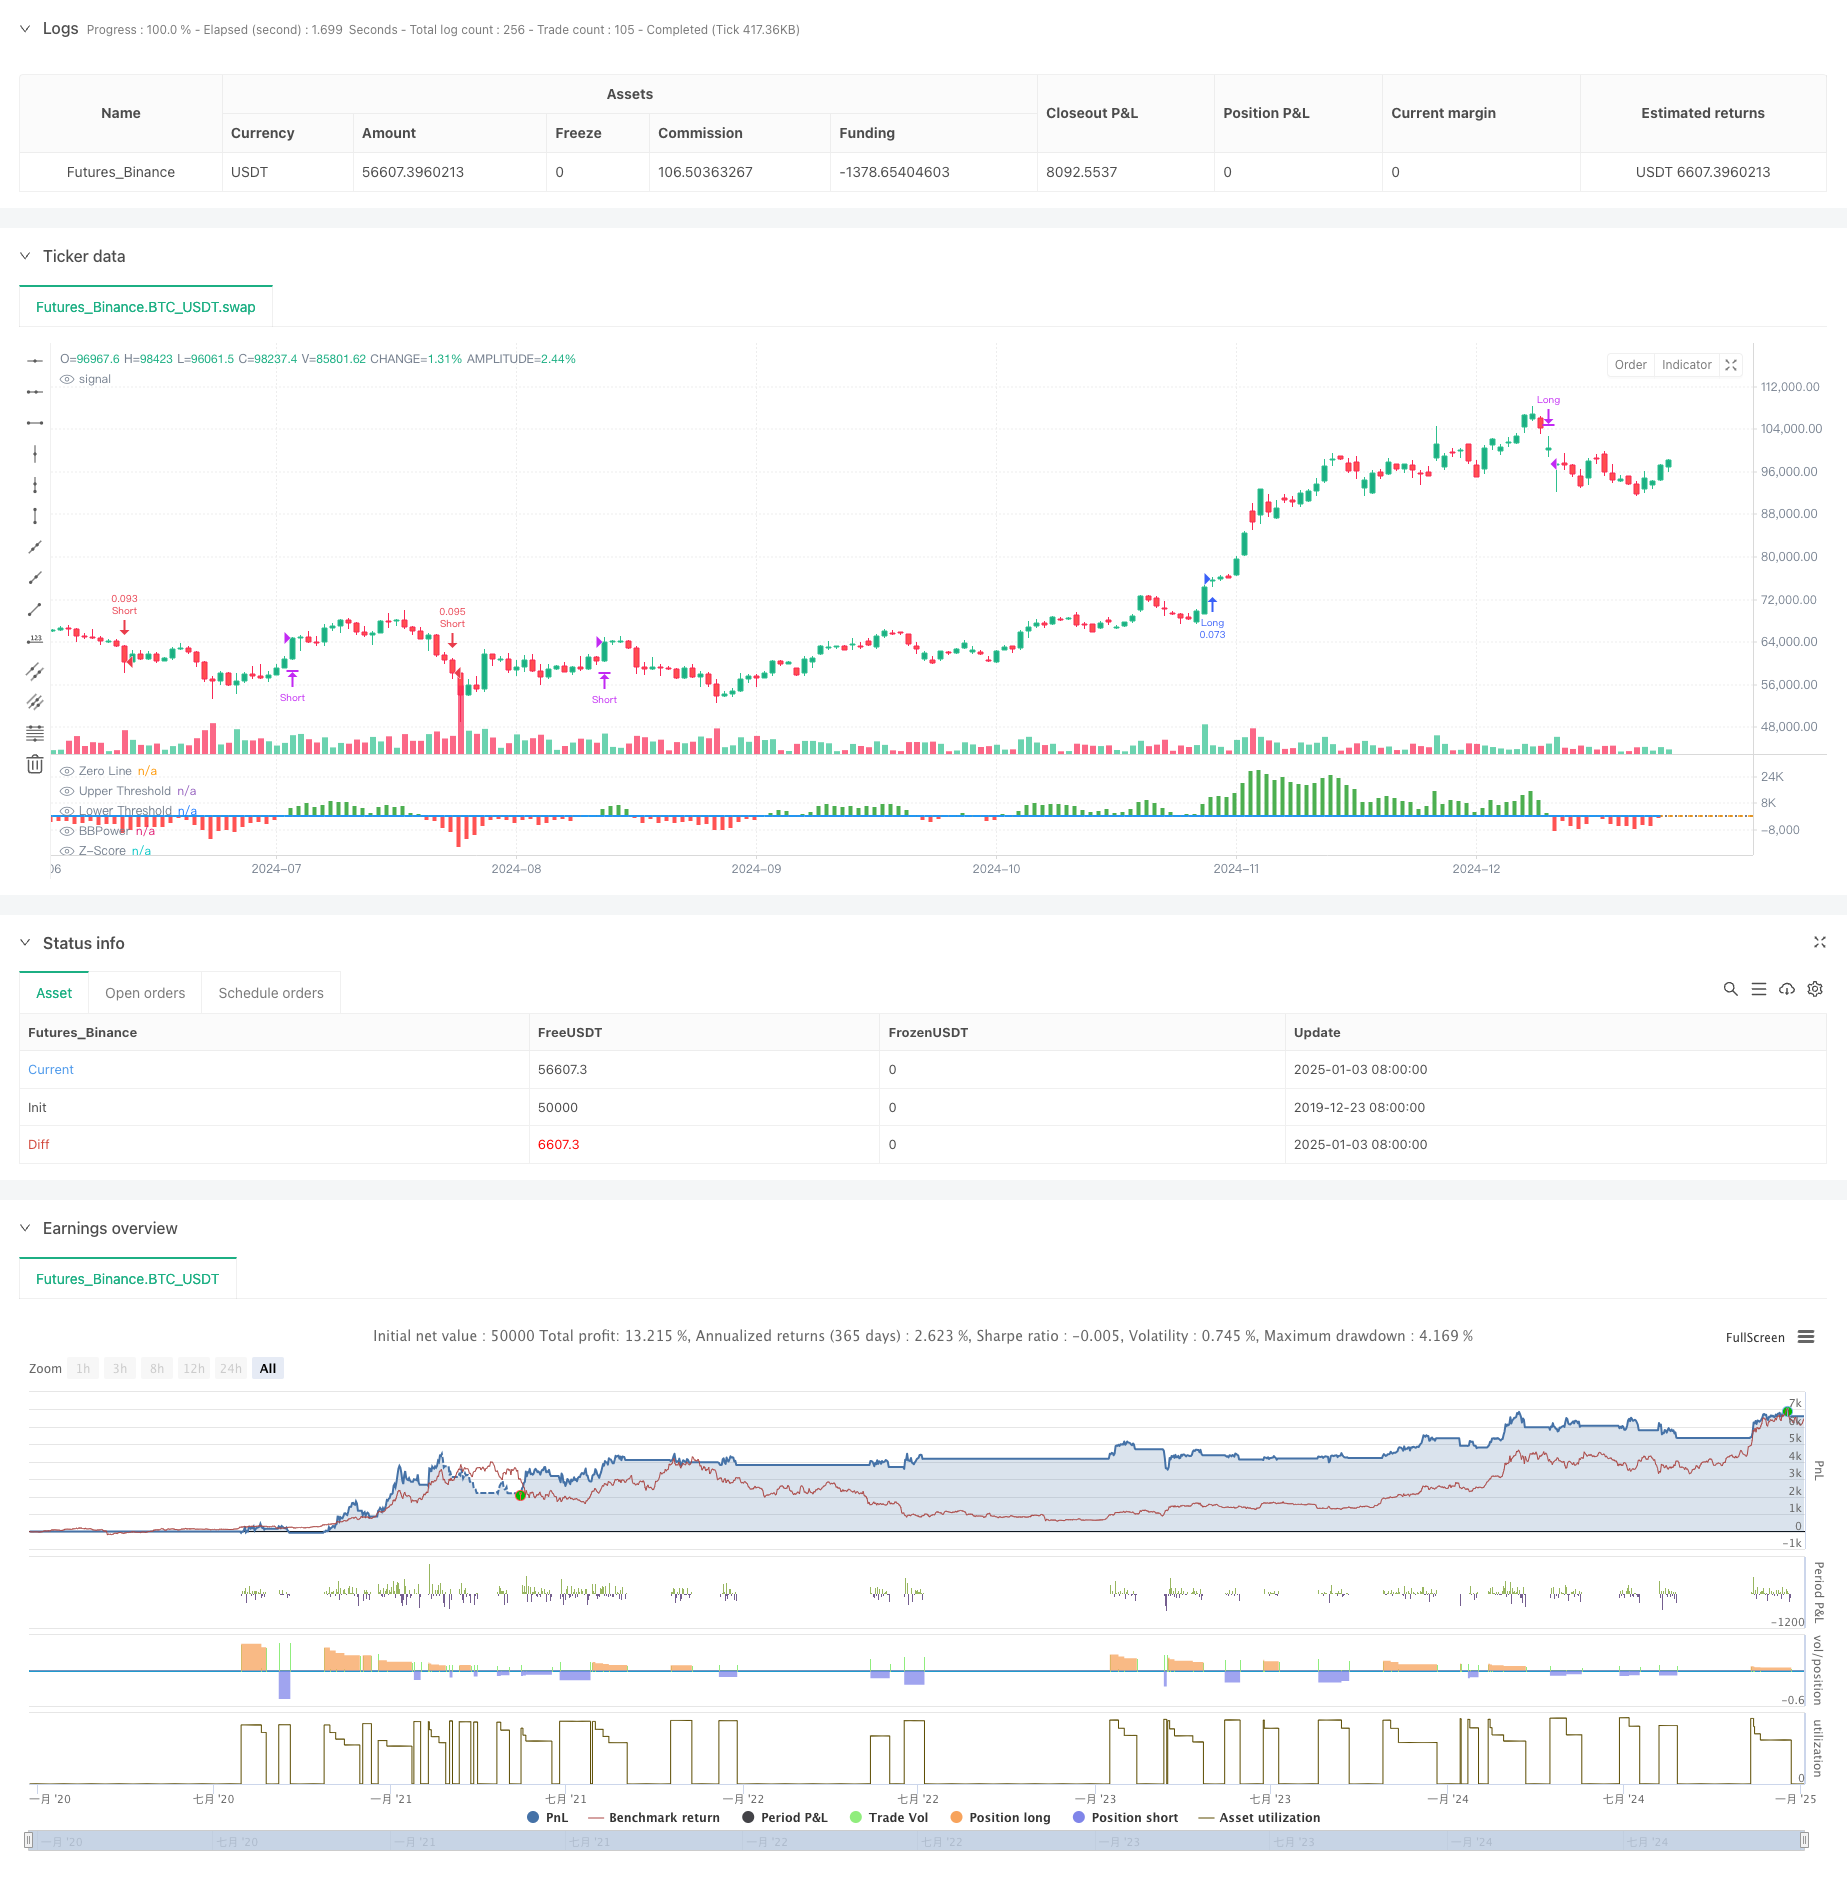
Overview
This strategy combines the Bull Bear Power (BBP) indicator with a multi-level dynamic take-profit system based on volume percentiles. It creates an adaptive and risk-controlled trading system through multi-dimensional analysis of price, volume, and momentum data. The core logic includes using the Z-Score normalized BBP values as trade signal triggers, while incorporating volume percentile analysis for dynamic take-profit adjustments.
Strategy Principles
The core calculations include several key components:
- BBP Indicator: Measures market force balance by summing the difference between high price and EMA (bull power) and low price and EMA (bear power).
- Z-Score Normalization: Standardizes BBP values to assess market strength deviation levels.
- Volume Analysis: Calculates current volume relative to moving average to gauge market activity.
- Percentile Analysis: Computes historical percentiles of price and volume for market state probability distribution.
- Dynamic Take-Profit: Adjusts take-profit levels based on composite scoring of ATR, volume percentile, and price percentile.
Strategy Advantages
- Multi-dimensional Analysis: Provides comprehensive market perspective through price momentum, volume, and market positioning.
- High Adaptability: Adapts to different market environments through dynamic take-profit mechanism.
- Risk Diversification: Implements multi-level take-profit strategy for profit realization at different price levels.
- Statistical Edge: Achieves significant advantage through Z-Score and percentile analysis.
- Extensibility: Framework allows easy addition of new analysis dimensions.
Strategy Risks
- Parameter Sensitivity: Multiple parameters require optimization for different market environments.
- Market Environment Dependency: May underperform during volatile periods or trend transitions.
- Execution Slippage: Multi-level take-profit orders may face execution slippage.
- Computational Complexity: Real-time calculation of multiple indicators may cause system load.
- False Signal Risk: May generate incorrect trading signals in ranging markets.
Optimization Directions
- Parameter Adaptation: Introduce machine learning methods for automatic parameter optimization.
- Market Prediction: Add market environment classification module for early identification of adverse conditions.
- Stop-Loss Optimization: Implement dynamic stop-loss mechanism for improved risk control.
- Signal Filtering: Add trend strength filters to reduce false signals.
- Position Management: Optimize position allocation algorithm for improved capital efficiency.
Summary
This strategy combines traditional BBP indicator with modern quantitative analysis methods to create a trading system with solid theoretical foundation and strong practicality. It achieves good balance between returns and risk through multi-level take-profit and dynamic adjustment mechanisms. While parameter optimization presents some challenges, the strategy framework's extensibility provides ample room for future improvements. In practical application, traders should make specific adjustments based on market characteristics and individual risk preferences.
Source Pine Script
/*backtest
start: 2019-12-23 08:00:00
end: 2025-01-04 08:00:00
period: 1d
basePeriod: 1d
exchanges: [{"eid":"Futures_Binance","currency":"BTC_USDT"}]
*/

// This Pine Script™ code is subject to the terms of the Mozilla Public License 2.0 at https://mozilla.org/MPL/2.0/
// © PresentTrading

// The BBP Strategy with Volume-Percentile TP by PresentTrading emerges as a sophisticated approach that integrates multiple analytical layers to enhance trading precision and profitability.
// Unlike traditional strategies that rely solely on price movements or volume indicators, this strategy synergizes Bollinger Bands Power (BBP) with volume percentile analysis to determine optimal entry and exit points. Additionally, it employs a dynamic take-profit mechanism based on ATR (Average True Range) multipliers adjusted by volume and percentile factors, ensuring adaptability to varying market conditions.
// This multi-faceted approach not only enhances signal accuracy but also optimizes risk management, setting it apart from conventional trading methodologies.

//@version=5
strategy("BBP Strategy with Volume-Percentile TP - Strategy [presentTrading] ", overlay=false, precision=3, commission_value= 0.1, commission_type=strategy.commission.percent, slippage= 1, currency=currency.USD, default_qty_type = strategy.percent_of_equity, default_qty_value = 10, initial_capital=10000)


// --------
// Bull Bear Power Strategy Settings
// --------
lengthInput = input.int(21, "EMA Length")
zLength     = input.int(252, "Z-Score Length")
zThreshold  = input.float(1.618, "Z-Score Threshold")

// --------
// Take Profit Settings
// --------
tp_group = "Take Profit Settings"
// Enable/disable take profit function
useTP = input.bool(true, "Use Take Profit", group=tp_group)

// === ATR Base Settings ===
// ATR calculation period for determining base price movement range
baseAtrLength = input.int(20, "ATR Period", minval=1, group=tp_group, tooltip="ATR period for calculating base price movement range. Shorter periods are more sensitive to recent volatility")

// === Take Profit Multiplier Settings ===
// First take profit ATR multiplier, usually the most conservative target
atrMult1 = input.float(1.618, "TP1 ATR Multiplier", minval=0.1, step=0.1, group=tp_group, tooltip="First take profit level ATR multiplier, recommended 1.5-2.0")
// Second take profit ATR multiplier, medium profit target
atrMult2 = input.float(2.382, "TP2 ATR Multiplier", minval=0.1, step=0.1, group=tp_group, tooltip="Second take profit level ATR multiplier, recommended 2.5-3.0")
// Third take profit ATR multiplier, most aggressive target
atrMult3 = input.float(3.618, "TP3 ATR Multiplier", minval=0.1, step=0.1, group=tp_group, tooltip="Third take profit level ATR multiplier, recommended 4.0-5.0")

// === Position Size Allocation ===
// First take profit position size, usually larger for securing basic profits
tp1_size = input.float(13, "TP1 Position %", minval=1, maxval=100, group=tp_group, tooltip="Position size percentage for first take profit, recommended 30-40%")
// Second take profit position size, medium allocation
tp2_size = input.float(13, "TP2 Position %", minval=1, maxval=100, group=tp_group, tooltip="Position size percentage for second take profit, recommended 30-40%")
// Third take profit position size, usually smaller for catching larger moves
tp3_size = input.float(13, "TP3 Position %", minval=1, maxval=100, group=tp_group, tooltip="Position size percentage for third take profit, recommended 20-30%")

// --------
// Volume Analysis Settings
// --------
vol_group = "Volume Analysis Settings"
// Volume MA period for determining relative volume levels
vol_period = input.int(100, "Volume MA Period", minval=1, group=vol_group, tooltip="Period for calculating volume moving average, recommended 20-30")

// === Volume Level Thresholds ===
// High volume threshold relative to MA
vol_high = input.float(2.0, "High Volume Multiplier", minval=1.0, step=0.1, group=vol_group, tooltip="High volume threshold multiplier, typically 2x MA or above")
// Medium volume threshold
vol_med = input.float(1.5, "Medium Volume Multiplier", minval=1.0, step=0.1, group=vol_group, tooltip="Medium volume threshold multiplier, typically around 1.5x MA")
// Low volume threshold
vol_low = input.float(1.0, "Low Volume Multiplier", minval=0.5, step=0.1, group=vol_group, tooltip="Low volume threshold multiplier, typically around 1x MA")

// === Volume Adjustment Factors ===
// High volume adjustment factor, usually extends take profit targets
vol_high_mult = input.float(1.5, "High Volume Factor", minval=0.1, step=0.1, group=vol_group, tooltip="Take profit adjustment factor for high volume")
// Medium volume adjustment factor
vol_med_mult = input.float(1.3, "Medium Volume Factor", minval=0.1, step=0.1, group=vol_group, tooltip="Take profit adjustment factor for medium volume")
// Low volume adjustment factor
vol_low_mult = input.float(1.0, "Low Volume Factor", minval=0.1, step=0.1, group=vol_group, tooltip="Take profit adjustment factor for low volume")

// --------
// Percentile Analysis Settings
// --------
perc_group = "Percentile Analysis Settings"
// Percentile calculation period for evaluating price position
perc_period = input.int(100, "Percentile Period", minval=20, group=perc_group, tooltip="Historical period for percentile calculations, recommended 100-200")

// === Percentile Thresholds ===
// High percentile threshold, typically indicates relative high levels
perc_high = input.float(90, "High Percentile", minval=50, maxval=100, group=perc_group, tooltip="High level percentile threshold, typically above 90")
// Medium percentile threshold
perc_med = input.float(80, "Medium Percentile", minval=50, maxval=100, group=perc_group, tooltip="Medium level percentile threshold, typically around 80")
// Low percentile threshold
perc_low = input.float(70, "Low Percentile", minval=0, maxval=100, group=perc_group, tooltip="Low level percentile threshold, typically around 70")

// === Percentile Adjustment Factors ===
// High percentile adjustment factor
perc_high_mult = input.float(1.5, "High Percentile Factor", minval=0.1, step=0.1, group=perc_group, tooltip="Take profit adjustment factor for high percentile levels")
// Medium percentile adjustment factor
perc_med_mult = input.float(1.3, "Medium Percentile Factor", minval=0.1, step=0.1, group=perc_group, tooltip="Take profit adjustment factor for medium percentile levels")
// Low percentile adjustment factor
perc_low_mult = input.float(1.0, "Low Percentile Factor", minval=0.1, step=0.1, group=perc_group, tooltip="Take profit adjustment factor for low percentile levels")


// --------
// Core Bull Bear Power Calculations
// --------
emaClose  = ta.ema(close, lengthInput)
bullPower = high - emaClose
bearPower = low  - emaClose
bbp       = bullPower + bearPower

bbp_mean  = ta.sma(bbp, zLength)
bbp_std   = ta.stdev(bbp, zLength)
zscore    = (bbp - bbp_mean) / bbp_std

// --------
// Volume & Percentile Analysis
// --------
// Volume analysis
vol_sma = ta.sma(volume, vol_period)
vol_mult = volume / vol_sma

// Percentile calculation
calcPercentile(src) =>
    var values = array.new_float(0)
    array.unshift(values, src)
    if array.size(values) > perc_period
        array.pop(values)
    array.size(values) > 0 ? array.percentrank(values, array.size(values)-1) * 100 : 50

price_perc = calcPercentile(close)
vol_perc = calcPercentile(volume)

// Dynamic take-profit adjustment coefficient calculation
getTpFactor() =>
    vol_score = vol_mult > vol_high ? vol_high_mult : vol_mult > vol_med ? vol_med_mult : vol_mult > vol_low ? vol_low_mult : 0.8
    price_score = price_perc > perc_high ? perc_high_mult :price_perc > perc_med ? perc_med_mult :price_perc > perc_low ? perc_low_mult : 0.8
    math.avg(vol_score, price_score)

// --------
// Entry/Exit Logic
// --------
longCondition  = ta.crossover(zscore,  zThreshold)
shortCondition = ta.crossunder(zscore, -zThreshold)
exitLongCondition  = ta.crossunder(zscore, 0)
exitShortCondition = ta.crossover(zscore,  0)

if (barstate.isconfirmed)
    if longCondition
        strategy.entry("Long", strategy.long)
    if shortCondition
        strategy.entry("Short", strategy.short)
    if exitLongCondition
        strategy.close("Long")
    if exitShortCondition
        strategy.close("Short")

// --------
// Take Profit Execution
// --------
if useTP and strategy.position_size != 0
    base_move = ta.atr(baseAtrLength)
    tp_factor = getTpFactor()
    is_long = strategy.position_size > 0
    entry_price = strategy.position_avg_price

    if is_long
        tp1_price = entry_price + (base_move * atrMult1 * tp_factor)
        tp2_price = entry_price + (base_move * atrMult2 * tp_factor)
        tp3_price = entry_price + (base_move * atrMult3 * tp_factor)

        strategy.exit("TP1", "Long", qty_percent=tp1_size, limit=tp1_price)
        strategy.exit("TP2", "Long", qty_percent=tp2_size, limit=tp2_price)
        strategy.exit("TP3", "Long", qty_percent=tp3_size, limit=tp3_price)
    else
        tp1_price = entry_price - (base_move * atrMult1 * tp_factor)
        tp2_price = entry_price - (base_move * atrMult2 * tp_factor)
        tp3_price = entry_price - (base_move * atrMult3 * tp_factor)

        strategy.exit("TP1", "Short", qty_percent=tp1_size, limit=tp1_price)
        strategy.exit("TP2", "Short", qty_percent=tp2_size, limit=tp2_price)
        strategy.exit("TP3", "Short", qty_percent=tp3_size, limit=tp3_price)

// --------
// Plotting
// --------
plot(bbp, color=bbp >= 0 ? color.new(color.green, 0) : color.new(color.red, 0),
     title="BBPower", style=plot.style_columns)
hline(0, "Zero Line", color=color.gray, linestyle=hline.style_dotted)
plot(zscore, title="Z-Score", color=color.blue, linewidth=2)
hline(zThreshold, "Upper Threshold", color=color.orange, linestyle=hline.style_dashed)
hline(-zThreshold, "Lower Threshold", color=color.orange, linestyle=hline.style_dashed)
Published by ChaoZhang on the FMZ strategy square · last modified 2025-01-06. Collected in the Quant Trading Vault. Unvalidated research: re-test with your own data and costs before trusting it.
Build this with AgenKit
A spec is not a trading system. Paste this into your coding agent and AgenKit runs a specialist team — architecture, test-first build, risk gates, review — with paper trading on by default.
/agenkit build a production-grade trading bot with a backtest engine, risk controls and paper trading by default from strategies/Bull-Bear-Power-Trading-Strategy-with-Volume-Percentile-Based-Dynamic-Take-Profit-System.md- npx agenkit install engineering-kit in your project
- Paste the command into your agent and approve each phase
- Get tests, backtest, risk controls and a paper-trading switch
Understand it first
Before you run this, read the lesson behind the idea and how to backtest it honestly. Specs like this one are the survivors of an unknown number of trials; deflate their results accordingly.
Related specs
- Multi Dynamic Indicator Combination StrategyPine Script · Machine learning · 2d
- Dual Moving Average Matching Strategy Based on Bollinger BandsPine Script · Machine learning · 1h
- Dynamic Price Swing Oscillator StrategyPine Script · Machine learning · 1m
- Market Structure Swing Trading StrategyPine Script · Machine learning · 1d
- Multi indicator Quant Trading StrategyPine Script · Machine learning · 1h
- ADX EFI 50 Moving Average Channel Pullback StrategyPine Script · Machine learning · 1h