Strategy vault / Trend following
Bull Power Trading Strategy
The Bull Power trading strategy is a trend following strategy based on the "Bull and Bear Balance Indicator". By calculating the relationship between the current K-line and previous K-line, the strategy judges…
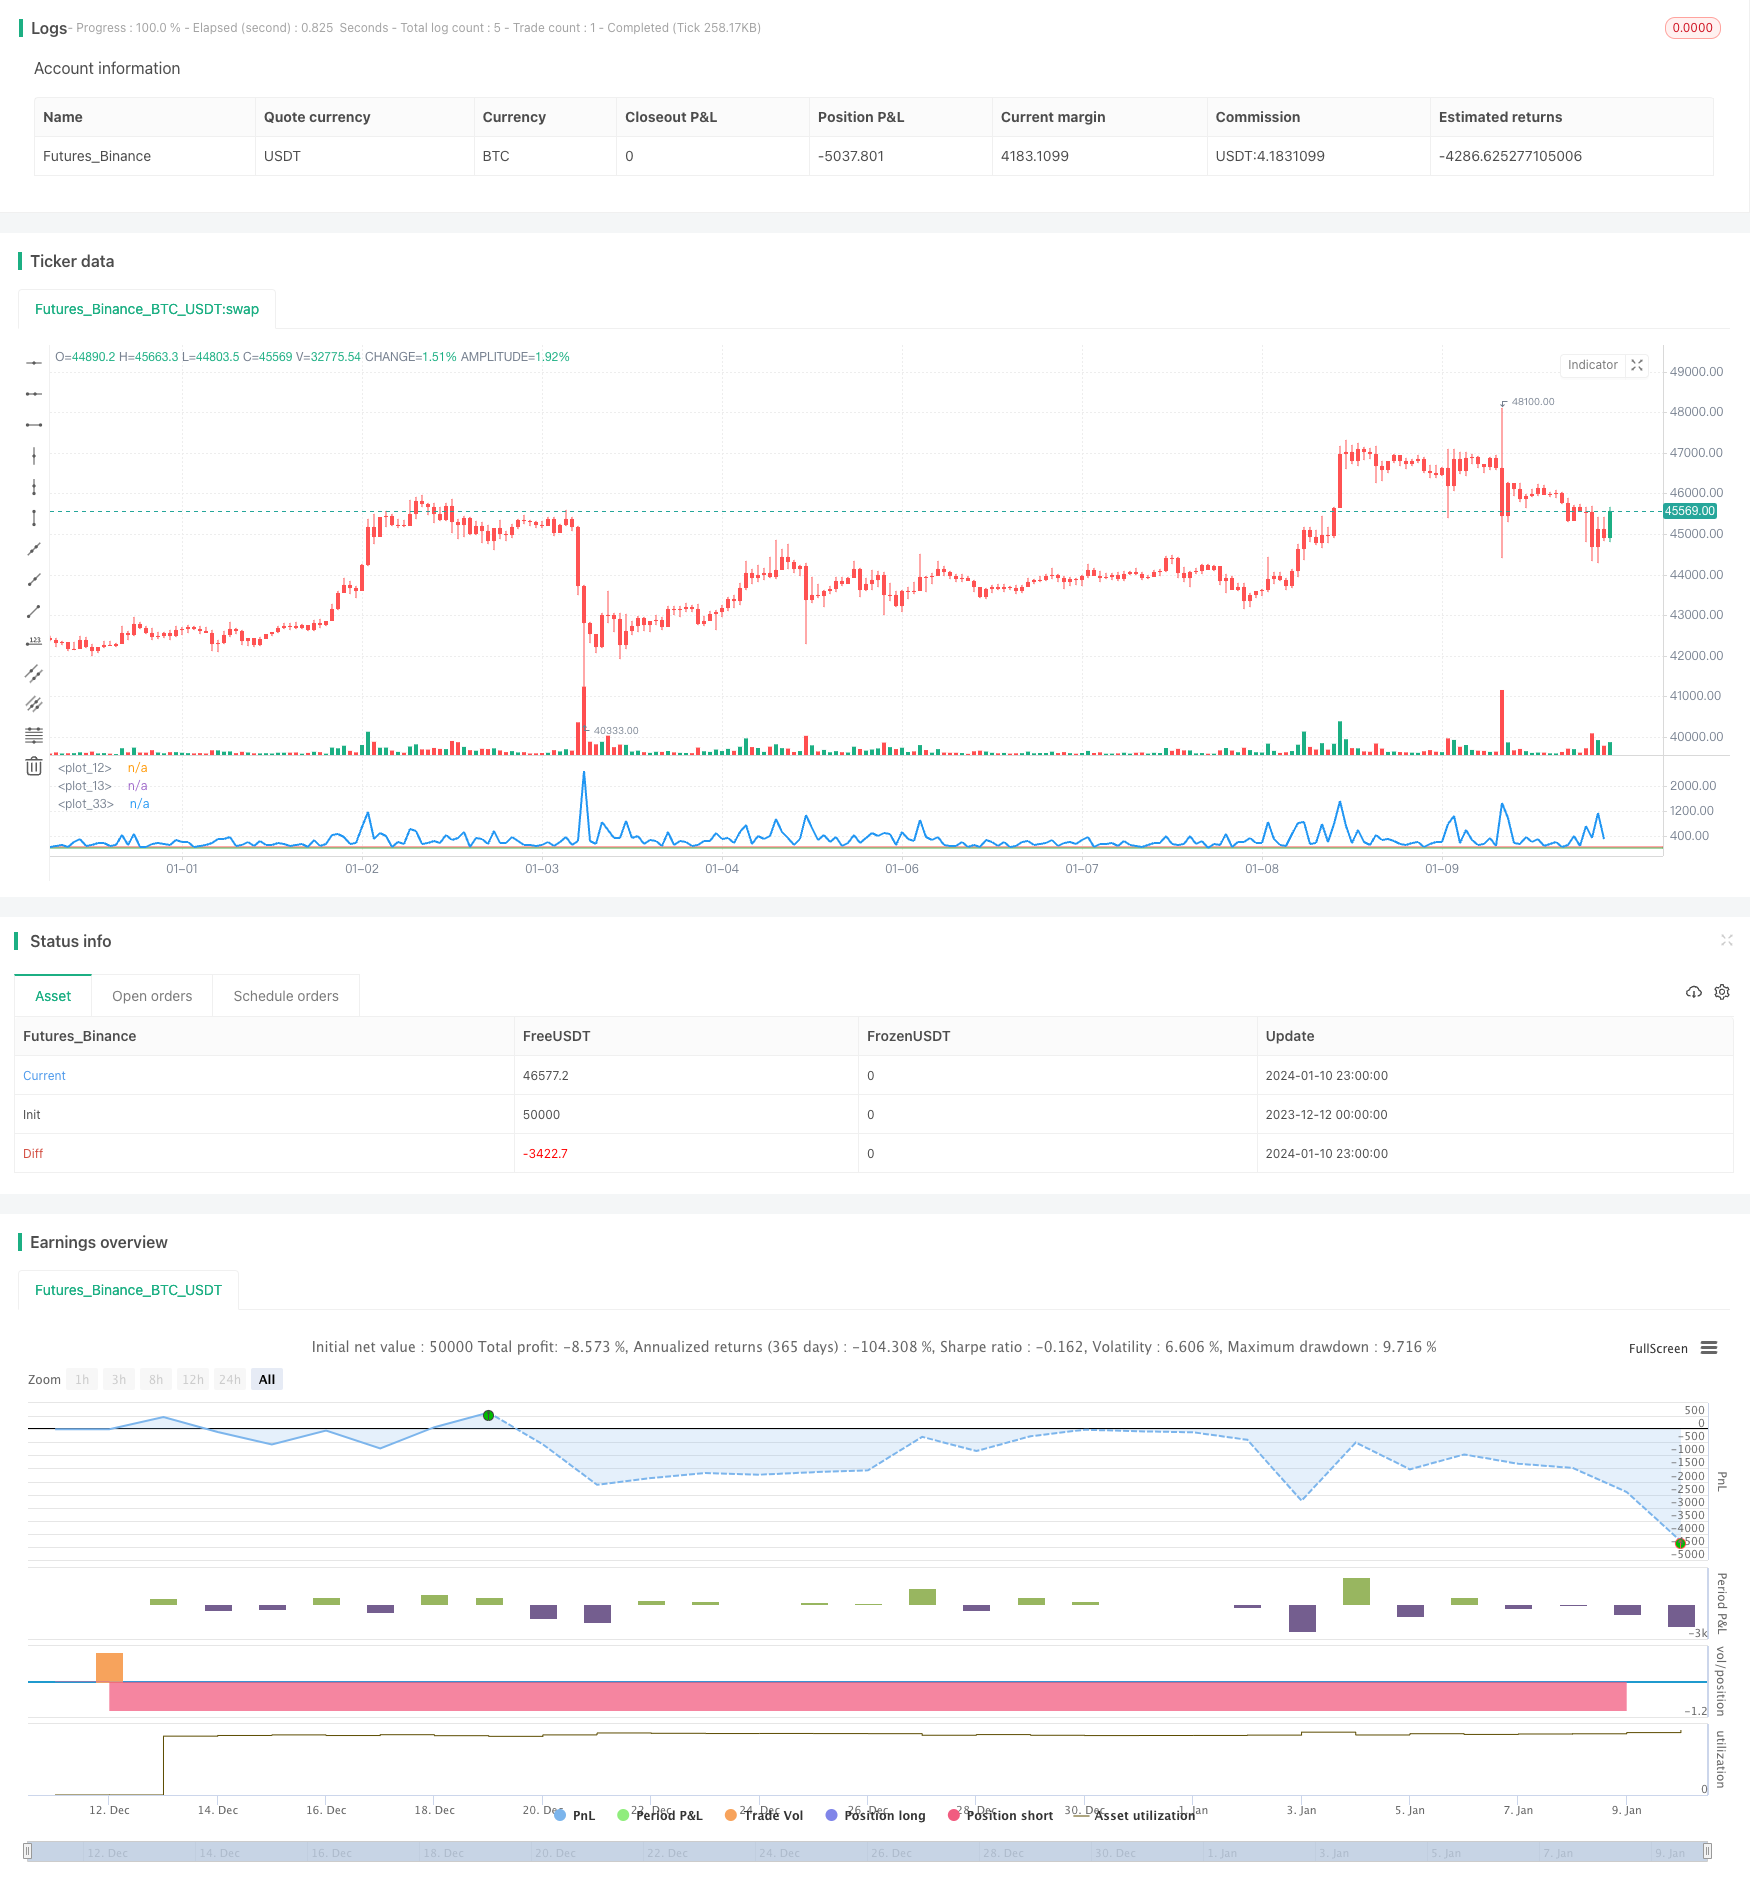
Overview
The Bull Power trading strategy is a trend following strategy based on the "Bull and Bear Balance Indicator". By calculating the relationship between the current K-line and previous K-line, the strategy judges whether the current market is bullish or bearish and makes corresponding buy or sell decisions.
Strategy Logic
The core indicator of this strategy is value. By comparing the close price, open price, highest price and lowest price of the current K-line, it determines the bullish/bearish status of the market.
The specific formula is as below:
If Close < Open:
If Previous Close < Current Open:
    value = max(Highest - Previous Close, Close - Lowest)
Else:
    value = max(Highest - Open, Close - Lowest)
If Close > Open:
If Previous Close > Current Open:
    value = Highest - Lowest
Else:
    value = max(Open - Previous Close, Highest - Lowest)
If Close == Open:
If Highest - Close > Close - Lowest:
    If Previous Close < Current Open:
        value = max(Highest - Previous Close, Close - Lowest)
    Else:
        value = Highest - Open

If Highest - Close < Close - Lowest:
    If Previous Close > Current Open:
        value = Highest - Lowest
    Else:
        value = max(Open - Previous Close, Highest - Lowest)

Else:
    If Previous Close > Current Open:
        value = max(Highest - Open, Close - Lowest)
    Else:
        value = max(Open - Previous Close, Highest - Lowest)
The main idea is to judge the current K-line's bull/bear status by comparing price relationships. If Close < Open, it indicates bearishness. If Close > Open, it indicates bullishness.
Compare the calculated value with input parameters SellLevel and BuyLevel. If value is greater than SellLevel, the market is bearish. If value is less than BuyLevel, the market is bullish.
Make corresponding buy or sell decisions based on the comparison result.
Advantages
The strategy responds quickly and captures trend turning points in a timely manner.
It calculates relationship between the current K-line and previous K-line in real time to determine the market condition instead of relying on fixed indicators.
The strategy has few parameters which directly affect the trading logic and are easy to understand.
It allows flexible configuration of reverse trade logic for different market environments.
Risks
The strategy is sensitive to sudden events and may generate excessive invalid trades.
The value calculation is complex. It may fail in extreme cases and cause wrong signals.
It relies solely on a custom complex indicator, resulting in higher systemic risks.
No stop loss logic may lead to huge losses.
These risks can be reduced by relaxing buy/sell criteria, adding stop loss mechanisms or combining with other indicators.
Improvement Areas
Incorporate other indicators to filter trade signals, e.g. MACD, KDJ etc.
Add liquidity indicator to avoid misaligned trading during high volatility periods.
Optimize SellLevel and BuyLevel parameters for different cycles and products.
Add stop loss strategy to control single trade loss.
Use VIX to determine market volatility and adopt adaptive parameters.
Conclusion
The Bull Power trading strategy makes real-time judgment of market bullish/bearish status based on price relationships between the current K-line and previous K-line. It captures trend changes quickly. The strategy itself is simple to understand but relies solely on a complex custom indicator. It can be optimized in various ways to make parameters adaptive to market conditions, filter false signals and control risks. In summary, this strategy suits short-term traders pursuing high response speed.
Parameters
| Name | Default | What it controls |
|---|---|---|
| v_input_1 | 40 | SellLevel |
| v_input_2 | 3 | BuyLevel |
| v_input_3 | false | Trade reverse |
Source Pine Script
/*backtest
start: 2023-12-12 00:00:00
end: 2024-01-11 00:00:00
period: 1h
basePeriod: 15m
exchanges: [{"eid":"Futures_Binance","currency":"BTC_USDT"}]
*/

//@version=2
////////////////////////////////////////////////////////////
//  Copyright by HPotter v1.0 30/01/2017
//  Bull Power Indicator
//  To get more information please see "Bull And Bear Balance Indicator"
//  by Vadim Gimelfarb.
////////////////////////////////////////////////////////////
strategy(title = "Bull Power Strategy")
SellLevel = input(40, step=0.01)
BuyLevel = input(3, step=0.01)
reverse = input(false, title="Trade reverse")
hline(SellLevel, color=red, linestyle=line)
hline(BuyLevel, color=green, linestyle=line)
value = iff (close < open ,
         iff (close[1] < open ,  max(high - close[1], close - low), max(high - open, close - low)),
          iff (close > open,
           iff(close[1] > open,  high - low, max(open - close[1], high - low)),
             iff(high - close > close - low,
              iff (close[1] < open, max(high - close[1], close - low), high - open),
               iff (high - close < close - low,
                 iff(close[1] > open,  high - low, max(open - close, high - low)),
                  iff (close[1] > open, max(high - open, close - low),
                   iff(close[1] < open, max(open - close, high - low), high - low))))))
pos = iff(value > SellLevel, -1,
	     iff(value <= BuyLevel, 1, nz(pos[1], 0)))
possig = iff(reverse and pos == 1, -1,
          iff(reverse and pos == -1, 1, pos))
if (possig == -1)
    strategy.entry("Short", strategy.short)
if (possig == 1)
    strategy.entry("Long", strategy.long)
barcolor(possig == -1 ? red: possig == 1 ? green : blue )
plot(value, style=line, linewidth=2, color=blue)
Published by ChaoZhang on the FMZ strategy square · last modified 2024-01-12. Collected in the Quant Trading Vault. Unvalidated research: re-test with your own data and costs before trusting it.
Build this with AgenKit
A spec is not a trading system. Paste this into your coding agent and AgenKit runs a specialist team — architecture, test-first build, risk gates, review — with paper trading on by default.
/agenkit build a production-grade trading bot with a backtest engine, risk controls and paper trading by default from strategies/Bull-Power-Trading-Strategy.md- npx agenkit install engineering-kit in your project
- Paste the command into your agent and approve each phase
- Get tests, backtest, risk controls and a paper-trading switch
Understand it first
Before you run this, read the lesson behind the idea and how to backtest it honestly. Specs like this one are the survivors of an unknown number of trials; deflate their results accordingly.
Related specs
- 200 EMA VWAP MFI Trend Following StrategyPine Script · Trend following · 1d
- 4 EMA Trend StrategyPine Script · Trend following · 1d
- ADX MA and EMA Long Only Trend Tracking StrategyPine Script · Trend following · 1d
- ATR Dynamic Profit Target and Stop Loss StrategyPine Script · Trend following · 1d
- ATR Dynamic Trend Following and EMA Crossover Trading StrategyPine Script · Trend following · 1d
- ATR and Moving Average Crossover Hybrid StrategyPine Script · Trend following · 1h