Buy Low Volatility VS Buy High Volatility Strategy
This strategy aims to study the difference between buying assets when volatility is low and when it is high. It allows the user to choose whether to buy during low or high volatility periods by changing the mode…
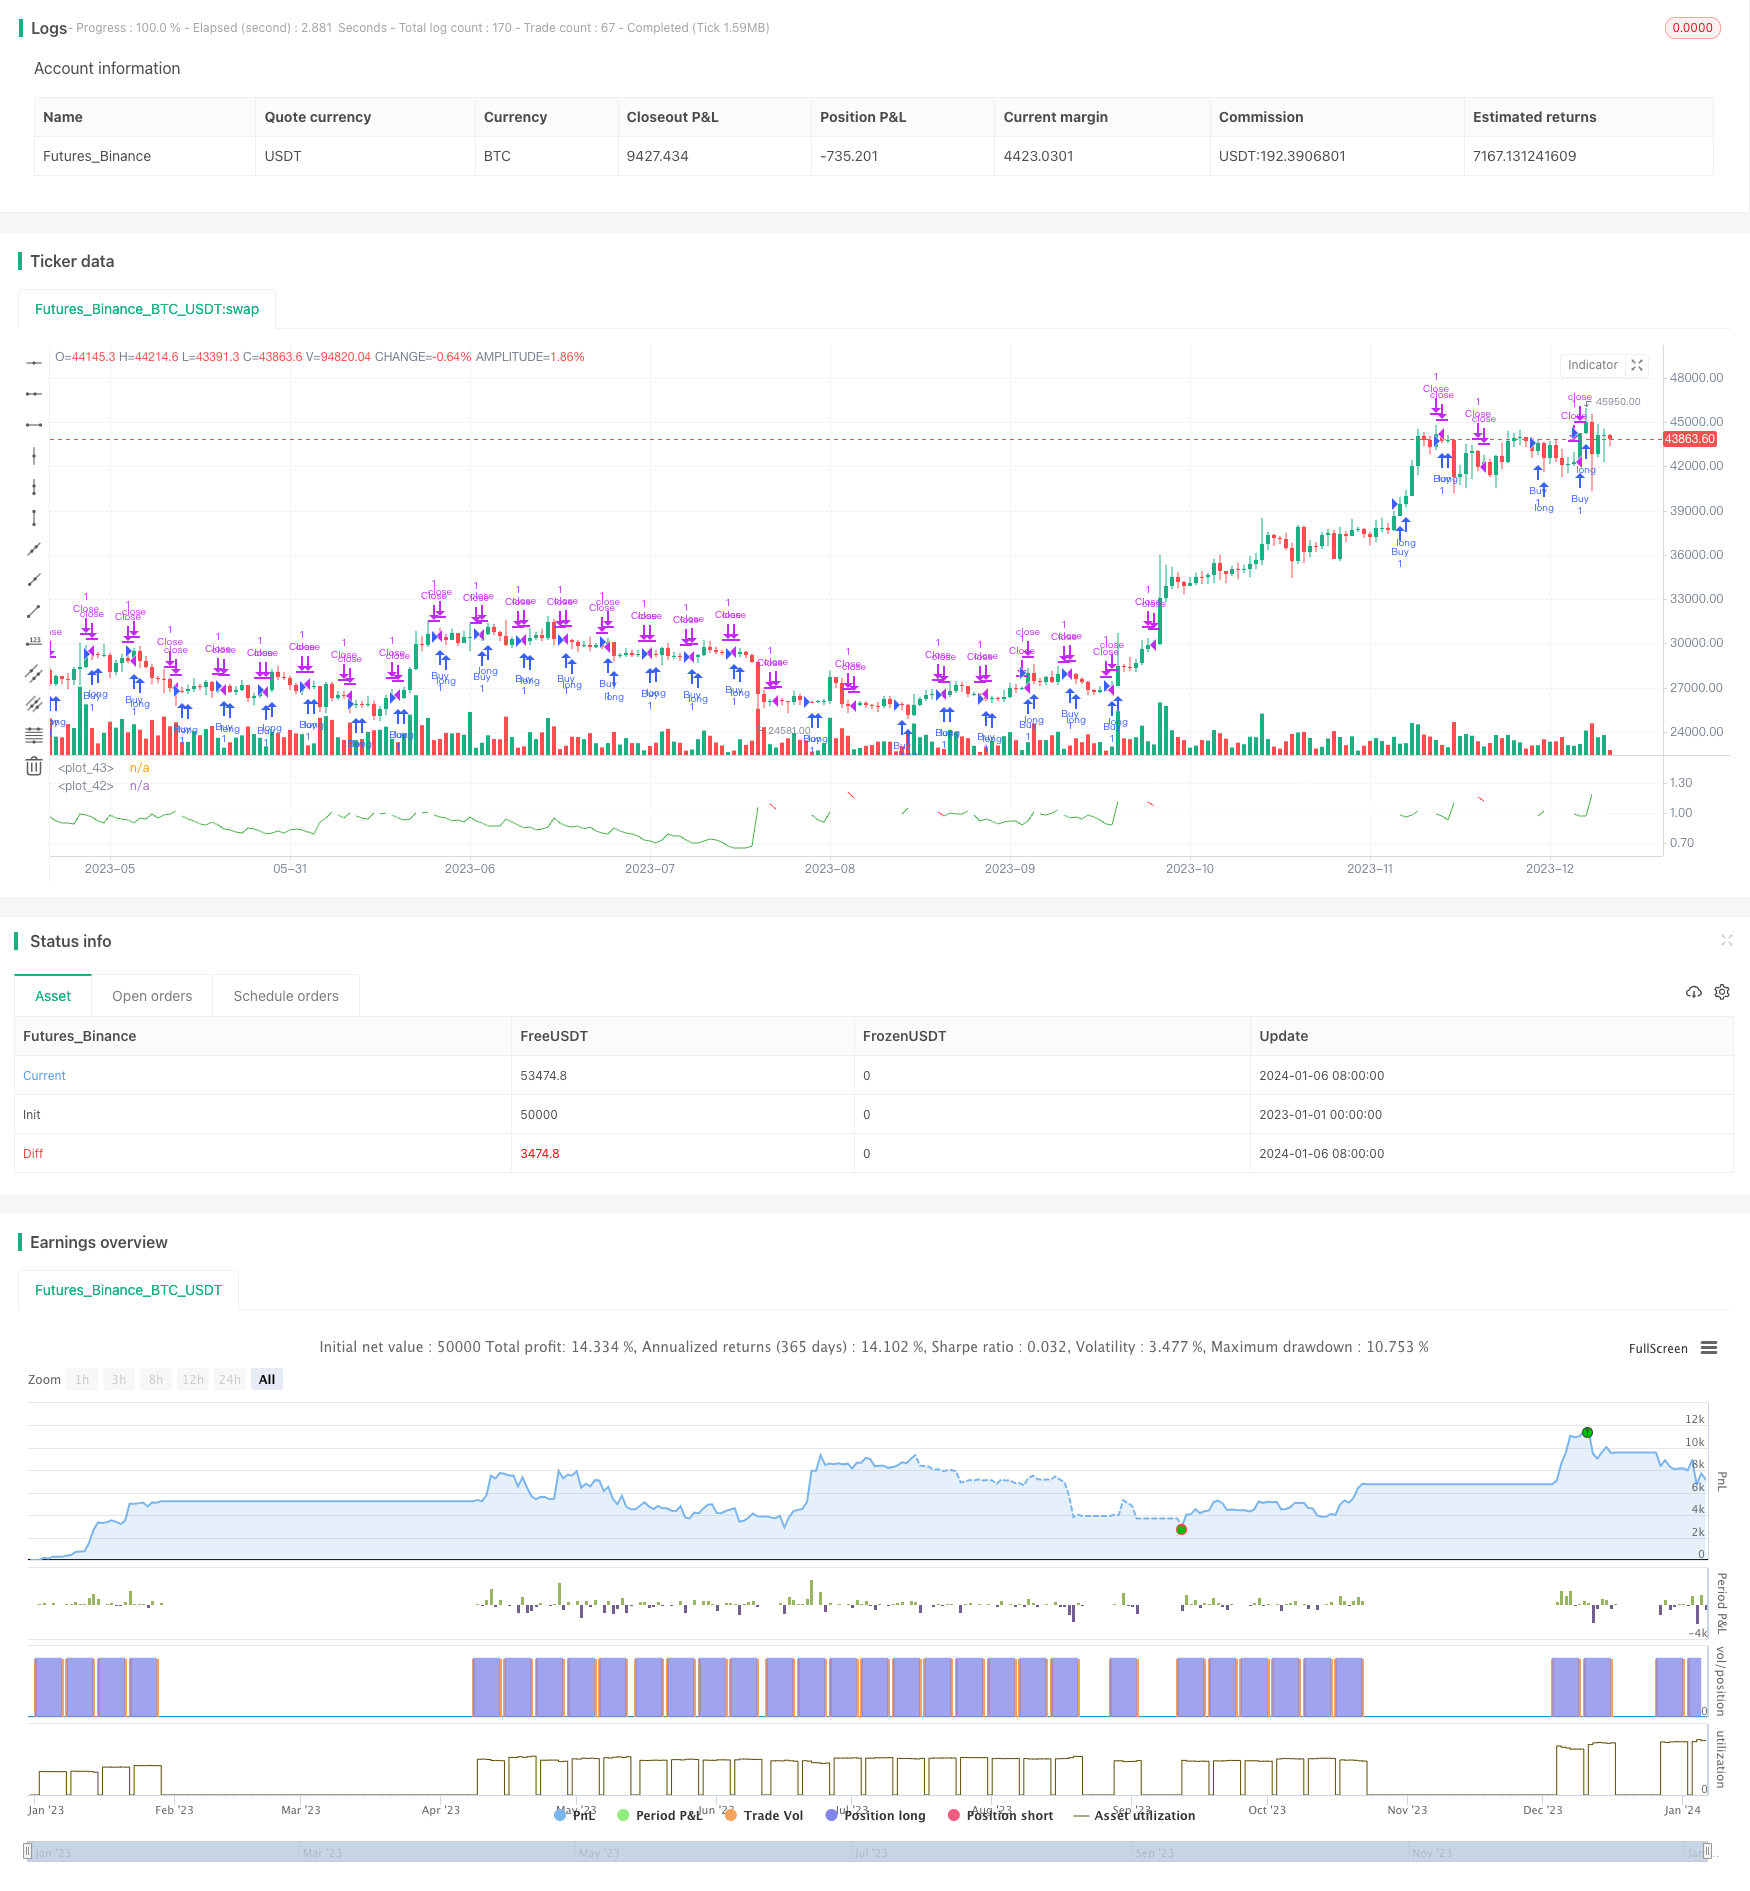
Overview
This strategy aims to study the difference between buying assets when volatility is low and when it is high. It allows the user to choose whether to buy during low or high volatility periods by changing the mode input variable.
Strategy Logic
This strategy determines volatility by calculating the ATR and its SMA. Specifically, it calculates the SMA of ATR, and then computes the ratio between the ATR and its SMA. If this ratio is higher than the user-defined threshold volatilityTargetRatio, the volatility is considered high. If lower than the threshold, the volatility is considered low.
Depending on the mode chosen by the user, the strategy generates buy signals when volatility is high or low. Once bought, the strategy will hold for a number of bars defined by sellAfterNBarsLength, and then close the position.
Advantage Analysis
The main advantages of this strategy are:
- Can intuitively compare the performance of buying strategies during low and high volatility periods.
- Using SMA to smooth ATR can filter false breakouts.
- Can test different volatility levels by tuning parameters.
Risk Analysis
The main risks of this strategy are:
- May miss price uptrend opportunities if only buying low volatility.
- May increase system risk if only buying high volatility.
- Inappropriate parameter settings may lead to missing buy opportunities or closing positions too early.
The above risks can be mitigated by adjusting parameters and combining buys from different volatility levels.
Optimization Directions
This strategy can be further optimized by:
- Testing different ATR length parameters.
- Adding stop loss strategies.
- Combining other indicators to filter false breakouts.
- Optimizing entry and exit criteria.
Conclusion
This strategy can effectively compare the performance of low volatility buy and high volatility buy strategies. It uses SMA to smooth ATR and generates trading signals based on volatility levels. The strategy can be improved through parameter tuning and optimizing conditions. Overall, this strategy provides an effective tool for researching volatility-based strategies.
Parameters
| Name | Default | What it controls |
|---|---|---|
| v_input_string_1 | 0 | mode: Buy low Volatility | Buy high Volatility |
| v_input_float_1 | true | volatilityTargetRatio |
| v_input_int_1 | 14 | atrLength |
| v_input_int_2 | 5 | sellAfterNBarsLength |
Source Pine Script
/*backtest
start: 2023-01-01 00:00:00
end: 2024-01-07 00:00:00
period: 1d
basePeriod: 1h
exchanges: [{"eid":"Futures_Binance","currency":"BTC_USDT"}]
*/

// This source code is subject to the terms of the Mozilla Public License 2.0 at https://mozilla.org/MPL/2.0/
// © I11L

//@version=5
strategy("I11L - Better Buy Low Volatility or High Volatility?", overlay=false)

mode = input.string("Buy low Volatility",options = ["Buy low Volatility","Buy high Volatility"])
volatilityTargetRatio = input.float(1,minval = 0, maxval = 100,step=0.1, tooltip="1 equals the average atr for the security, a lower value means that the volatility is lower")
atrLength = input.int(14)

atr = ta.atr(atrLength) / close
avg_atr = ta.sma(atr,atrLength*5)
ratio = atr / avg_atr

sellAfterNBarsLength = input.int(5, step=5, minval=0)


var holdingBarsCounter = 0

if(strategy.opentrades > 0)
    holdingBarsCounter := holdingBarsCounter + 1


isBuy = false

if(mode == "Buy low Volatility")
    isBuy := ratio < volatilityTargetRatio
else
    isBuy := ratio > volatilityTargetRatio

isClose = holdingBarsCounter > sellAfterNBarsLength


if(isBuy)
    strategy.entry("Buy",strategy.long)

if(isClose)
    holdingBarsCounter := 0
    strategy.exit("Close",limit=close)

plot(ratio, color=isBuy[1] ? color.green : isClose[1] ? color.red : color.white)
plot(1, color=color.white)
Published by ChaoZhang on the FMZ strategy square · last modified 2024-01-08. Collected in the Quant Trading Vault. Unvalidated research: re-test with your own data and costs before trusting it.
Build this with AgenKit
A spec is not a trading system. Paste this into your coding agent and AgenKit runs a specialist team — architecture, test-first build, risk gates, review — with paper trading on by default.
/agenkit build a production-grade trading bot with a backtest engine, risk controls and paper trading by default from strategies/Buy-Low-Volatility-VS-Buy-High-Volatility-Strategy.md- npx agenkit install engineering-kit in your project
- Paste the command into your agent and approve each phase
- Get tests, backtest, risk controls and a paper-trading switch
Understand it first
Before you run this, read the lesson behind the idea and how to backtest it honestly. Specs like this one are the survivors of an unknown number of trials; deflate their results accordingly.
Related specs
- Multi Indicator Volatility Trading RSI EMA ATR StrategyPine Script · Volatility · 3m
- ATR Trailing Stop Bands StrategyPine Script · Volatility · 1d
- Volatility Capture RSI Bollinger Band StrategyPine Script · Volatility · 15m
- Big Snapper Alerts R30 Chaiking Volatility condition TP RSIPine Script · Volatility · 2h
- Intraday Scalable Volatility Trading StrategyPine Script · Volatility · 1h
- Kase Dynamic Stop Loss StrategyPine Script · Volatility · 1d