Strategy vault / Trend following
CCI MA Crossover Pullback Buy Strategy
The CCI + MA Crossover Pullback Buy Strategy is a quantitative trading strategy that combines the Commodity Channel Index (CCI) and dual moving average crossover signals. The strategy buys when the price pulls back…
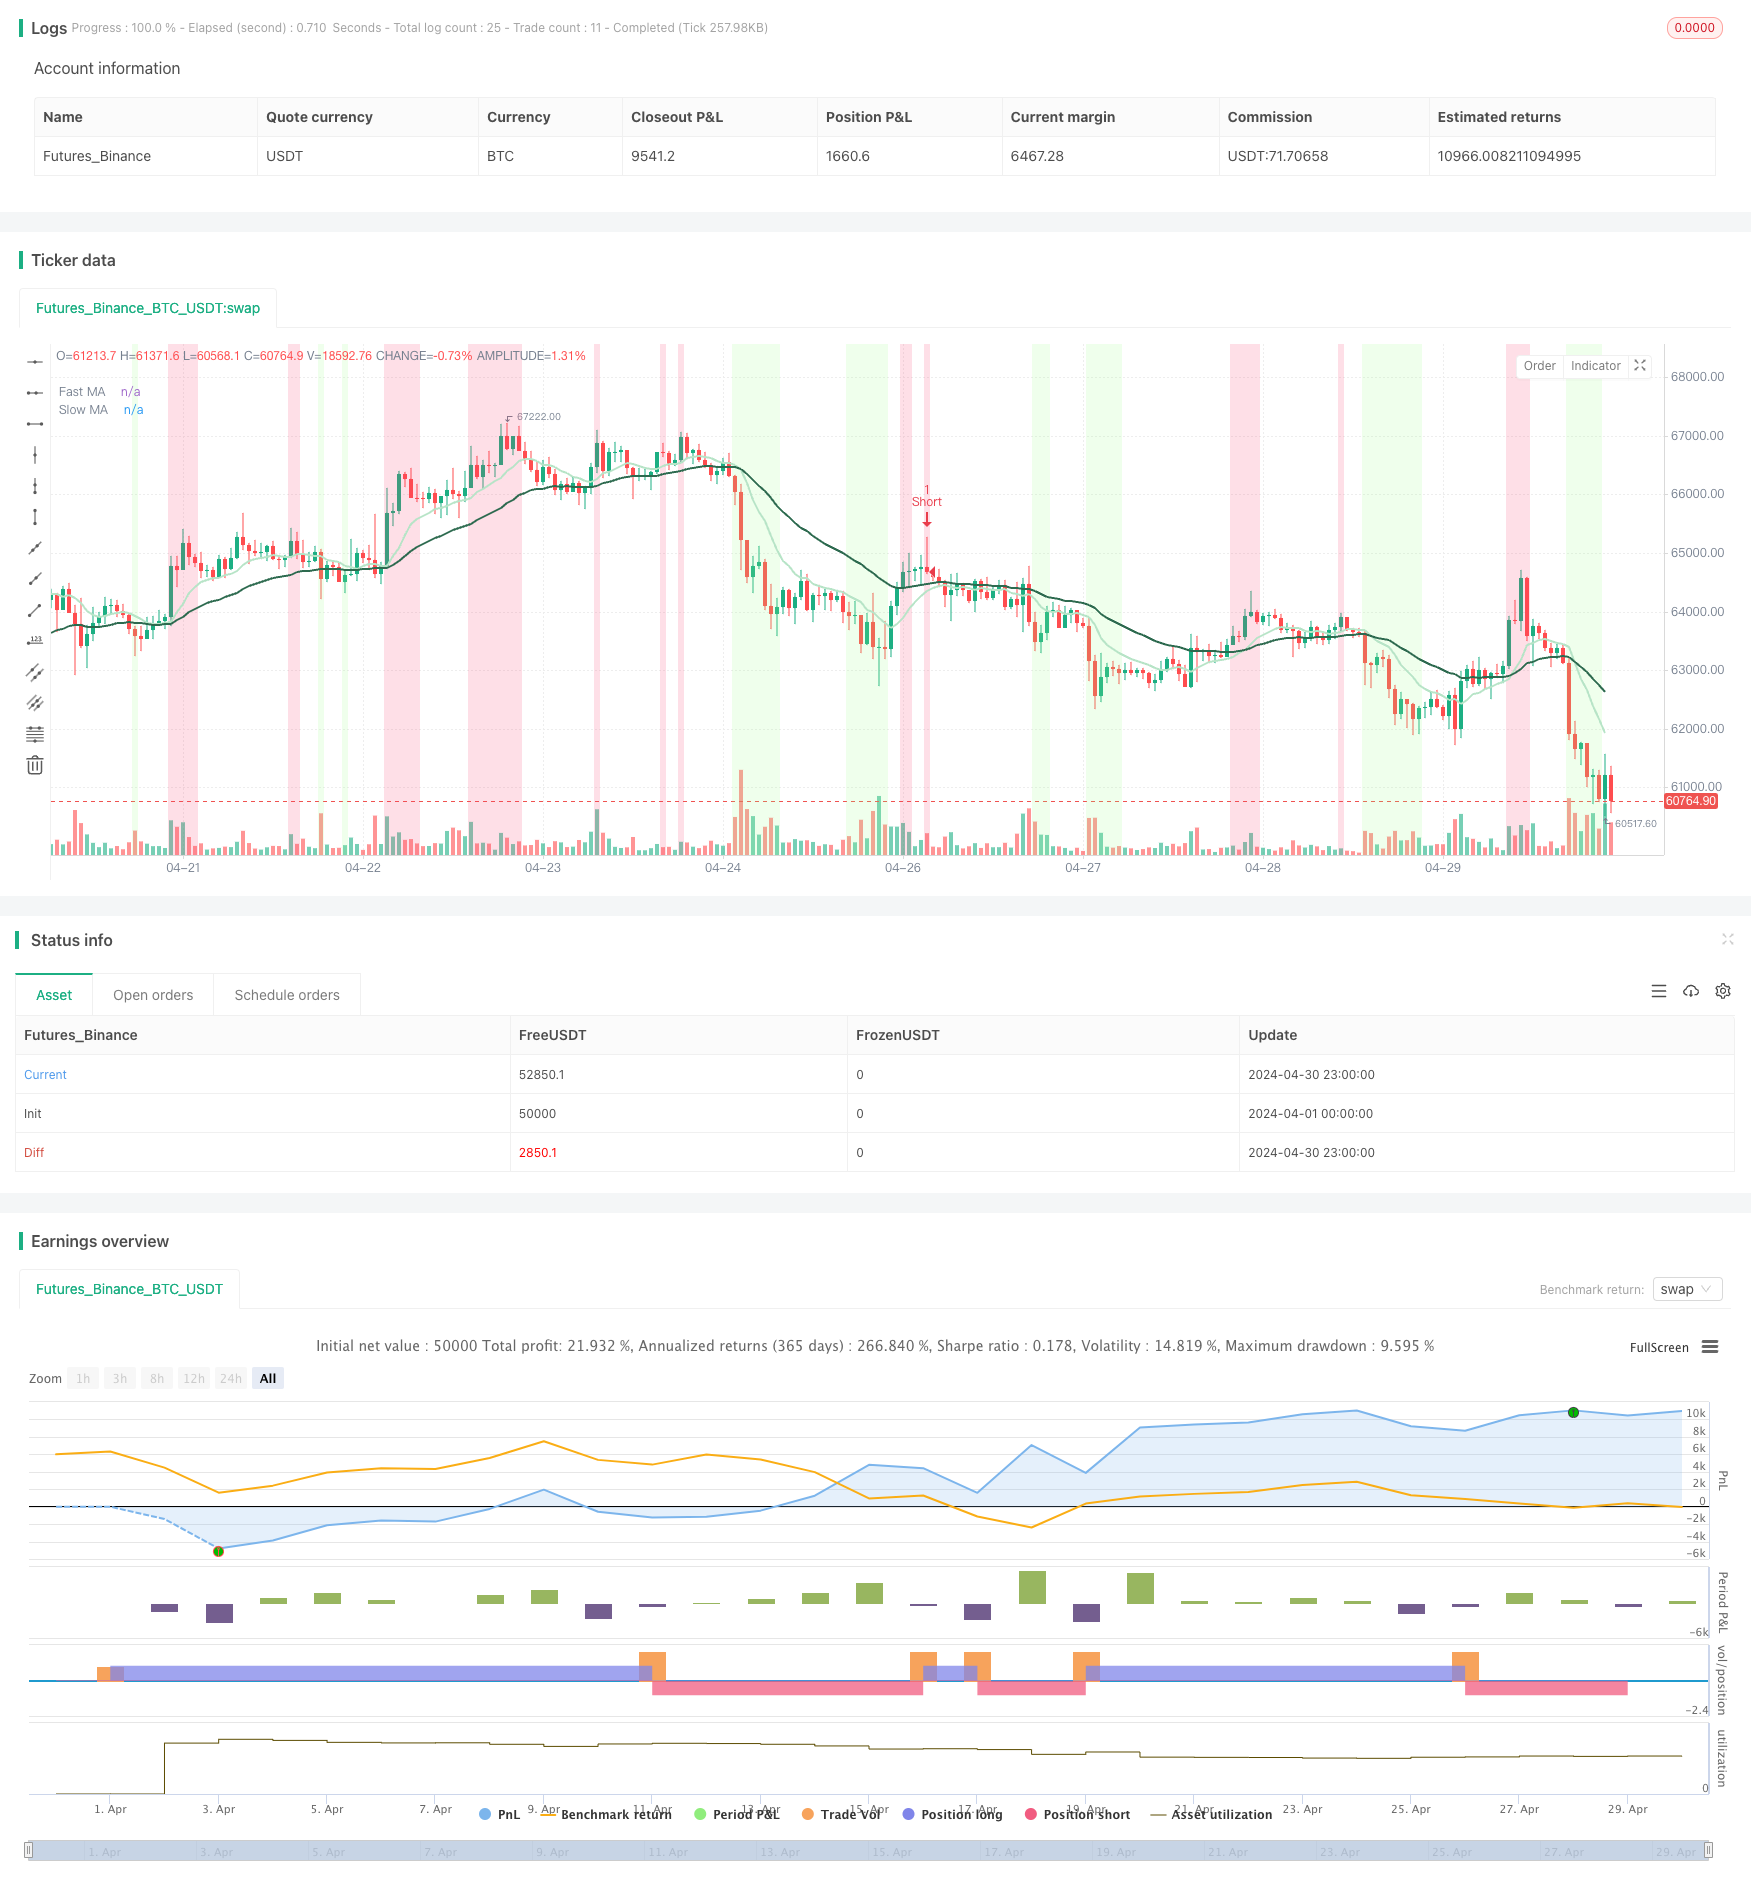
Overview
The CCI + MA Crossover Pullback Buy Strategy is a quantitative trading strategy that combines the Commodity Channel Index (CCI) and dual moving average crossover signals. The strategy buys when the price pulls back to the fast moving average and the CCI indicates oversold conditions after a bullish crossover. It sells when the price rallies to the fast moving average and the CCI indicates overbought conditions after a bearish crossover. By combining CCI and dual moving average crossover signals, this strategy can better capture trending opportunities while achieving better entry and exit points through pullback buys and rally sells, thus improving the risk-reward ratio.
Strategy Logic
- Calculate the CCI indicator based on user-defined CCI parameters (source, period, moving average type, overbought/oversold thresholds).
- Determine CCI overbought/oversold conditions. Set the background color to red when CCI is above the overbought threshold and green when below the oversold threshold.
- Calculate the fast and slow moving averages based on user-defined parameters (source, period, moving average type).
- Identify bullish and bearish crossovers. Plot a bullish signal when the fast MA crosses above the slow MA, and a bearish signal when the fast MA crosses below the slow MA.
- Make trading decisions:
- Long entry: When the fast MA is above the slow MA, the previous candle closes below the fast MA, the current candle is bullish, and the CCI is below the oversold threshold, buy to open a long position.
- Short entry: When the fast MA is below the slow MA, the previous candle closes above the fast MA, the current candle is bearish, and the CCI is above the overbought threshold, sell to open a short position.
Strategy Advantages
- Trend following: The dual moving average crossover signals help identify trend direction and better align with market trends.
- Counter-trend entry: Waiting for price pullbacks to buy or price rallies to sell after trend confirmation can lead to better entry prices and improve the risk-reward ratio.
- Reduced false signals: Combining CCI with moving average crossover signals can effectively reduce false signals generated by a single indicator.
- Flexible parameters: Users can flexibly set CCI and moving average parameters according to their preferences to optimize strategy performance.
Strategy Risks
- Choppy market risk: In a choppy market, frequent bullish and bearish crossovers may lead to more losing trades.
- Parameter risk: Inappropriate parameter settings may result in poor strategy performance. Thorough backtesting and analysis of optimal parameter combinations for different market conditions are necessary.
- Trend risk: When market trends reverse, the strategy may delay exits and suffer larger drawdowns.
Strategy Optimization Directions
- Introduce position sizing to dynamically adjust the position size of each trade based on current trend strength and volatility for better risk control.
- Optimize entry conditions by incorporating volume indicators or other auxiliary confirmation indicators to improve the reliability of entry signals.
- Optimize exit conditions by setting trailing stops or time stops to reduce the maximum loss per trade.
- Perform parameter optimization for different markets and instruments separately to enhance the adaptability and robustness of the strategy.
Summary
The CCI + MA Crossover Pullback Buy Strategy is a quantitative trading strategy that combines the advantages of trend following and counter-trend entry. By capturing trend direction with dual moving averages and identifying overbought/oversold zones with the CCI indicator, while waiting for price pullbacks and rallies to achieve better entry prices, the strategy can potentially improve profitability and risk-reward ratio to a certain extent. However, the strategy also faces risks such as parameter optimization, choppy markets, and sudden trend changes. Further optimization and improvements are needed to enhance the robustness and profitability of the strategy. The strategy logic is clear, the code structure is complete, and it is suitable for live trading overall.
Source Pine Script
/*backtest
start: 2024-04-01 00:00:00
end: 2024-04-30 23:59:59
period: 1h
basePeriod: 15m
exchanges: [{"eid":"Futures_Binance","currency":"BTC_USDT"}]
*/

// This Pine Script™ code is subject to the terms of the Mozilla Public License 2.0 at https://mozilla.org/MPL/2.0/
// © tradedots

//@version=5
strategy("CCI + MA Crossover Pullback Buy Strategy [TradeDots]", overlay=true)


ma(source, length, type) =>
  type == "SMA" ? ta.sma(source[1], length) :
  type == "EMA" ? ta.ema(source[1], length) :
  type == "SMMA (RMA)" ? ta.rma(source[1], length) :
  type == "WMA" ? ta.wma(source[1], length) :
  type == "VWMA" ? ta.vwma(source[1], length) :
  na

//CCI settings
cci_coloring  = input.bool(true, "CCI Background Color", group = "Commodity channel index")
cci_length    = input.int(20,"CCI Length", group = "Commodity channel index")
cci_ma_type   = input.string("EMA","CCI MA Type", options=["SMA", "EMA", "SMMA (RMA)", "WMA", "VWMA"], group = "Commodity channel index")
cci_soruce    = input(hlc3, "CCI Source", group = "Commodity channel index")
cci_threshold = input.int(100, "CCI Threshold", group = "Commodity channel index")
cci_ma = ma(cci_soruce, cci_length, cci_ma_type)
cci = (cci_soruce - cci_ma) / (0.015 * ta.dev(cci_soruce, cci_length))

bgcolor(cci > cci_threshold and cci_coloring ? color.new(#f9396a, 80) : cci < -cci_threshold and cci_coloring? color.new(#9cff87, 80) : na, title = "CCI Overbought / Oversold")

//ma crossover settings
input_crossover_labels = input.bool(true, "Show Crossover Labels", group="Moving average")

fastma_type   = input.string("EMA","", inline="fastma", options=["SMA", "EMA", "SMMA (RMA)", "WMA", "VWMA"], group="Moving average")
fastma_source = input(close, "", inline="fastma", group="Moving average")
fastma_length = input.int(10, "", inline="fastma", minval=1,group="Moving average")
fastma_color  = input(#e2fdff, "", inline="fastma",group="Moving average")
fastma = ma(fastma_source, fastma_length, fastma_type)
fastmaPlot = plot(fastma, color = #b7e4c7, linewidth = 2, title = "Fast MA")

slowma_type   = input.string("EMA","", inline="slowma", options=["SMA", "EMA", "SMMA (RMA)", "WMA", "VWMA"], group="Moving average")
slowma_source = input(close, "", inline="slowma", group="Moving average")
slowma_length = input.int(30, "", inline="slowma", minval=1,group="Moving average")
slowma_color  = input(#e2fdff, "", inline="slowma",group="Moving average")
slowma = ma(slowma_source, slowma_length, slowma_type)
slowmaPlot = plot(slowma, color = #2d6a4f, linewidth = 2, title = "Slow MA")

bullish_crossover = ta.crossover(fastma, slowma)
bearish_crossover = ta.crossunder(fastma, slowma)

// // strategy
// if bullish_crossover and input_crossover_labels
//     line.new(bar_index, close, bar_index, close * 1.01, extend = extend.both, color = color.new(#9cff87, 30), style = line.style_dotted, width = 3)
//     label.new(bar_index,low, "Bullish Crossover", style = label.style_label_up, color = #9cff87)

// else if bearish_crossover and input_crossover_labels
//     line.new(bar_index, close, bar_index, close * 1.01, extend = extend.both, color = color.new(#f9396a, 30), style = line.style_dotted, width = 3)
//     label.new(bar_index, high, "Bearish Crossover", style = label.style_label_down, color = #f9396a, textcolor = color.white)

if fastma > slowma and close[1] < fastma and close > open and cci < -cci_threshold
    strategy.entry("Long", strategy.long)
    // if strategy.opentrades == 0 or strategy.opentrades.size(strategy.opentrades -1) < 0
    //     label.new(bar_index,low, "? Long", style = label.style_label_up, color = #9cff87)

if fastma < slowma and close[1] > fastma and close < open and cci > cci_threshold
    strategy.entry("Short", strategy.short)
    // if strategy.opentrades == 0 or strategy.opentrades.size(strategy.opentrades -1) > 0
// label.new(bar_index, high, "? Short", style = label.style_label_down, color = #f9396a, textcolor = color.white)Published by ChaoZhang on the FMZ strategy square · last modified 2024-05-24. Collected in the Quant Trading Vault. Unvalidated research: re-test with your own data and costs before trusting it.
Build this with AgenKit
A spec is not a trading system. Paste this into your coding agent and AgenKit runs a specialist team — architecture, test-first build, risk gates, review — with paper trading on by default.
/agenkit build a production-grade trading bot with a backtest engine, risk controls and paper trading by default from strategies/CCI-MA-Crossover-Pullback-Buy-Strategy.md- npx agenkit install engineering-kit in your project
- Paste the command into your agent and approve each phase
- Get tests, backtest, risk controls and a paper-trading switch
Understand it first
Before you run this, read the lesson behind the idea and how to backtest it honestly. Specs like this one are the survivors of an unknown number of trials; deflate their results accordingly.
Related specs
- EMA SMA Multi Indicator Comprehensive Trend Following StrategyPine Script · Trend following · 1h
- Supertrend Advance StrategyPine Script · Trend following · 5m
- SuperTrend Trailing Stop Strategy Based on Heikin AshiPine Script · Trend following · 4h
- CCIRSIKC Trend Filter Bi Directional Trading StrategyPine Script · Trend following · 2h
- MOST Indicator Dual Position Adaptive StrategyPine Script · Trend following · 4h
- Patient Trend Following StrategyPine Script · Trend following · 1m