Strategy vault / Multi-timeframe
CM MACD Custom Indicator Multiple Time Frame V2
Thanks to @SKTennis for help in Updating code to V2 Added Groups to Settings Pane. Added Color Plots to Settings Pane Switched MTF Logic to turn ON/OFF automatically w/ TradingView's Built in Feature Updated Color…
Thanks to @SKTennis for help in Updating code to V2 Added Groups to Settings Pane. Added Color Plots to Settings Pane Switched MTF Logic to turn ON/OFF automatically w/ TradingView's Built in Feature Updated Color Transparency plots to work in future update Added Ability to Turn ON/OFF Show MacD & Signal Line Added Ability to Turn ON/OFF Show Histogram Added Ability to Change MACD Line Colors Based on Trend Added Ability to Highlight Price Bars Based on Trend Added Alerts to Settings Pane. Customized how Alerts work. Must keep Checked in Settings Pane, and When you go to Alerts Panel, Change Symbol to Indicator (CM_Ult_MacD_MTF_V2) Customized Alerts to Show Symbol, TimeFrame, Closing Price, MACD Crosses Up & MACD Crosses Down Signals in Alert Alerts are Pre-Set to only Alert on Bar Close
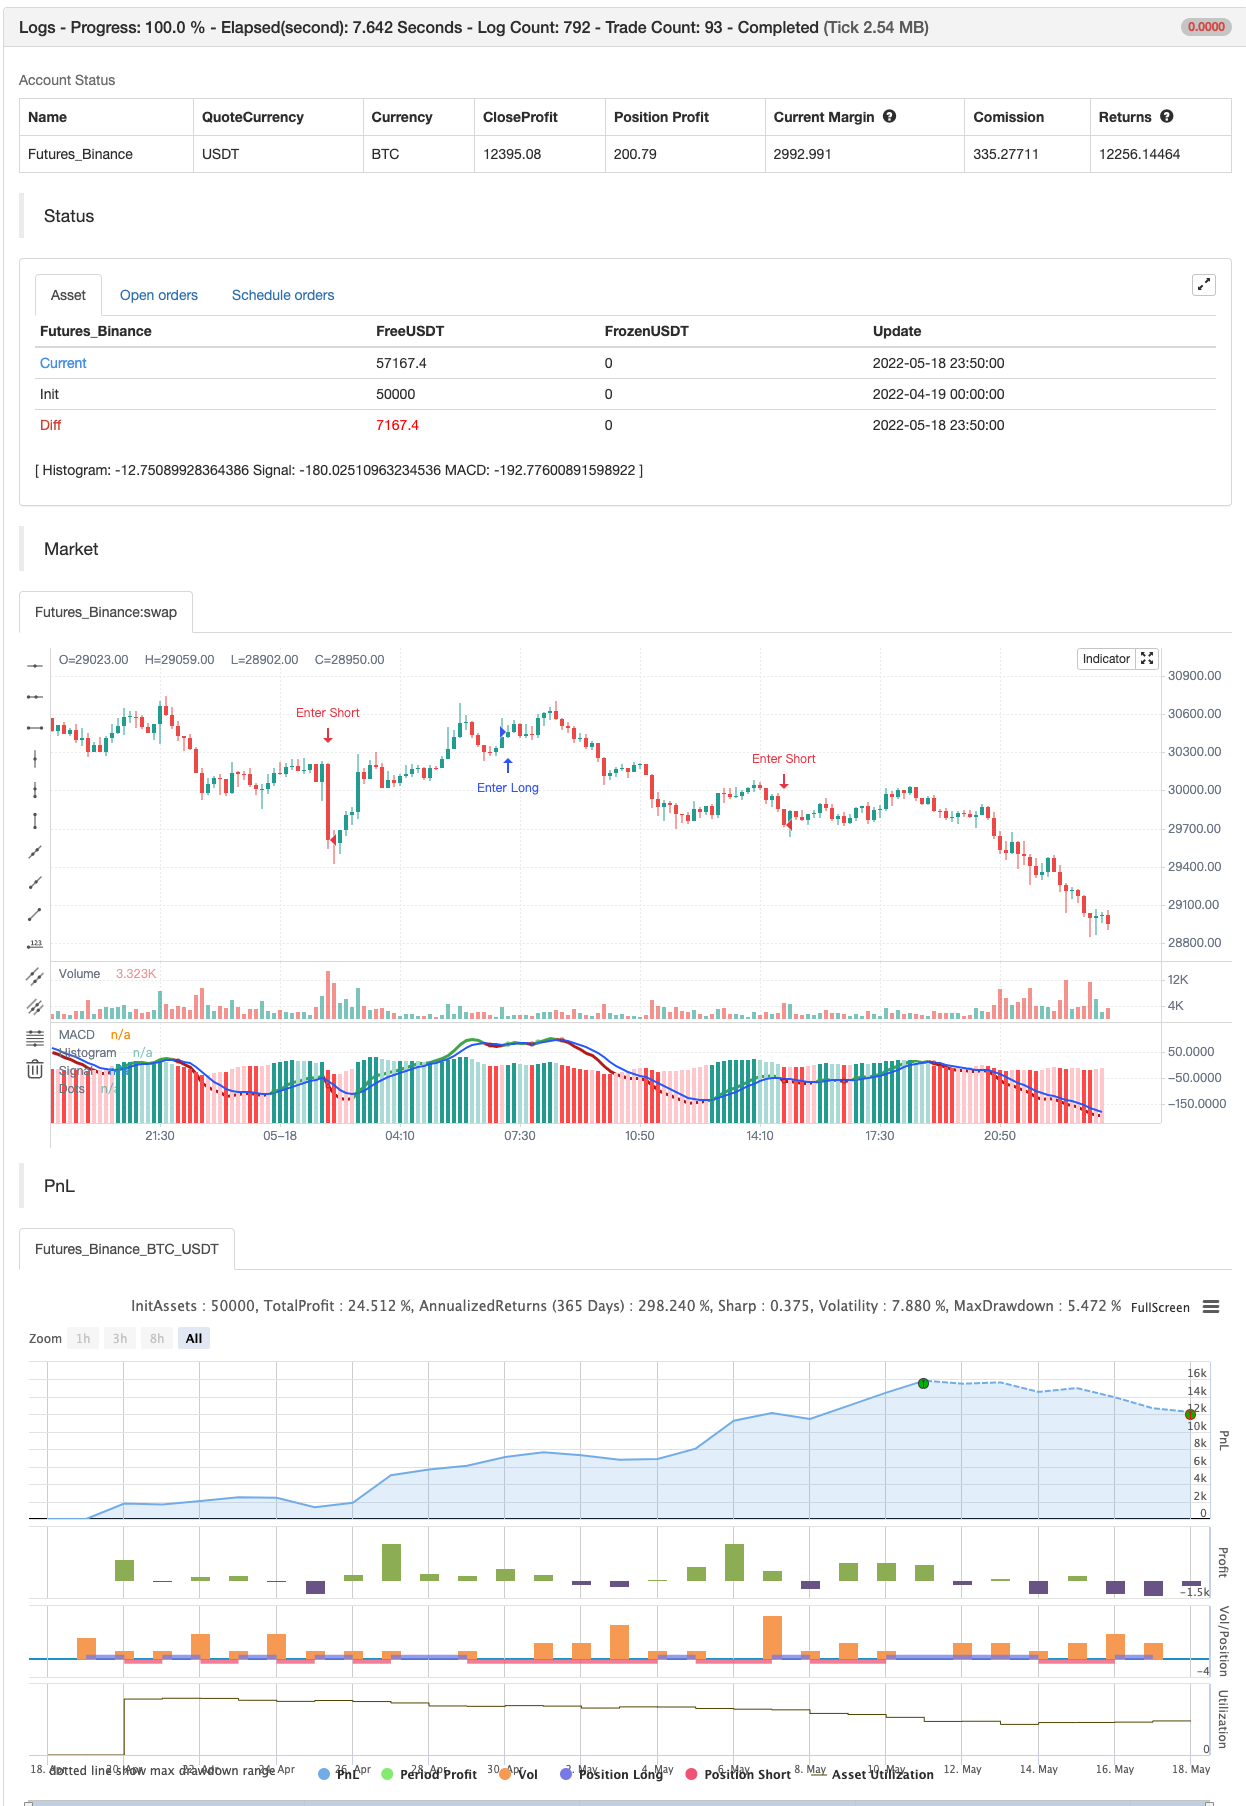
backtest
Parameters
| Name | Default | What it controls |
|---|---|---|
| v_input_timeframe_1 | Indicator TimeFrame | |
| v_input_int_1 | 12 | Fast Length |
| v_input_int_2 | 26 | Slow Length |
| v_input_source_1_close | 0 | Source: close | high | low | open | hl2 | hlc3 | hlcc4 | ohlc4 |
| v_input_int_3 | 5 | Signal Smoothing |
| v_input_string_1 | 0 | Oscillator MA Type: EMA | SMA |
| v_input_string_2 | 0 | Signal Line MA Type: EMA | SMA |
| v_input_bool_1 | true | (?Show Plots)Show MACD Lines |
| v_input_int_4 | 3 | MACD Width |
| v_input_int_5 | 2 | Signal Width |
| v_input_bool_2 | true | Show Histogram |
| v_input_int_6 | 5 | -- Width |
| v_input_bool_3 | true | Show MACD Lines w/ Trend Color |
| v_input_bool_4 | false | Show Highlight Price Bars |
| v_input_bool_5 | false | Show BackGround on Cross |
| v_input_bool_6 | true | Show Circle on Cross |
| v_input_int_7 | 5 | -- Width |
| v_input_1 | #FF6D00 | (?Color Settings)MACD Line |
| v_input_2 | #2962FF | Signal Line |
| v_input_3 | #4BAF4F | Trend Up |
| v_input_4 | #B71D1C | Trend Down |
| v_input_5 | #26A69A | (?Histogram Colors)Above Grow |
| v_input_6 | #B2DFDB | Fall |
| v_input_7 | #FF5252 | Below Grow |
| v_input_8 | #FFCDD2 | Fall |
| v_input_bool_7 | true | (?Alerts)MACD Cross Up |
| v_input_bool_8 | true | MACD Cross Dn |
| v_input_bool_9 | true | MACD Cross Up & > 0 |
| v_input_bool_10 | true | MACD Cross Dn & < 0 |
Source Pine Script
/*backtest
start: 2022-04-19 00:00:00
end: 2022-05-18 23:59:00
period: 10m
basePeriod: 1m
exchanges: [{"eid":"Futures_Binance","currency":"BTC_USDT"}]
*/

//------New V2 Update 07-28-2021----------
//Thanks to @SKTennis for help in Updating code to V2
//Added Groups to Settings Pane.
//Added Color Plots to Settings Pane
//Switched MTF Logic to turn ON/OFF automatically w/ TradingView's Built in Feature
//Updated Color Transparency plots to work in future update
//Added Ability to Turn ON/OFF Show MacD & Signal Line
//Added Ability to Turn ON/OFF Show Histogram
//Added Ability to Change MACD Line Colors Based on Trend
//Added Ability to Highlight Price Bars Based on Trend
//Added Alerts to Settings Pane.
//Customized how Alerts work.  Must keep Checked in Settings Pane, and...
//When you go to Alerts Panel, Change Symbol to Indicator (CM_Ult_MacD_MTF_V2)
//Customized Alerts to Show Symbol, TimeFrame, Closing Price, MACD Crosses Up & MACD Crosses Down Signals in Alert
//Alerts are Pre-Set to only Alert on Bar Close

//------New V2.1 Update 08-03-2021----------
//Added back in ability to show Dots when MACD Crosses.
//Added Ability to Change Plot Widths in Settings Pane
//Added in Alert Feature where Cross Up if above 0 or cross down if below 0 (OFF By Default) user Request. @creid58
//FIXED - Plot Orders to Default what Plots are on top of each other
//FIXED - Two of the histogrm colors were backwrds

//------New V2.1 Update 12-07-2021----------
//Updated to PineScript V5

//------Minor Update 02-16-2022----------
//Per user request...Increased the Maxval for Signal Smoothing
//Next Add in Plot Types to Settings Pane.
//Next Add in more Moving Average types.
//See Video for Detailed Overview

//@version=5
indicator(title="_CM_MacD_Ult_MTF_V2.1", shorttitle="_CM_Ult_MacD_MTF_V2.1")
//Plot Inputs
res           = input.timeframe("",  "Indicator TimeFrame")
fast_length   = input.int(title="Fast Length", defval=12)
slow_length   = input.int(title="Slow Length", defval=26)
src           = input.source(title="Source", defval=close)
signal_length = input.int(title="Signal Smoothing", minval = 1, maxval = 999, defval = 5)
sma_source    = input.string(title="Oscillator MA Type", defval="EMA", options=["SMA", "EMA"])
sma_signal    = input.string(title="Signal Line MA Type", defval="EMA", options=["SMA", "EMA"])
// Show Plots T/F
show_macd     = input.bool(true, title="Show MACD Lines", group="Show Plots?", inline="SP10")
show_macd_LW  = input.int(3, minval=0, maxval=5, title = "MACD Width", group="Show Plots?", inline="SP11")
show_signal_LW= input.int(2, minval=0, maxval=5, title = "Signal Width", group="Show Plots?", inline="SP11")
show_Hist     = input.bool(true, title="Show Histogram", group="Show Plots?", inline="SP20")
show_hist_LW  = input.int(5, minval=0, maxval=5, title = "-- Width", group="Show Plots?", inline="SP20")
show_trend    = input.bool(true, title = "Show MACD Lines w/ Trend Color", group="Show Plots?", inline="SP30")
show_HB       = input.bool(false, title="Show Highlight Price Bars", group="Show Plots?", inline="SP40")
show_cross    = input.bool(false, title = "Show BackGround on Cross", group="Show Plots?", inline="SP50")
show_dots     = input.bool(true, title = "Show Circle on Cross", group="Show Plots?", inline="SP60")
show_dots_LW  = input.int(5, minval=0, maxval=5, title = "-- Width", group="Show Plots?", inline="SP60")

//show_trend    = input(true, title = "Colors MACD Lines w/ Trend Color", group="Show Plots?", inline="SP5")
// MACD Lines colors
col_macd      = input(#FF6D00, "MACD Line  ",  group="Color Settings", inline="CS1")
col_signal    = input(#2962FF, "Signal Line  ",  group="Color Settings", inline="CS1")
col_trnd_Up   = input(#4BAF4F, "Trend Up      ",  group="Color Settings", inline="CS2")
col_trnd_Dn   = input(#B71D1C, "Trend Down    ",  group="Color Settings", inline="CS2")
// Histogram Colors
col_grow_above = input(#26A69A, "Above   Grow",  group="Histogram Colors", inline="Hist10")
col_fall_above = input(#B2DFDB, "Fall",  group="Histogram Colors", inline="Hist10")
col_grow_below = input(#FF5252, "Below Grow",  group="Histogram Colors", inline="Hist20")
col_fall_below = input(#FFCDD2, "Fall",  group="Histogram Colors", inline="Hist20")
// Alerts T/F Inputs
alert_Long    = input.bool(true, title = "MACD Cross Up", group = "Alerts", inline="Alert10")
alert_Short   = input.bool(true, title = "MACD Cross Dn", group = "Alerts", inline="Alert10")
alert_Long_A  = input.bool(true, title = "MACD Cross Up & > 0", group = "Alerts", inline="Alert20")
alert_Short_B = input.bool(true, title = "MACD Cross Dn & < 0", group = "Alerts", inline="Alert20")
// Calculating
fast_ma = request.security(syminfo.tickerid, res, sma_source == "SMA" ? ta.sma(src, fast_length) : ta.ema(src, fast_length))
slow_ma = request.security(syminfo.tickerid, res, sma_source == "SMA" ? ta.sma(src, slow_length) : ta.ema(src, slow_length))
macd = fast_ma - slow_ma
signal = request.security(syminfo.tickerid, res, sma_signal == "SMA" ? ta.sma(macd, signal_length) : ta.ema(macd, signal_length))
hist = macd - signal
// MACD Trend and Cross Up/Down conditions
trend_up   = macd > signal
trend_dn   = macd < signal
cross_UP   = signal[1] >= macd[1] and signal < macd
cross_DN   = signal[1] <= macd[1] and signal > macd
cross_UP_A = (signal[1] >= macd[1] and signal < macd) and macd > 0
cross_DN_B = (signal[1] <= macd[1] and signal > macd) and macd < 0
// Condition that changes Color of MACD Line if Show Trend is turned on..
trend_col = show_trend  and trend_up ? col_trnd_Up : trend_up ? col_macd : show_trend  and trend_dn ? col_trnd_Dn: trend_dn ? col_macd : na

//Var Statements for Histogram Color Change
var bool histA_IsUp = false
var bool histA_IsDown = false
var bool histB_IsDown = false
var bool histB_IsUp = false
histA_IsUp   := hist == hist[1] ? histA_IsUp[1] : hist > hist[1] and hist > 0
histA_IsDown := hist == hist[1] ? histA_IsDown[1] : hist < hist[1] and hist > 0
histB_IsDown := hist == hist[1] ? histB_IsDown[1] : hist < hist[1] and hist <= 0
histB_IsUp   := hist == hist[1] ? histB_IsUp[1] : hist > hist[1] and hist <= 0

hist_col =  histA_IsUp ? col_grow_above : histA_IsDown ? col_fall_above : histB_IsDown ? col_grow_below : histB_IsUp ? col_fall_below :color.silver

// Plot Statements
//Background Color
bgcolor(show_cross and cross_UP ? col_trnd_Up : na, editable=false)
bgcolor(show_cross and cross_DN ? col_trnd_Dn : na, editable=false)
//Highlight Price Bars
barcolor(show_HB and trend_up ? col_trnd_Up : na, title="Trend Up", offset = 0, editable=false)
barcolor(show_HB and trend_dn ? col_trnd_Dn : na, title="Trend Dn", offset = 0, editable=false)
//Regular Plots
plot(show_Hist and hist ? hist : na, title="Histogram", style=plot.style_columns, color=color.new(hist_col ,0),linewidth=show_hist_LW)
plot(show_macd  and signal ? signal : na, title="Signal", color=color.new(col_signal, 0),  style=plot.style_line ,linewidth=show_signal_LW)
plot(show_macd  and macd ? macd : na, title="MACD", color=color.new(trend_col, 0),  style=plot.style_line ,linewidth=show_macd_LW)
hline(0, title="0 Line", color=color.new(color.gray, 0), linestyle=hline.style_dashed, linewidth=1, editable=false)
plot(show_dots and cross_UP ? macd : na, title="Dots", color=color.new(trend_col ,0), style=plot.style_circles, linewidth=show_dots_LW, editable=false)
plot(show_dots and cross_DN ? macd : na, title="Dots", color=color.new(trend_col ,0), style=plot.style_circles, linewidth=show_dots_LW, editable=false)

//Alerts
if alert_Long and cross_UP
    alert("Symbol = (" + syminfo.tickerid + ") TimeFrame = (" + timeframe.period + ") Current Price (" + str.tostring(close) + ") MACD Crosses Up.", alert.freq_once_per_bar_close)

if alert_Short and cross_DN
    alert("Symbol = (" + syminfo.tickerid + ") TimeFrame = (" + timeframe.period + ") Current Price (" + str.tostring(close) + ") MACD Crosses Down.", alert.freq_once_per_bar_close)
//Alerts - Stricter Condition - Only Alerts When MACD Crosses UP & MACD > 0 -- Crosses Down & MACD < 0
if alert_Long_A and cross_UP_A
    alert("Symbol = (" + syminfo.tickerid + ") TimeFrame = (" + timeframe.period + ") Current Price (" + str.tostring(close) + ") MACD > 0 And Crosses Up.", alert.freq_once_per_bar_close)

if alert_Short_B and cross_DN_B
    alert("Symbol = (" + syminfo.tickerid + ") TimeFrame = (" + timeframe.period + ") Current Price (" + str.tostring(close) + ") MACD < 0 And Crosses Down.", alert.freq_once_per_bar_close)

//End Code

if alert_Long_A and cross_UP_A
    strategy.entry("Enter Long", strategy.long)
else if alert_Short_B and cross_DN_B
strategy.entry("Enter Short", strategy.short)Published by ChaoZhang on the FMZ strategy square · last modified 2022-05-20. Collected in the Quant Trading Vault. Unvalidated research: re-test with your own data and costs before trusting it.
Build this with AgenKit
A spec is not a trading system. Paste this into your coding agent and AgenKit runs a specialist team — architecture, test-first build, risk gates, review — with paper trading on by default.
/agenkit build a production-grade trading bot with a backtest engine, risk controls and paper trading by default from strategies/CM-MACD-Custom-Indicator-Multiple-Time-Frame-V2.md- npx agenkit install engineering-kit in your project
- Paste the command into your agent and approve each phase
- Get tests, backtest, risk controls and a paper-trading switch
Understand it first
Before you run this, read the lesson behind the idea and how to backtest it honestly. Specs like this one are the survivors of an unknown number of trials; deflate their results accordingly.
Related specs
- EMA RSI and MACD Based Multi Timeframe Trading StrategyPine Script · Multi-timeframe · 1h
- MacD Custom Indicator Multiple Time FrameAll Available OptionsPine Script · Multi-timeframe · 1h
- Multi Timeframe Adaptive Market Regime Quantitative Trading StrategyPine Script · Multi-timeframe · 1m
- Multi Timeframe Moving Average System Trading StrategyPine Script · Multi-timeframe · 4h
- Multi Timeframe Moving Average Trading StrategyPine Script · Multi-timeframe · 7d
- Time and Space Optimized Multi Timeframe MACD StrategyPine Script · Multi-timeframe · 1h