CMO and WMA Based Dual Moving Average Trading Strategy
This strategy is a dual moving average trading strategy based on the price momentum indicator Chandre Momentum Oscillator (CMO) and its Weighted Moving Average (WMA). It attempts to identify trend reversals and…
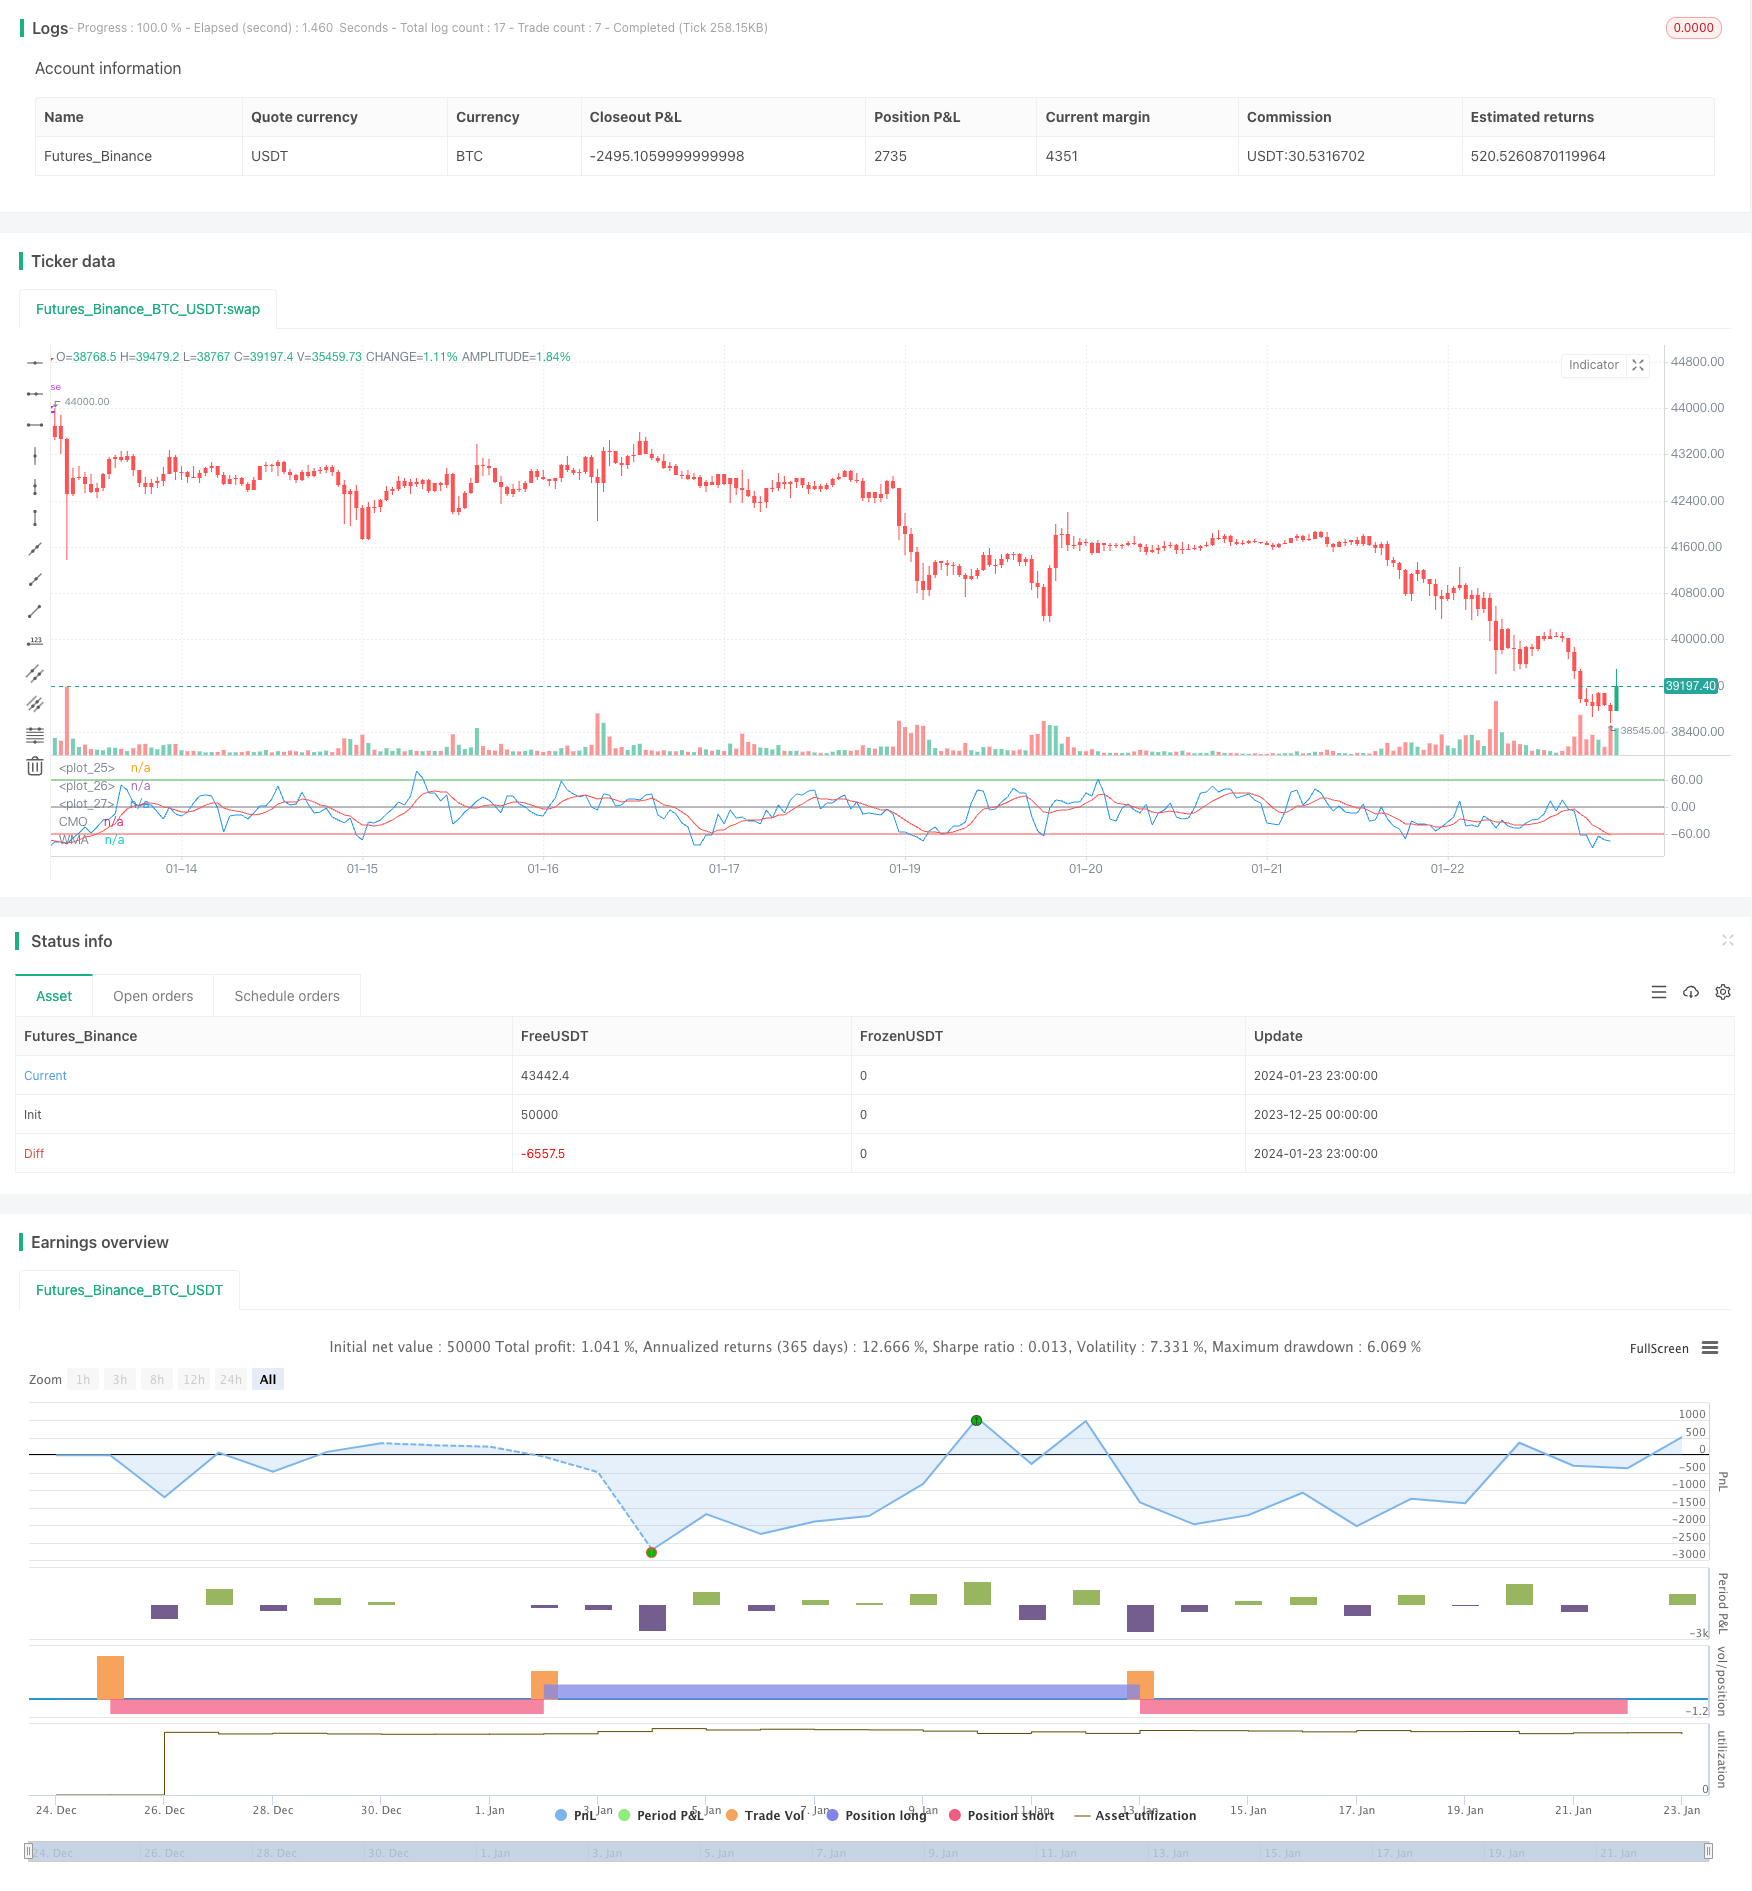
Overview
This strategy is a dual moving average trading strategy based on the price momentum indicator Chandre Momentum Oscillator (CMO) and its Weighted Moving Average (WMA). It attempts to identify trend reversals and continuation using CMO crossover its WMA.
Strategy Logic
The strategy first calculates CMO, which measures the net change in price momentum. Positive values indicate upside momentum while negative values indicate downside momentum. It then calculates the WMA of CMO. When CMO crosses above its WMA, a long position is taken; when CMO crosses below its WMA, a short position is taken. The strategy attempts to capture turning points in the trend using CMO and WMA crossovers.
The key steps in calculating CMO are:
- Calculate the daily price change (xMom)
- Take n-day SMA of price change as the "true" price momentum (xSMA_mom)
- Calculate n-day net price change (xMomLength)
- Standardize the net price change (nRes) by dividing by the SMA
- Take m-day WMA of the standardized net price change to get CMO (xWMACMO)
The advantage of this strategy is capturing medium-term trend reversals in price. The absolute magnitude of CMO reflects the strength of the price run, while the WMA helps filter out false breakouts.
Advantage Analysis
The biggest advantage of this strategy is using the absolute value of CMO to gauge market crowd sentiment and using the WMA filter to identify turning points in the medium-term trend. Compared to single moving average strategies, it is better able to capture medium-term trends with higher elasticity.
CMO standardizes price changes and maps them into a -100 to 100 range for easier judgment of market crowd sentiment; absolute magnitude represents strength of current trend. The WMA provides additional filtering on CMO to avoid excessive false signals.
Risk Analysis
The main risks that may exist in this strategy are:
- Improper CMO and WMA parameter settings leading to excessive false signals
- Inability to effectively handle trending oscillations, resulting in high trading frequency and slippage costs
- Failure to identify true long term trends, leading to losses in long term positions
Corresponding optimization methods:
- Adjust CMO and WMA parameters to find optimal combination
- Add supplementary filters like volume energy to avoid trading in oscillating markets
- Incorporate longer term indicators like 90-day MA to avoid missing opportunities in long term trends
Optimization Directions
The main optimization directions for this strategy are around parameter tuning, signal filtering and stop losses:
- CMO and WMA parameter optimization through brute force testing
- Supplementary signal filtering using volume, strength indicators etc. to avoid false breakouts
- Incorporating dynamic stop losses to exit when price breaks back below CMO and WMA
- Considering Breakout Failure patterns as entry signals when CMO and WMA first break key levels but quickly fall back
- Judging the major trend using longer term indicators to avoid counter-trend trading
Conclusion
Overall this strategy uses CMO to judge trend strength and turning points, combined with the WMA filter to generate trading signals, a typical dual moving average system. Compared to single MA strategies, it has a stronger advantage in capturing elastic medium-term trends. But there is still room for optimization around parameters, filtering and stop losses. Controlling trade frequency and incorporating dynamic stops can further improve system stability.
Parameters
| Name | Default | What it controls |
|---|---|---|
| v_input_1 | 9 | Length |
| v_input_2 | 9 | LengthWMA |
| v_input_3 | 60 | BuyZone |
| v_input_4 | -60 | SellZone |
| v_input_5 | false | Trade reverse |
Source Pine Script
/*backtest
start: 2023-12-25 00:00:00
end: 2024-01-24 00:00:00
period: 1h
basePeriod: 15m
exchanges: [{"eid":"Futures_Binance","currency":"BTC_USDT"}]
*/

//@version=3
////////////////////////////////////////////////////////////
//  Copyright by HPotter v1.0 18/10/2018
//    This indicator plots Chandre Momentum Oscillator and its WMA on the
//    same chart. This indicator plots the absolute value of CMO.
//    The CMO is closely related to, yet unique from, other momentum oriented
//    indicators such as Relative Strength Index, Stochastic, Rate-of-Change,
//    etc. It is most closely related to Welles Wilder?s RSI, yet it differs
//    in several ways:
//    - It uses data for both up days and down days in the numerator, thereby
//        directly measuring momentum;
//    - The calculations are applied on unsmoothed data. Therefore, short-term
//        extreme movements in price are not hidden. Once calculated, smoothing
//        can be applied to the CMO, if desired;
//    - The scale is bounded between +100 and -100, thereby allowing you to clearly
//        see changes in net momentum using the 0 level. The bounded scale also allows
//        you to conveniently compare values across different securities.
////////////////////////////////////////////////////////////
strategy(title="CMO & WMA Backtest ver 2.0", shorttitle="CMO & WMA")
Length = input(9, minval=1)
LengthWMA = input(9, minval=1)
BuyZone = input(60, step = 0.01)
SellZone = input(-60, step = 0.01)
reverse = input(false, title="Trade reverse")
hline(BuyZone, color=green, linestyle=line)
hline(SellZone, color=red, linestyle=line)
hline(0, color=gray, linestyle=line)
xMom = abs(close - close[1])
xSMA_mom = sma(xMom, Length)
xMomLength = close - close[Length]
nRes = 100 * (xMomLength / (xSMA_mom * Length))
xWMACMO = wma(nRes, LengthWMA)
pos = 0.0
pos := iff(xWMACMO > BuyZone, 1,
	   iff(xWMACMO < SellZone, -1, nz(pos[1], 0)))
possig = iff(reverse and pos == 1, -1,
          iff(reverse and pos == -1, 1, pos))
if (possig == 1)
    strategy.entry("Long", strategy.long)
if (possig == -1)
    strategy.entry("Short", strategy.short)
barcolor(possig == -1 ? red: possig == 1 ? green : blue )
plot(nRes, color=blue, title="CMO")
plot(xWMACMO, color=red, title="WMA")
Published by ChaoZhang on the FMZ strategy square · last modified 2024-01-25. Collected in the Quant Trading Vault. Unvalidated research: re-test with your own data and costs before trusting it.
Build this with AgenKit
A spec is not a trading system. Paste this into your coding agent and AgenKit runs a specialist team — architecture, test-first build, risk gates, review — with paper trading on by default.
/agenkit build a production-grade trading bot with a backtest engine, risk controls and paper trading by default from strategies/CMO-and-WMA-Based-Dual-Moving-Average-Trading-Strategy.md- npx agenkit install engineering-kit in your project
- Paste the command into your agent and approve each phase
- Get tests, backtest, risk controls and a paper-trading switch
Understand it first
Before you run this, read the lesson behind the idea and how to backtest it honestly. Specs like this one are the survivors of an unknown number of trials; deflate their results accordingly.
Related specs
- Bull Market Tracking SystemPine Script · Breakout · 1h
- Dynamic Stop Loss Strategy Adaptive to ATR FluctuationsPine Script · Breakout · 1h
- Stochastic RSI and Volume Based Trading StrategyPine Script · Breakout · 2h
- Bollinger Bands Stochastic RSI Extreme Signal StrategyPine Script · Breakout · 1d
- Dual Moving Average and MACD Combination Short term Trading StrategyPine Script · Breakout · 1h
- Momentum Breakout Strategy 428972Pine Script · Breakout · 1h