Strategy vault / Mean reversion
Connors Dual Moving Average RSI Reversal Trading Strategy
The Connors Dual Moving Average RSI Reversal Trading Strategy combines the Relative Strength Index (RSI) and dual moving averages to identify high probability reversal trading opportunities. When the short-term and…
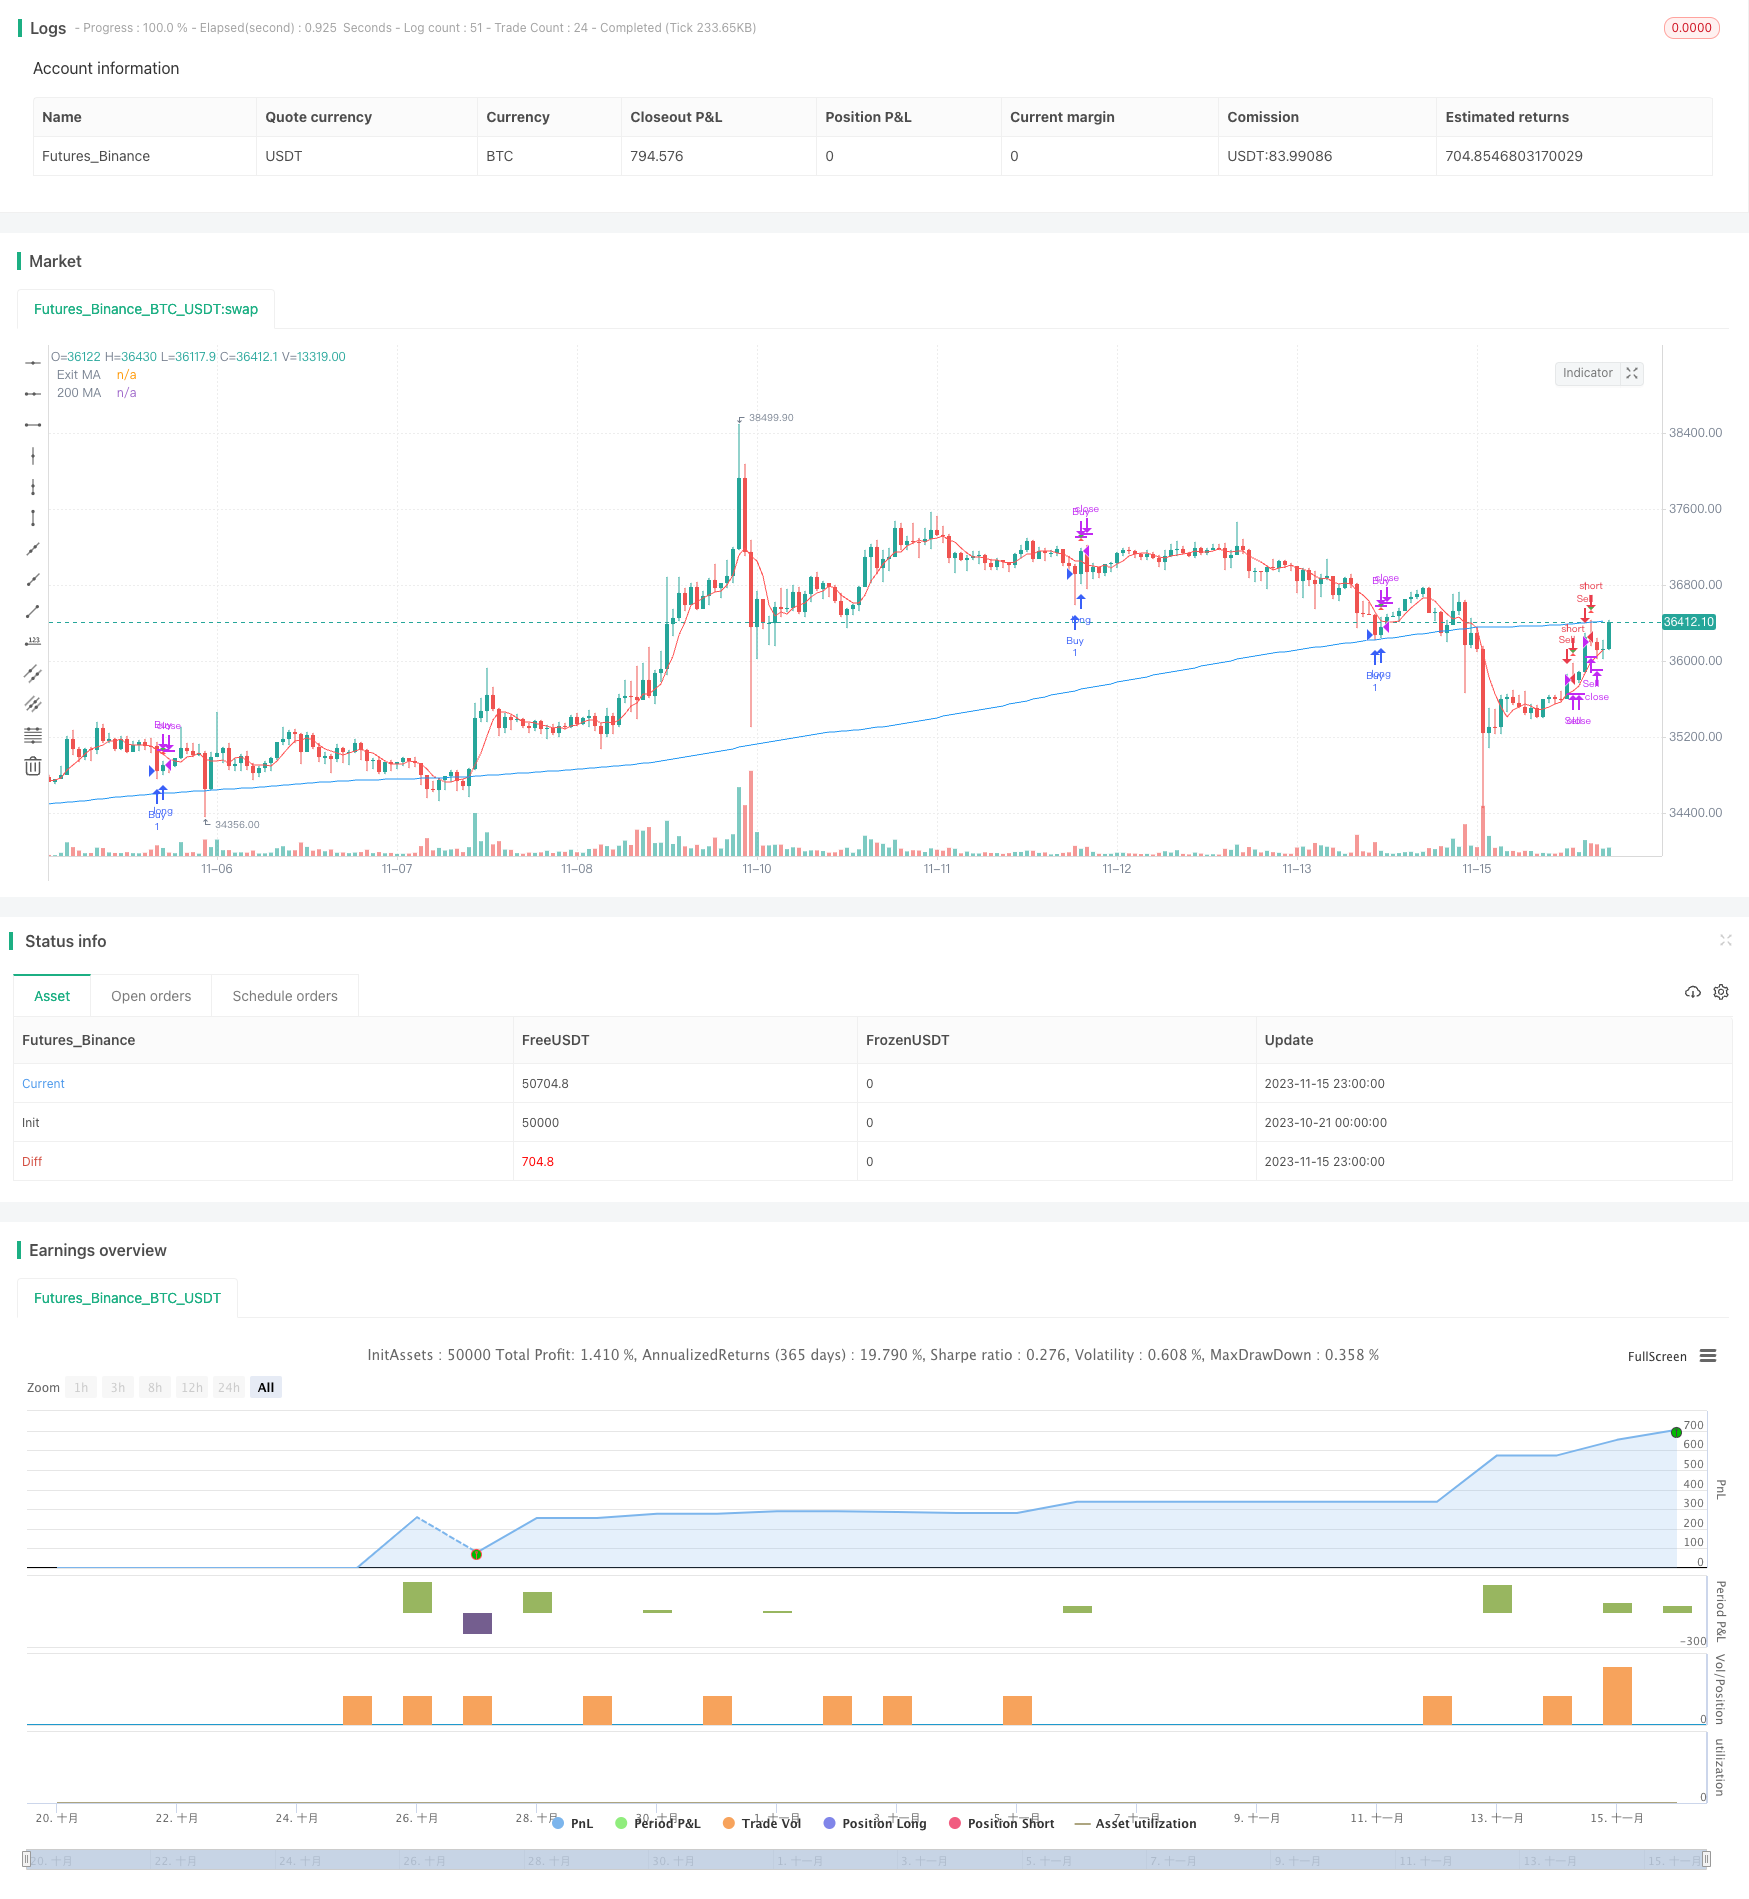
Overview
The Connors Dual Moving Average RSI Reversal Trading Strategy combines the Relative Strength Index (RSI) and dual moving averages to identify high probability reversal trading opportunities. When the short-term and long-term trends reverse direction, this strategy judges that the market is about to turn and establishes a position.
Strategy Principle
This strategy utilizes both RSI and dual moving averages to determine market trends. First, it calculates a 2-period RSI to judge short-term trend reversals. Second, it calculates a 200-period moving average to determine the long-term trend direction. When the short-term RSI bounces back from the overbought/oversold area and moves against the long-term trend, it signals that the market is about to reverse and a trading position can be established.
Entry signals: Go long when RSI is below the oversold area (default 5) and short-term price is above long-term price; Go short when RSI is above the overbought area (default 95) and short-term price is below long-term price.
Exit signals: Exit when the 5-period short-term moving average gives a signal opposite to the entry direction; or stop loss (default 3% loss).
Advantage Analysis
This strategy combines multiple indicators to judge market structure and can improve the accuracy of trading. Specific advantages are:
- Use RSI to determine short-term reversal points and moving averages to filter the reliability of reversal signals
- Dual moving averages form a strong filtering to avoid delays
- The short-term moving average re-verifies the reversal signal to ensure high probability exits
- Good risk control with stop loss mechanism
Risk Analysis
There are some risks with this strategy:
- RSI indicators are more likely to give incorrect signals during violent market fluctuations
- Multi-indicator combo judgments make parameter optimization complex
- Reversals are not guaranteed to succeed, timely stop losses are needed
Optimization Directions
This strategy can be optimized in several aspects:
- Optimize RSI parameters to find the best reversal parameter combination
- Test different types of moving average parameters
- Optimize stop loss strategies to find the best stop loss points
- Add trend judgment indicators to avoid failed reversals
Conclusion
The Connors Dual Moving Average RSI Reversal Trading Strategy captures market reversals at high probability positions by filtering RSI reversal signals with dual moving averages. This strategy utilizes multiple indicators to improve stability. Next, through parameter optimization and risk control improvements, it has the potential to further expand the advantages of the strategy and achieve higher trading efficiency.
Parameters
| Name | Default | What it controls |
|---|---|---|
| v_input_1 | 2 | RSI Length |
| v_input_2 | 200 | MA Length |
| v_input_3 | 5 | Exit MA Length |
| v_input_4 | 95 | Overbought Threshold |
| v_input_5 | 5 | Oversold Threshold |
| v_input_6 | 3 | Stop Loss Percentage |
Source Pine Script
/*backtest
start: 2023-10-21 00:00:00
end: 2023-11-16 00:00:00
period: 1h
basePeriod: 15m
exchanges: [{"eid":"Futures_Binance","currency":"BTC_USDT"}]
*/

//@version=5
strategy("Connors RSI-MA Strategy", overlay=true)

// Strategy parameters
rsiLength = input(2, title="RSI Length")
maLength = input(200, title="MA Length")
exitMaLength = input(5, title="Exit MA Length")
overboughtThreshold = input(95, title="Overbought Threshold")
oversoldThreshold = input(5, title="Oversold Threshold")
stopLossPercentage = input(3, title="Stop Loss Percentage")

// 2-period RSI
rsi2 = ta.rsi(close, rsiLength)

// 200-period MA
ma200 = ta.sma(close, maLength)

// 5-period MA for exit signals
ma5_exit = ta.sma(close, exitMaLength)

// Positive trend condition
positiveTrend = close > ma200

// Negative trend condition
negativeTrend = close < ma200

// Buy and sell conditions
buyCondition = rsi2 < oversoldThreshold and positiveTrend
sellCondition = rsi2 > overboughtThreshold and negativeTrend

// Exit conditions
exitLongCondition = close > ma5_exit
exitShortCondition = close < ma5_exit

// Stop Loss
stopLossLevelLong = strategy.position_avg_price * (1 - stopLossPercentage / 100)
stopLossLevelShort = strategy.position_avg_price * (1 + stopLossPercentage / 100)

// Strategy logic
if (buyCondition)
    strategy.entry("Buy", strategy.long)

if (sellCondition)
    strategy.entry("Sell", strategy.short)

if (exitLongCondition or close >= stopLossLevelLong)
    strategy.close("Buy")

if (exitShortCondition or close <= stopLossLevelShort)
    strategy.close("Sell")

// Plotting
plot(ma200, title="200 MA", color=color.blue)
plot(ma5_exit, title="Exit MA", color=color.red)

// Plot stop loss levels
plotshape(series=stopLossLevelLong, title="Long Stop Loss", color=color.green, style=shape.triangledown, size=size.small)
plotshape(series=stopLossLevelShort, title="Short Stop Loss", color=color.red, style=shape.triangleup, size=size.small)
Published by ChaoZhang on the FMZ strategy square · last modified 2023-11-21. Collected in the Quant Trading Vault. Unvalidated research: re-test with your own data and costs before trusting it.
Build this with AgenKit
A spec is not a trading system. Paste this into your coding agent and AgenKit runs a specialist team — architecture, test-first build, risk gates, review — with paper trading on by default.
/agenkit build a production-grade trading bot with a backtest engine, risk controls and paper trading by default from strategies/Connors-Dual-Moving-Average-RSI-Reversal-Trading-Strategy.md- npx agenkit install engineering-kit in your project
- Paste the command into your agent and approve each phase
- Get tests, backtest, risk controls and a paper-trading switch
Understand it first
Before you run this, read the lesson behind the idea and how to backtest it honestly. Specs like this one are the survivors of an unknown number of trials; deflate their results accordingly.
Related specs
- Adaptive Mean Reversion Trading Strategy Based on Chande Momentum OscillatorPine Script · Mean reversion · 1d
- Advanced 15 Minute Chart Trading Signal StrategyPine Script · Mean reversion · 3h
- Advanced Momentum EMA Trend Following with RSI Overbought Oversold Trading StrategyPine Script · Mean reversion · 1d
- Advanced Quantitative Trading Strategy Combining RSI Divergence and Moving AveragesPine Script · Mean reversion · 1h
- Advanced Strategy with Volume and Price Pullback Multiple Take ProfitPine Script · Mean reversion · 1h
- BONK Multi Factor Trading StrategyPine Script · Mean reversion · 1d