Consolidation Breakout Strategy 440542
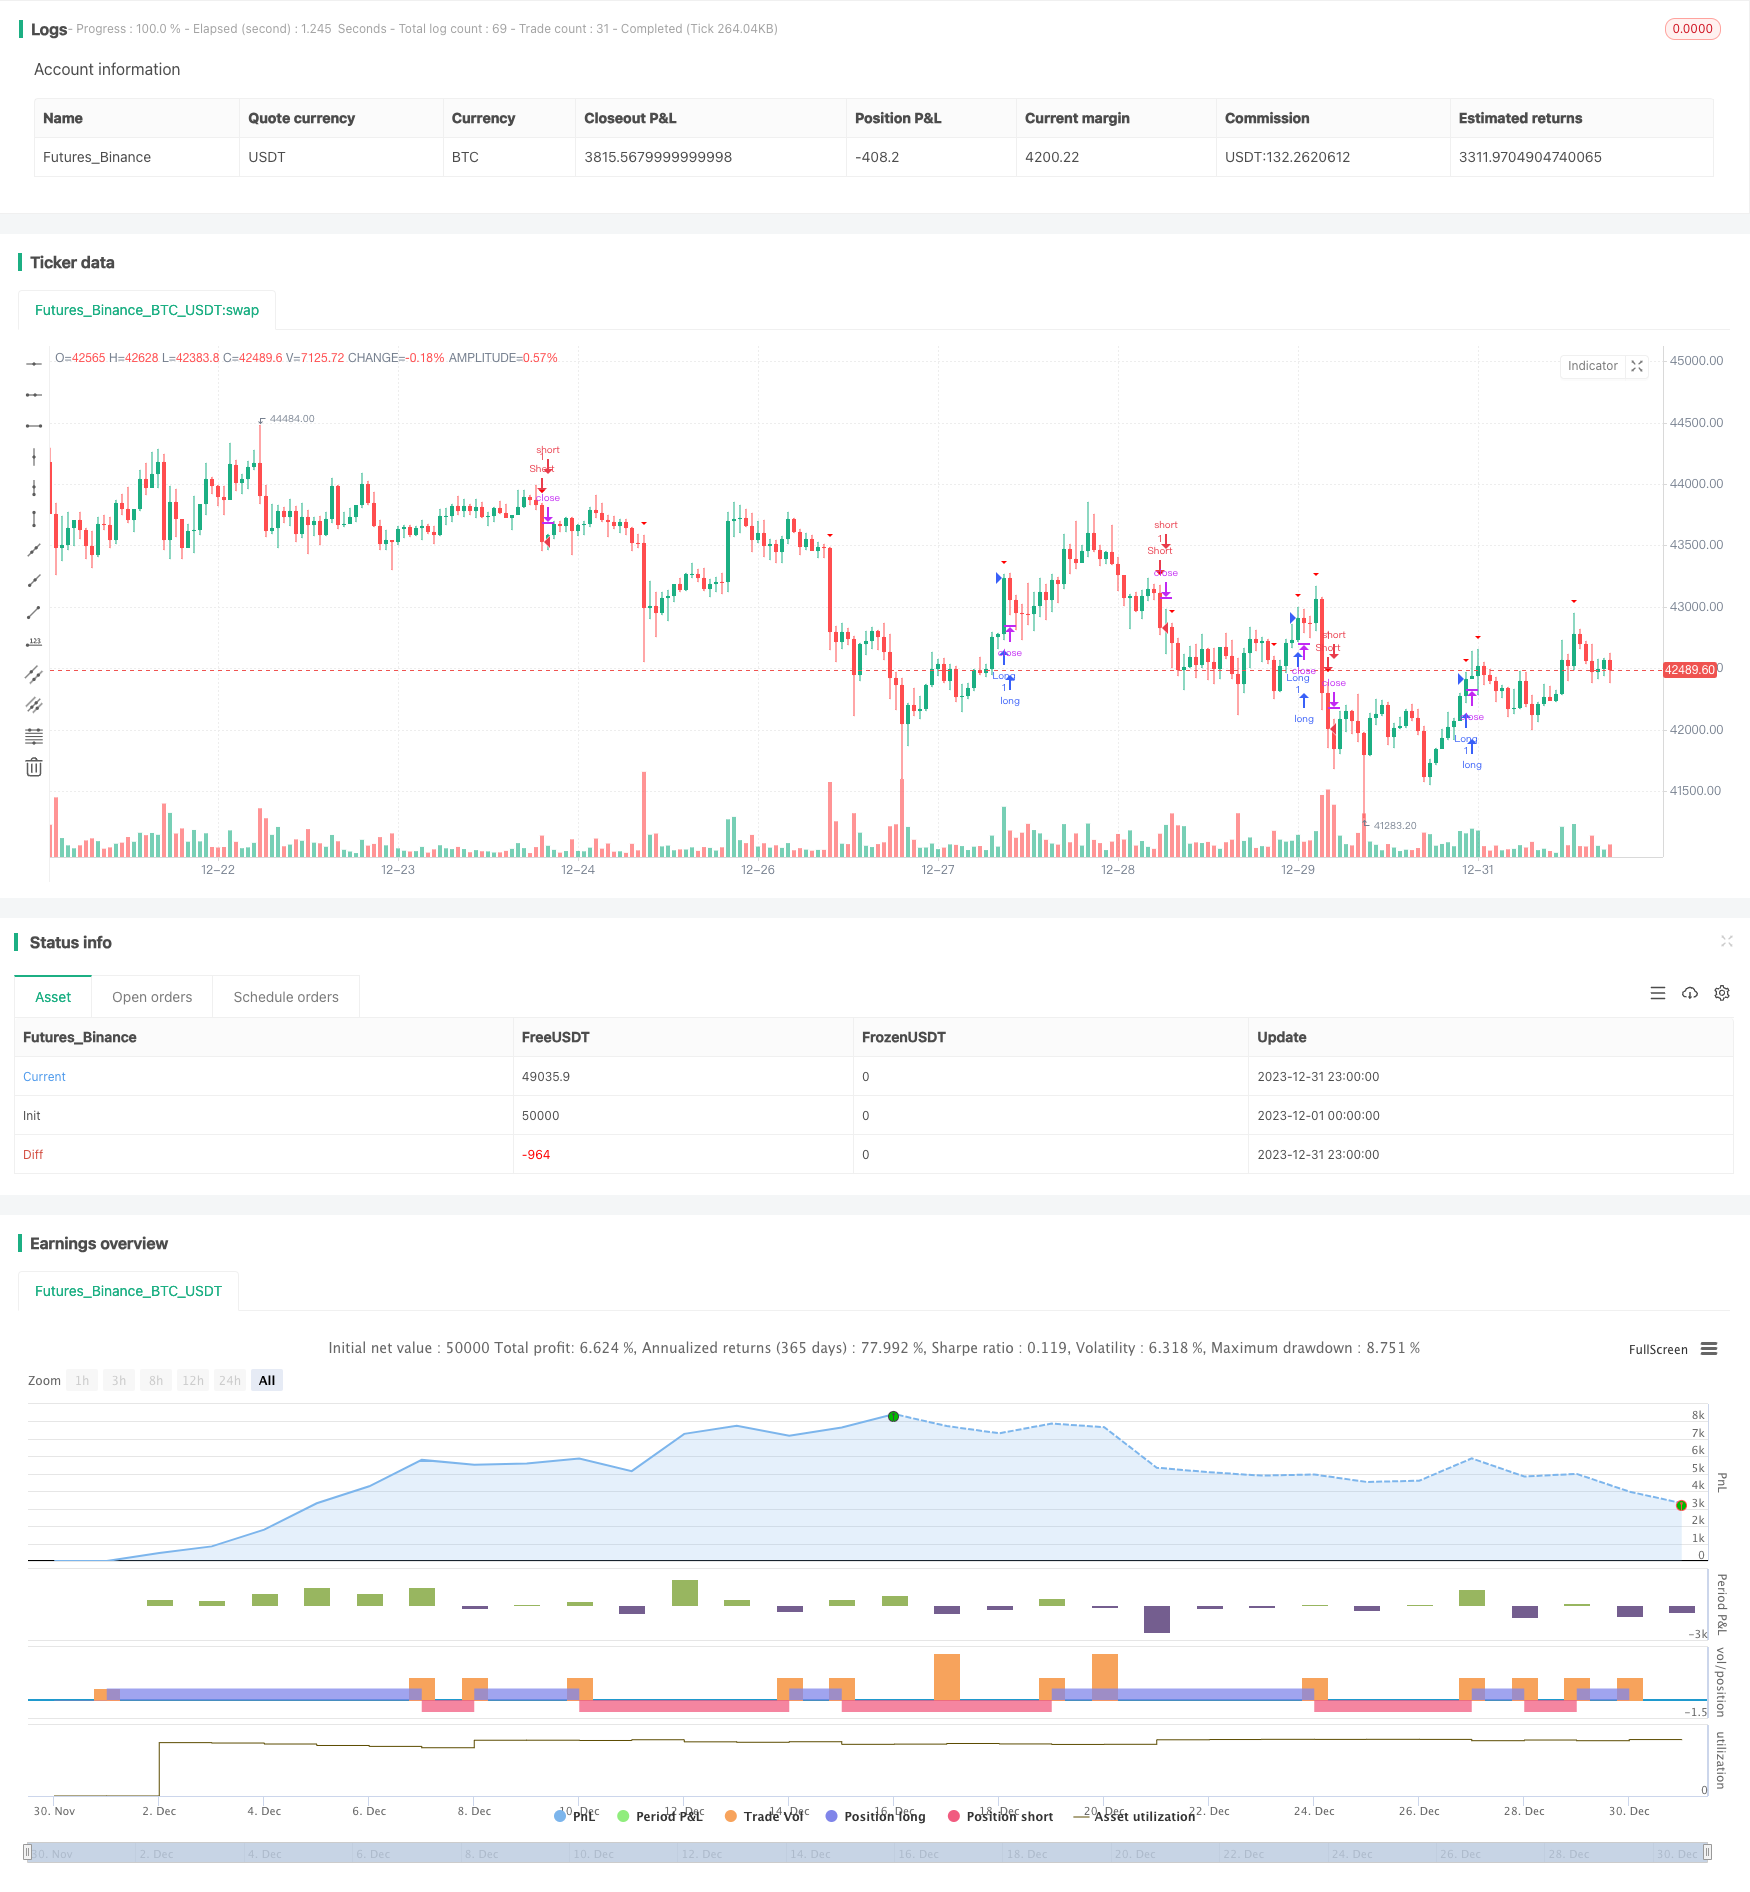
This strategy uses the Bollinger Bands indicator to determine if prices are in a consolidation period, and breakouts to determine entries and exits. Overall, this strategy mainly takes advantage of the violent moves…
Overview
This strategy uses the Bollinger Bands indicator to determine if prices are in a consolidation period, and breakouts to determine entries and exits. Overall, this strategy mainly takes advantage of the violent moves brought by price consolidations to make profits.
Strategy Logic
The strategy first calculates the 20-day simple moving average of the closing price as the middle band of the Bollinger Bands, and 2 times the standard deviation as the band width. A close above the upper band indicates an upper band breakout, while a close below the lower band indicates a lower band breakout.
When prices are between the upper and lower Bollinger Bands, it is considered a consolidation period. When a breakout signal is detected, go long. When prices break below the lower band again, close the position. Going short works similarly.
The stop loss is set at 2 times the ATR indicator.
Advantage Analysis
The main advantages of this strategy are:
- Taking advantage of violent moves brought by price consolidations for potentially huge profits
- Bollinger Bands indicator is intuitive and easy to optimize parameters
- Following major trends, avoiding buying tops and selling bottoms
Risk Analysis
There are also some risks:
- Breakout signals may turn out to be false breaks, causing losses
- Stop loss set too wide, leading to large losses
- Bollinger Bands parameters set improperly, losing effectiveness
Counter measures:
- Add volume filters to detect false breaks
- Optimize stop loss range to limit losses
- Test different BB parameters to find optimum
Optimization Directions
Some ways to improve the strategy:
- Add more indicators to consolidate detection rules to avoid false signals
- Add trend filter to determine long/short based on trend direction
- Enhance stop loss methods like trailing stop to better control risks
Conclusion
The strategy is simple and straight forward, profiting from energy buildup during consolidations. Huge optimization space exists around entry rules, stop loss methods etc to obtain more steady profits while controlling risks.
Parameters
| Name | Default | What it controls |
|---|---|---|
| v_input_1 | 20 | Bollinger Bands Length |
| v_input_2 | 2 | Bollinger Bands Multiplier |
| v_input_float_1 | true | Risk per Trade (%) |
| v_input_float_2 | 2 | Stop Loss Multiplier |
Source Pine Script
/*backtest
start: 2023-12-01 00:00:00
end: 2023-12-31 23:59:59
period: 1h
basePeriod: 15m
exchanges: [{"eid":"Futures_Binance","currency":"BTC_USDT"}]
*/

//@version=5
strategy("Consolidation Breakout Strategy", shorttitle="CBS", overlay=true)

// Parameters
length = input(20, title="Bollinger Bands Length")
mult = input(2.0, title="Bollinger Bands Multiplier")
risk = input.float(1, title="Risk per Trade (%)") / 100

// Calculate Bollinger Bands
basis = ta.sma(close, length)
dev = mult * ta.stdev(close, length)
upper = basis + dev
lower = basis - dev

// Entry Conditions
consolidating = ta.crossover(close, upper) and ta.crossunder(close, lower)

// Exit Conditions
breakout = ta.crossover(close, upper) or ta.crossunder(close, lower)

// Risk Management
atrVal = ta.atr(14)
stopLoss = atrVal * input.float(2, title="Stop Loss Multiplier", minval=0.1, maxval=5)

// Entry and Exit Conditions
longEntry = breakout and close > upper
shortEntry = breakout and close < lower

if (longEntry)
    strategy.entry("Long", strategy.long)

if (shortEntry)
    strategy.entry("Short", strategy.short)

if (longEntry and close < basis - stopLoss)
    strategy.close("Long Exit")

if (shortEntry and close > basis + stopLoss)
    strategy.close("Short Exit")

// Plot Entry and Exit Points
plotshape(consolidating, style=shape.triangleup, location=location.belowbar, color=color.rgb(30, 255, 0), title="Entry Signal")
plotshape(breakout, style=shape.triangledown, location=location.abovebar, color=color.rgb(255, 0, 0), title="Exit Signal")
Published by ChaoZhang on the FMZ strategy square · last modified 2024-01-31. Collected in the Quant Trading Vault. Unvalidated research: re-test with your own data and costs before trusting it.
Build this with AgenKit
A spec is not a trading system. Paste this into your coding agent and AgenKit runs a specialist team — architecture, test-first build, risk gates, review — with paper trading on by default.
/agenkit build a production-grade trading bot with a backtest engine, risk controls and paper trading by default from strategies/Consolidation-Breakout-Strategy-440542.md- npx agenkit install engineering-kit in your project
- Paste the command into your agent and approve each phase
- Get tests, backtest, risk controls and a paper-trading switch
Understand it first
Before you run this, read the lesson behind the idea and how to backtest it honestly. Specs like this one are the survivors of an unknown number of trials; deflate their results accordingly.
Related specs
- Bollinger Band Breakout Trading StrategyPine Script · Breakout · 2h
- Enhanced Bollinger Breakout Quantitative Strategy with Momentum Filter Integration SystemPine Script · Breakout · 2d
- High Precision RSI and Bollinger Bands Breakout Strategy with Optimized Risk Reward RatioPine Script · Breakout · 1h
- Dynamic Range Breakout Trading Strategy Based on Bollinger Bands and RSIPine Script · Breakout · 1d
- Hybrid Trading Strategy Based on Volatility Breakout and Multiple Technical IndicatorsPine Script · Breakout · 1d
- RSI and Bollinger Bands Synergistic Swing Trading StrategyPine Script · Breakout · 1h