Correlation based Bullish Bearish Crypto Trading Strategy Based on Wall Street CCI Index
This is an automated trading strategy that generates long/short/close signals on the target crypto currency based on the calculated trend of a benchmark crypto currency considered correlated with it, using the Wall…
Overview
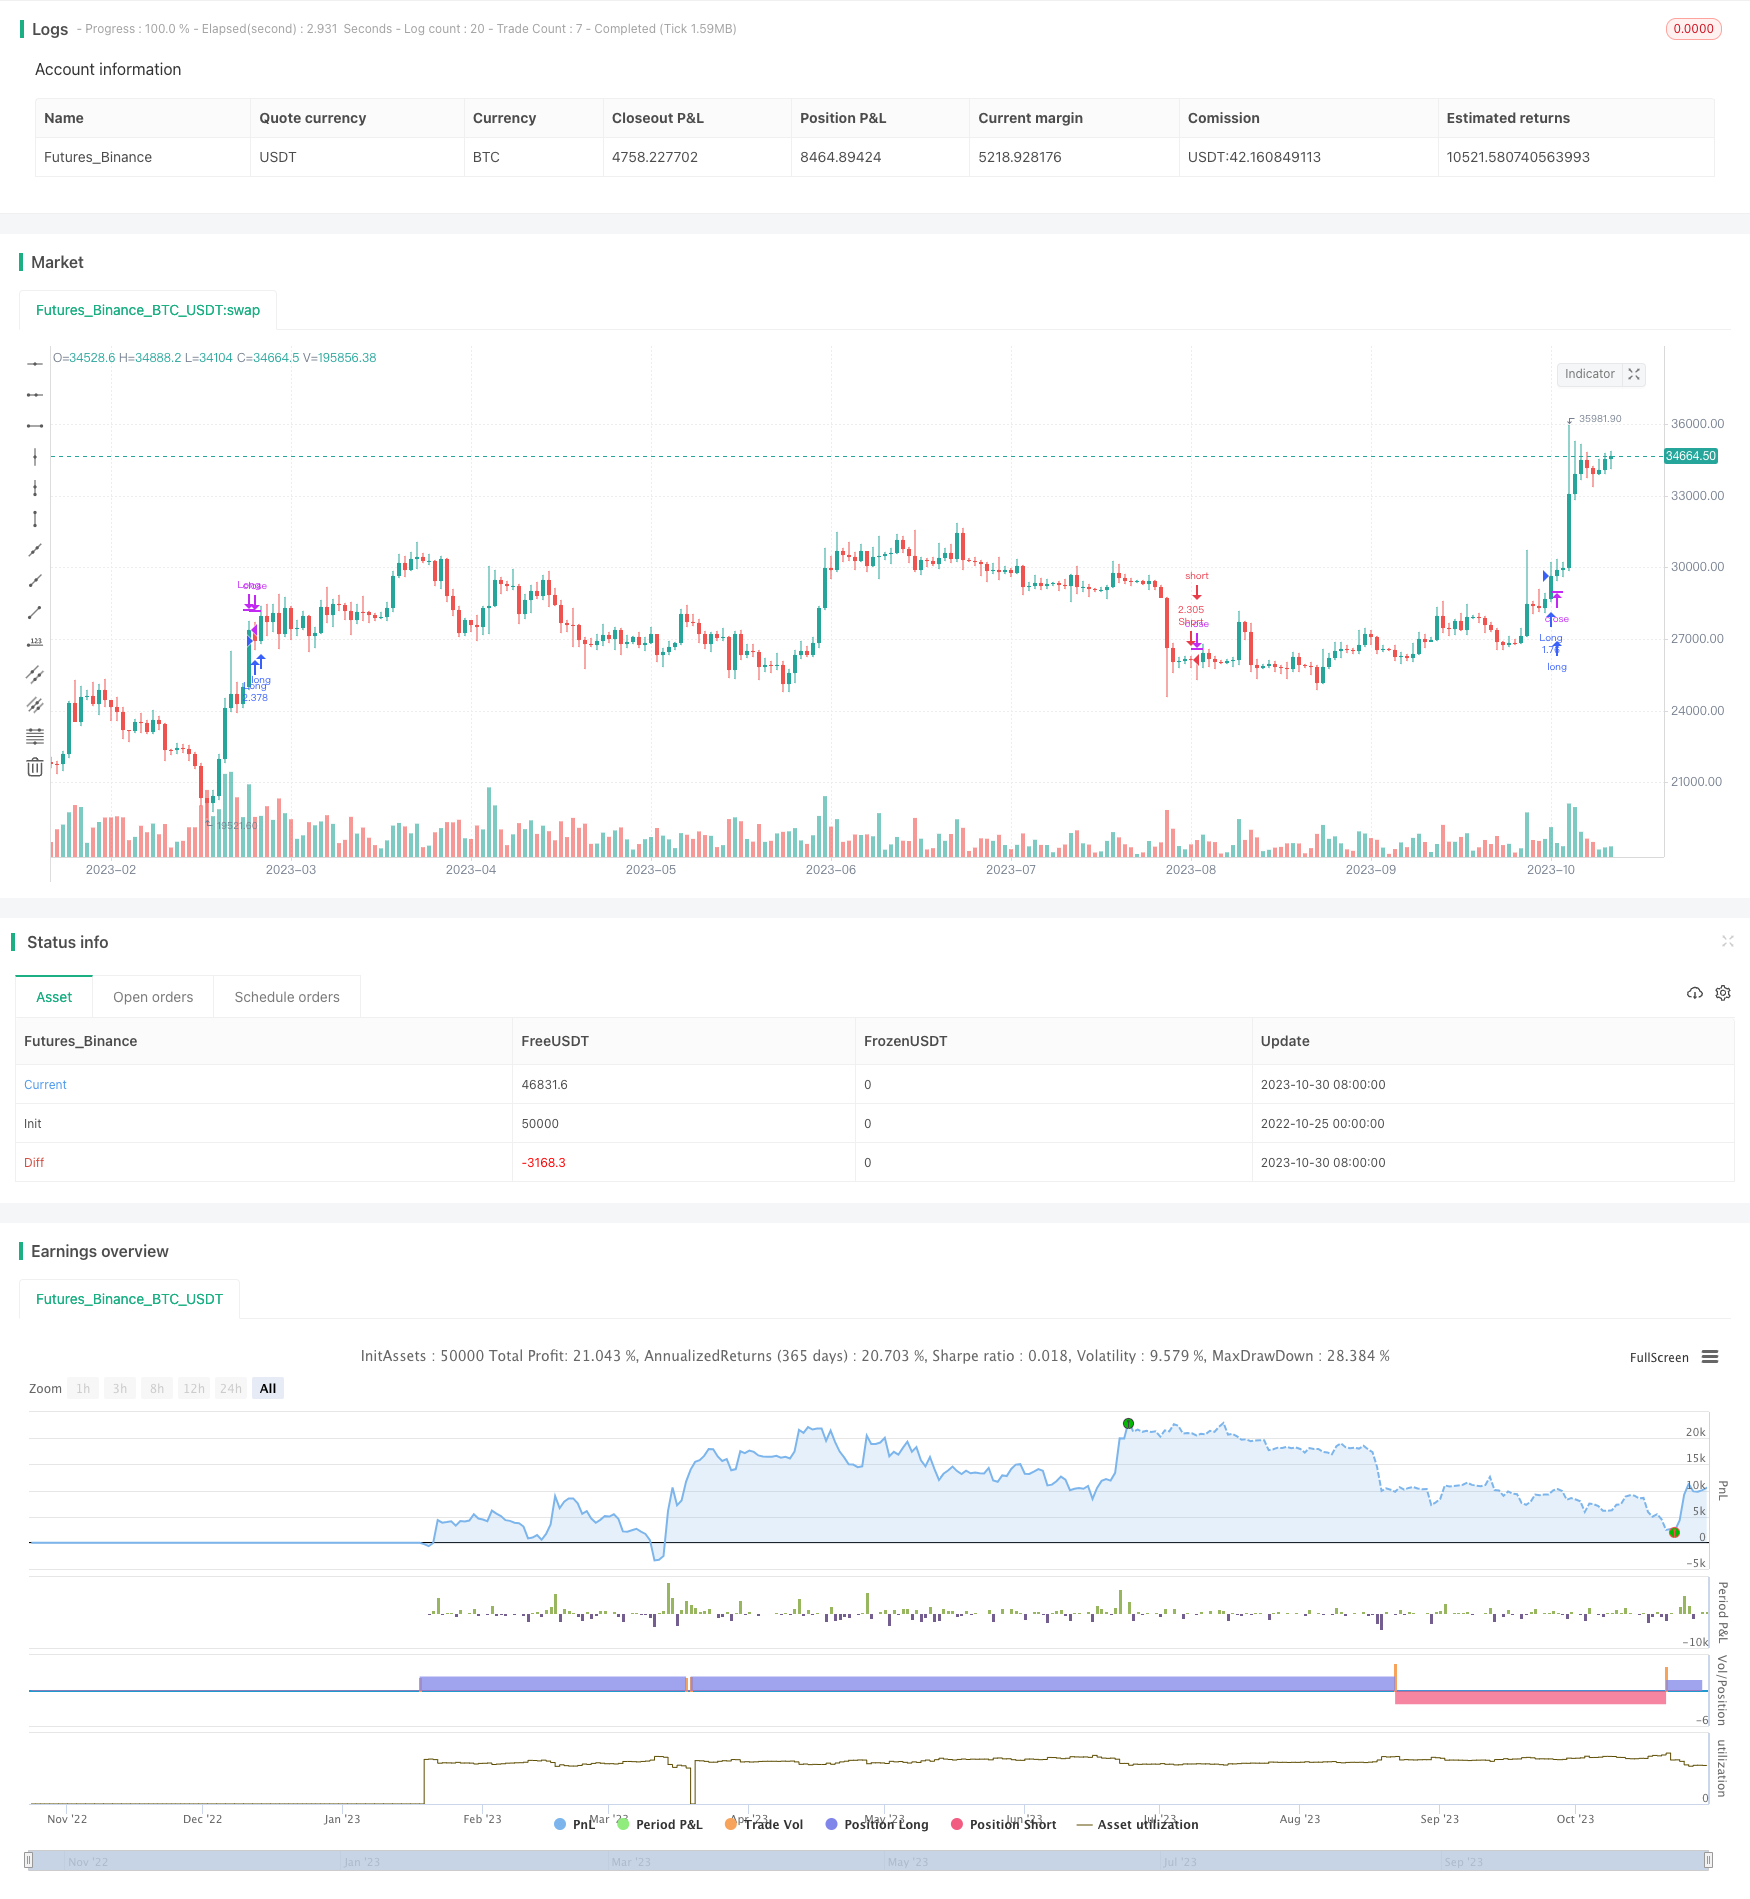
This is an automated trading strategy that generates long/short/close signals on the target crypto currency based on the calculated trend of a benchmark crypto currency considered correlated with it, using the Wall Street Chasing Ring Index.
With default parameters and ETH/USDT as base symbol, the strategy shows good backtest results on symbols like DENT/USDT, BTT/USDT, FTT/USDT, DOT/USDT etc. This makes sense as ETH is quite influential in crypto markets so many cryptos tend to follow ETH's major movements.
Note: The strategy with default parameters is intended for 4h timeframe. On other timeframes, try different support length.
How The Strategy Works
A WMA is calculated on the base symbol, with length 200 by default.
When WMA is rising, go long. When falling go short.
TakeProfit for Long/Short and StopLoss for Long/Short are calculated percentages so 0.05 = 5% etc. Also, TakeProfit/StopLoss are calculated on the base symbol not chart's symbol.
The strategy uses market orders for entry and exit based on following logic:
When WMA rising and no position, long entry
When WMA falling and no position, short entry
When long position profit >= TakeProfitLong percent, close long
When short position profit >= TakeProfitShort percent, close short
When long position loss >= StopLossLong percent, close long
When short position loss >= StopLossShort percent, close short
TakeProfit and StopLoss prices are updated in realtime based on base symbol price changes.
Advantage Analysis
The strategy is highly adaptable for use on multiple crypto currencies by tuning parameters.
Using Wall Street CCI to determine trend avoids noise-led wrong trades. CCI has lag in breakouts helping avoid false breakout losses.
Incorporating TakeProfit and StopLoss allows trend following while controlling loss per trade.
Fully automated trading without manual intervention allows 24/7 runtime.
Risk Analysis
Risk of target crypto price decoupling from base crypto, leading to failure of strategy. Can optimize by using multiple base cryptos and choosing the highest correlated one.
Risk of sudden volatility stopping out positions. Can adjust StopLoss percent or use trailing stops.
Risk of TakeProfit percent too small to capture sufficient trend gains. Can incorporate trend tracking or dynamic take profit.
Risk of false breakout leading to stop loss exit. Can tune CCI parameters or add re-entry logic.
Optimization Directions
Use correlation analysis across multiple base cryptos and combine indicators to reduce single base crypto risk.
Add trend tracking to dynamically adjust TakeProfit/StopLoss based on volatility.
Add staged stops to prevent extreme moves stopping out positions.
Add re-entry logic to avoid missing further trends after stop loss exit.
Optimize CCI parameters and settings to improve signal effectiveness.
Optimize parameters separately for each target crypto to improve adaptability.
Optimize position sizing based on account size.
Summary
Overall this is a typical trend following strategy. The core idea is to determine the trend direction of a benchmark crypto using Wall Street CCI and trade the target crypto accordingly. The strategy has some advantages but also risks to note. Further enhancements in tuning, trend tracking, risk control etc. can improve stability and profitability. In summary, the strategy provides ideas and reference for automated systematic crypto trading.
Parameters
| Name | Default | What it controls |
|---|---|---|
| v_input_int_1 | 200 | Support Length |
| v_input_1 | BTC_USDT:swap | Correlated Symbol |
| v_input_2_hlc3 | 0 | Price Source: hlc3 | high | low | open | hl2 | close | hlcc4 | ohlc4 |
| v_input_float_1 | 0.2 | Take Profit Long |
| v_input_float_2 | 0.15 | Take Profit Short |
| v_input_float_3 | 0.1 | Stop Loss Long |
| v_input_float_4 | 0.04 | Stop Loss Short |
| v_input_3 | timestamp(01 Jan 2016 00:00 +0000) | Start Time |
| v_input_4 | timestamp(31 Dec 2050 23:59 +0000) | End Time |
Source Pine Script
/*backtest
start: 2022-10-25 00:00:00
end: 2023-10-31 00:00:00
period: 1d
basePeriod: 1h
exchanges: [{"eid":"Futures_Binance","currency":"BTC_USDT"}]
*/

// This source code is subject to the terms of the Mozilla Public License 2.0 at https://mozilla.org/MPL/2.0/
// © levieux

//@version=5
strategy(title='Correlation Strategy', shorttitle='Correlation Strategy', initial_capital=1000, overlay=true, default_qty_type=strategy.percent_of_equity, default_qty_value=100, commission_type=strategy.commission.percent, commission_value=0.1)

supportLength = input.int(200, minval=1, title='Support Length')
supportSymbol = input('BTC_USDT:swap', title='Correlated Symbol')
supportSource = input(hlc3, title='Price Source')
takeprofitLong = input.float(0.2, 'Take Profit Long', step=0.01)
takeprofitShort = input.float(0.15, 'Take Profit Short', step=0.01)
stoplossLong = input.float(0.1, 'Stop Loss Long', step=0.01)
stoplossShort = input.float(0.04, 'Stop Loss Short', step=0.01)
start = input(defval = timestamp("01 Jan 2016 00:00 +0000"), title = "Start Time")
end = input(defval = timestamp("31 Dec 2050 23:59 +0000"), title = "End Time")

supportTicker = request.security(supportSymbol, timeframe.period, supportSource, lookahead=barmerge.lookahead_off)  //input(close, title="Source")
supportLine = ta.wma(supportTicker, supportLength)

window() => true

if not window()
    strategy.cancel_all()

supportLongPrice = close
supportShortPrice = close

if strategy.position_size > 0
    supportLongPrice := supportLongPrice[1]
if strategy.position_size < 0
    supportShortPrice := supportShortPrice[1]

longCondition = ta.rising(supportLine, 5) and window() and strategy.position_size <= 0
shortCondition = ta.falling(supportLine, 5) and window() and window() and strategy.position_size > 0
takeprofitLongCondition = takeprofitLong > 0 and window() and strategy.position_size > 0 and supportTicker > supportLongPrice * (1 + takeprofitLong)
stoplossLongCondition = stoplossLong > 0 and window() and strategy.position_size > 0 and supportTicker < supportLongPrice * (1 - stoplossLong)
takeprofitShortCondition = takeprofitShort > 0 and window() and strategy.position_size < 0 and supportTicker > supportShortPrice * (1 + takeprofitShort)
stoplossShortCondition = stoplossShort > 0 and window() and strategy.position_size < 0 and supportTicker < supportShortPrice * (1 - stoplossShort)

if longCondition
    strategy.entry('Long', strategy.long)
    supportLongPrice := supportTicker

if shortCondition
    strategy.entry('Short', strategy.short)
    supportShortPrice := supportTicker

if takeprofitLongCondition
    strategy.close('Long')
if stoplossLongCondition
    strategy.close('Long')
if takeprofitShortCondition
    strategy.close('Short')
if stoplossShortCondition
    strategy.close('Short')

///////////////////
// MONTHLY TABLE //

new_month = month(time) != month(time[1])
new_year  = year(time)  != year(time[1])

eq = strategy.equity

bar_pnl = eq / eq[1] - 1
bar_bh = (close-close[1])/close[1]

cur_month_pnl = 0.0
cur_year_pnl  = 0.0
cur_month_bh = 0.0
cur_year_bh  = 0.0

// Current Monthly P&L
cur_month_pnl := new_month ? 0.0 :
                 (1 + cur_month_pnl[1]) * (1 + bar_pnl) - 1
cur_month_bh := new_month ? 0.0 :
                 (1 + cur_month_bh[1]) * (1 + bar_bh) - 1

// Current Yearly P&L
cur_year_pnl := new_year ? 0.0 :
                 (1 + cur_year_pnl[1]) * (1 + bar_pnl) - 1
cur_year_bh := new_year ? 0.0 :
                 (1 + cur_year_bh[1]) * (1 + bar_bh) - 1

// Arrays to store Yearly and Monthly P&Ls
var month_pnl  = array.new_float(0)
var month_time = array.new_int(0)
var month_bh  = array.new_float(0)

var year_pnl  = array.new_float(0)
var year_time = array.new_int(0)
var year_bh  = array.new_float(0)

end_time = false

end_time:= time_close + (time_close - time_close[1]) > timenow or barstate.islastconfirmedhistory

if (not na(cur_month_pnl[1]) and (new_month or end_time))
    if (end_time[1])
        array.pop(month_pnl)
        array.pop(month_time)

    array.push(month_pnl , cur_month_pnl[1])
    array.push(month_time, time[1])
    array.push(month_bh , cur_month_bh[1])

if (not na(cur_year_pnl[1]) and (new_year or end_time))
    if (end_time[1])
        array.pop(year_pnl)
        array.pop(year_time)

    array.push(year_pnl , cur_year_pnl[1])
    array.push(year_time, time[1])
    array.push(year_bh , cur_year_bh[1])

// Monthly P&L Table
var monthly_table = table(na)

getCellColor(pnl, bh)  =>
    if pnl > 0
        if bh < 0 or pnl > 2 * bh
            color.new(color.green, transp = 20)
        else if pnl > bh
            color.new(color.green, transp = 50)
        else
            color.new(color.green, transp = 80)
    else
        if bh > 0 or pnl < 2 * bh
            color.new(color.red, transp = 20)
        else if pnl < bh
            color.new(color.red, transp = 50)
        else
            color.new(color.red, transp = 80)

if end_time
    monthly_table := table.new(position.bottom_right, columns = 14, rows = array.size(year_pnl) + 1, border_width = 1)

    table.cell(monthly_table, 0,  0, "",     bgcolor = #cccccc)
    table.cell(monthly_table, 1,  0, "Jan",  bgcolor = #cccccc)
    table.cell(monthly_table, 2,  0, "Feb",  bgcolor = #cccccc)
    table.cell(monthly_table, 3,  0, "Mar",  bgcolor = #cccccc)
    table.cell(monthly_table, 4,  0, "Apr",  bgcolor = #cccccc)
    table.cell(monthly_table, 5,  0, "May",  bgcolor = #cccccc)
    table.cell(monthly_table, 6,  0, "Jun",  bgcolor = #cccccc)
    table.cell(monthly_table, 7,  0, "Jul",  bgcolor = #cccccc)
    table.cell(monthly_table, 8,  0, "Aug",  bgcolor = #cccccc)
    table.cell(monthly_table, 9,  0, "Sep",  bgcolor = #cccccc)
    table.cell(monthly_table, 10, 0, "Oct",  bgcolor = #cccccc)
    table.cell(monthly_table, 11, 0, "Nov",  bgcolor = #cccccc)
    table.cell(monthly_table, 12, 0, "Dec",  bgcolor = #cccccc)
    table.cell(monthly_table, 13, 0, "Year", bgcolor = #999999)


    for yi = 0 to array.size(year_pnl) - 1
        table.cell(monthly_table, 0,  yi + 1, str.tostring(year(array.get(year_time, yi))), bgcolor = #cccccc)

        y_color = getCellColor(array.get(year_pnl, yi), array.get(year_bh, yi))
        table.cell(monthly_table, 13, yi + 1, str.tostring(math.round(array.get(year_pnl, yi) * 100)) + " (" + str.tostring(math.round(array.get(year_bh, yi) * 100)) + ")", bgcolor = y_color)

    for mi = 0 to array.size(month_time) - 1
        m_row   = year(array.get(month_time, mi))  - year(array.get(year_time, 0)) + 1
        m_col   = month(array.get(month_time, mi))
        m_color = getCellColor(array.get(month_pnl, mi), array.get(month_bh, mi))

table.cell(monthly_table, m_col, m_row, str.tostring(math.round(array.get(month_pnl, mi) * 100)) + " (" + str.tostring(math.round(array.get(month_bh, mi) * 100)) +")", bgcolor = m_color)Published by ChaoZhang on the FMZ strategy square · last modified 2023-11-01. Collected in the Quant Trading Vault. Unvalidated research: re-test with your own data and costs before trusting it.
Build this with AgenKit
A spec is not a trading system. Paste this into your coding agent and AgenKit runs a specialist team — architecture, test-first build, risk gates, review — with paper trading on by default.
/agenkit build a production-grade trading bot with a backtest engine, risk controls and paper trading by default from strategies/Correlation-based-Bullish-Bearish-Crypto-Trading-Strategy-Based-on-Wall-Street-CCI-Index.md- npx agenkit install engineering-kit in your project
- Paste the command into your agent and approve each phase
- Get tests, backtest, risk controls and a paper-trading switch
Understand it first
Before you run this, read the lesson behind the idea and how to backtest it honestly. Specs like this one are the survivors of an unknown number of trials; deflate their results accordingly.
Related specs
- Reverse Mean Breakthrough StrategyPine Script · Breakout · 3m
- GetString Momentum Breakthrough StrategyPine Script · Breakout · 3m
- CCI Strong Breakthrough StrategyPine Script · Breakout · 1d
- Choppiness K line Breakthrough StrategyPine Script · Breakout · 2h
- Price Action Structural Breakout Strategy with Trailing StopPine Script · Breakout · 2m
- Bollinger Bands Standard Deviation Breakout Strategy 432809Pine Script · Breakout · 1m