Strategy vault / Mean reversion
CRSI Moving Average Strategy
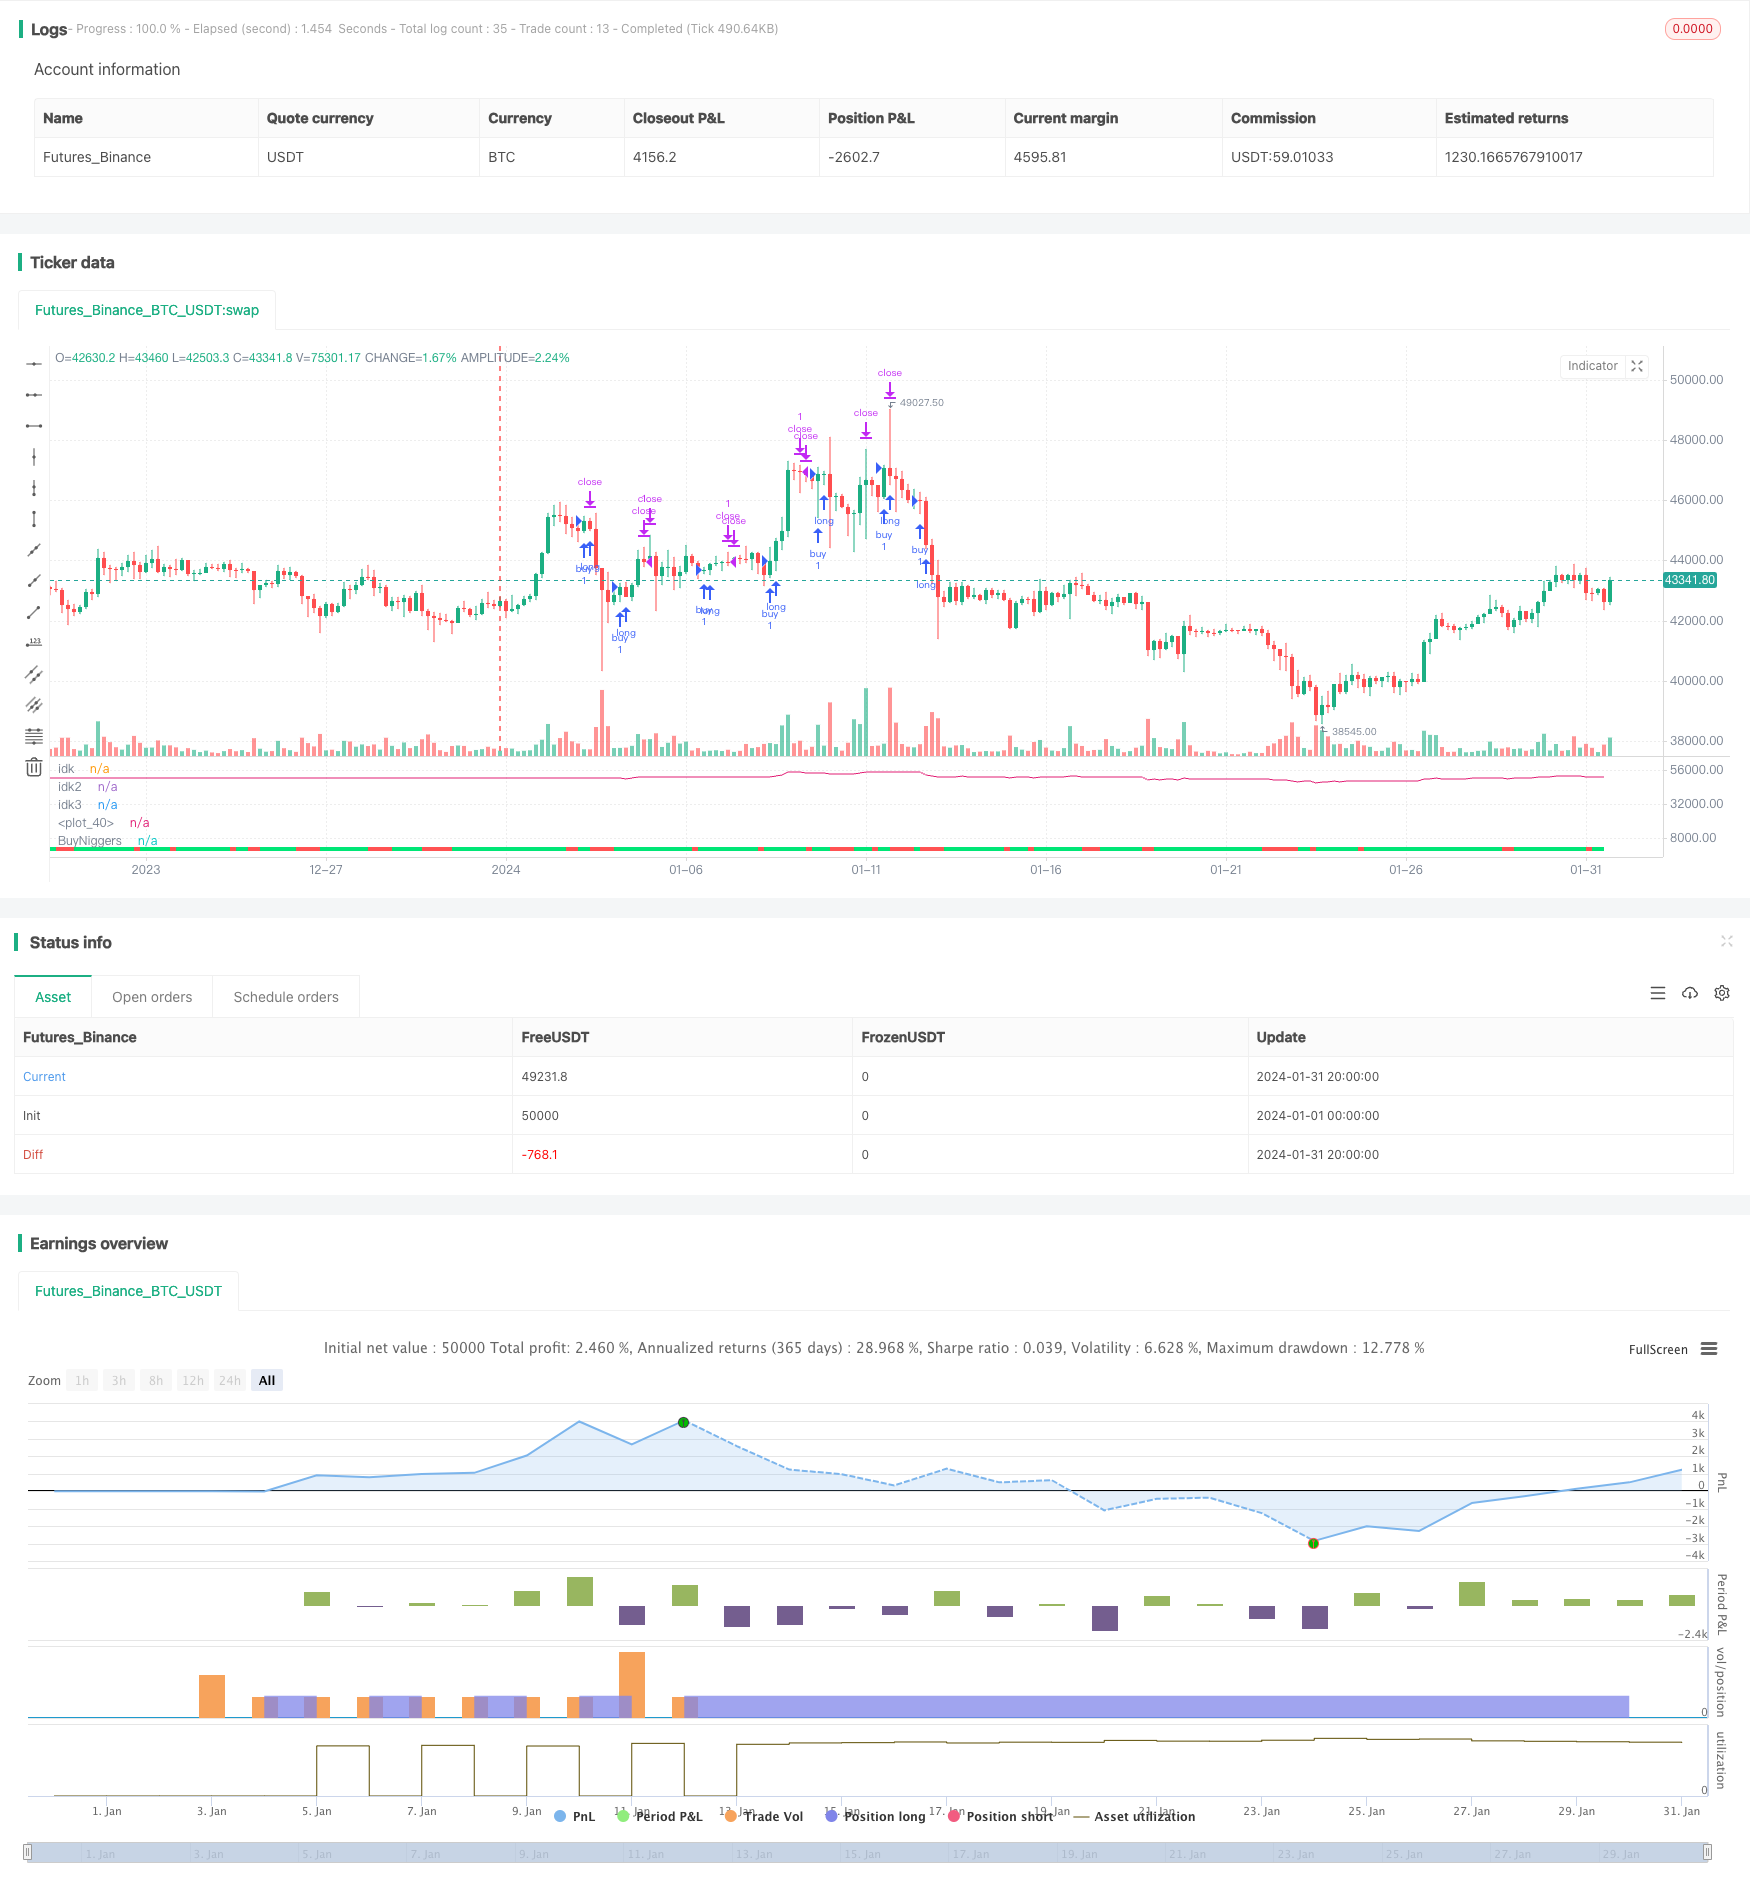
This strategy constructs a custom composite indicator CRSI by taking the average of RSI, bull/bear power and price rate of change percentage rank, and trades based on the moving average of CRSI crossing fixed levels.
Overview
This strategy constructs a custom composite indicator CRSI by taking the average of RSI, bull/bear power and price rate of change percentage rank, and trades based on the moving average of CRSI crossing fixed levels.
Strategy Logic
The strategy first calculates the 3-day RSI of price to gauge whether price is overbought or oversold. Meanwhile, it calculates the bull/bear power of price to judge the momentum. It also calculates the percentage rank of price rate of change (ROC) to check the relative speed of price change. Then it takes the mean of these three indicators to construct a custom composite indicator CRSI, which reflects the overall condition of price. Finally it calculates the 2-day simple moving average (MA) of CRSI. When MA crosses above the level of 40, it goes long. When MA crosses below the level of 70, it exits long positions.
Advantage Analysis
This strategy combines multiple indicators to construct the custom CRSI indicator, making trading signals more reliable. RSI can tell whether price is overheated or oversold. Bull/bear power can judge the momentum. ROC checks how fast price is changing. Combining them together into CRSI makes trading signals more comprehensive and reliable. Additionally, the use of MA also helps filter out false signals.
Risk Analysis
Although this strategy uses multiple indicators for a combo, it still risks generating false signals in certain market conditions. For instance, in range-bound markets, RSI, ROC and other indicators may produce frequent buy and sell signals while actually price has no clear trend. Or some indicators may lag and delay generating trading signals after a sudden event happens. These situations can cause losses. The risks could be reduced by optimizing parameters or adding other filtering conditions.
Optimization Directions
Here are some aspects that could optimize this strategy: 1) Optimize the parameters of RSI, bull/bear power and ROC to make CRSI more steady and reliable; 2) Add other auxiliary indicators like KDJ, MACD into the combo for more comprehensive signals; 3) Optimize the MA parameters to lower the delay risk; 4) Add stop loss conditions to control single loss; 5) Incorporate longer-term indicators to judge trend status, avoiding overtrading in range-bound markets.
Conclusion
This strategy constructs a custom indicator CRSI based on the mean of RSI, bull/bear power and ROC, and trades on the MA of CRSI crossing fixed levels. Such a multi-indicator combo can make trading signals more stable and reliable. But this strategy still calls for further optimization on parameters, auxiliary indicators and filtering conditions to reduce false signals and the impacts of market regimes, so as to improve steady profitability.
Source Pine Script
/*backtest
start: 2024-01-01 00:00:00
end: 2024-01-31 23:59:59
period: 4h
basePeriod: 15m
exchanges: [{"eid":"Futures_Binance","currency":"BTC_USDT"}]
*/

//@version=3
src = close, lenrsi = 3, lenupdown = 2, lenroc = 100, malengt = 2, low = 40, high = 70, a = 1, vlow = 20
updown(s) =>
    isEqual = s == s[1]
    isGrowing = s > s[1]
    ud = 0.0
    ud := isEqual ? 0 : isGrowing ? (nz(ud[1]) <= 0 ? 1 : nz(ud[1])+1) : (nz(ud[1]) >= 0 ? -1 : nz(ud[1])-1)
    ud
rsi = rsi(src, lenrsi)
updownrsi = rsi(updown(src), lenupdown)
percentrank = percentrank(roc(src, 1), lenroc)
crsi = avg(rsi, updownrsi, percentrank)
MA = sma(crsi, malengt)

band1 = 70
band0 = 40
band2 = 20

ColorMA = MA>=band0 ? lime : red

p1 = plot(MA, title="BuyNiggers", style=line, linewidth=4, color=ColorMA)

p2 = plot(low, title="idk", style=line, linewidth=2, color=blue)
p3 = plot(high, title="idk2", style=line, linewidth=2, color=orange)
p4 = plot(vlow, title="idk3", style=line, linewidth=1, color=red)

//@version=2
strategy("CMARSI")


if crossover(MA, band0)
    strategy.entry("buy", strategy.long, 1, when=strategy.position_size <= 0)

if crossunder(MA, band1)
    strategy.exit("close", "buy",  1, profit=1, stop=1)


plot(strategy.equity)
Published by ChaoZhang on the FMZ strategy square · last modified 2024-02-02. Collected in the Quant Trading Vault. Unvalidated research: re-test with your own data and costs before trusting it.
Build this with AgenKit
A spec is not a trading system. Paste this into your coding agent and AgenKit runs a specialist team — architecture, test-first build, risk gates, review — with paper trading on by default.
/agenkit build a production-grade trading bot with a backtest engine, risk controls and paper trading by default from strategies/CRSI-Moving-Average-Strategy.md- npx agenkit install engineering-kit in your project
- Paste the command into your agent and approve each phase
- Get tests, backtest, risk controls and a paper-trading switch
Understand it first
Before you run this, read the lesson behind the idea and how to backtest it honestly. Specs like this one are the survivors of an unknown number of trials; deflate their results accordingly.
Related specs
- Advanced 15 Minute Chart Trading Signal StrategyPine Script · Mean reversion · 3h
- BONK Multi Factor Trading StrategyPine Script · Mean reversion · 1d
- Customizable Non Repainting HTF MACD MFI Scalable Bot StrategyPine Script · Mean reversion · 1d
- Dynamic Adaptive Multi Timeframe Trend Following and Range Reversal Hybrid StrategyPine Script · Mean reversion · 2d
- MACD Cross Period Trading StrategyPine Script · Mean reversion · 1d
- MACD Long Reversal StrategyPine Script · Mean reversion · 1d