Strategy vault / DCA & fixed investment
Daily DCA Strategy with Touching EMAs
This Pine script strategy implements a daily dollar-cost averaging approach on the TradingView platform, incorporating EMA touch signals to determine entry points. It follows the dollar-cost averaging methodology to…
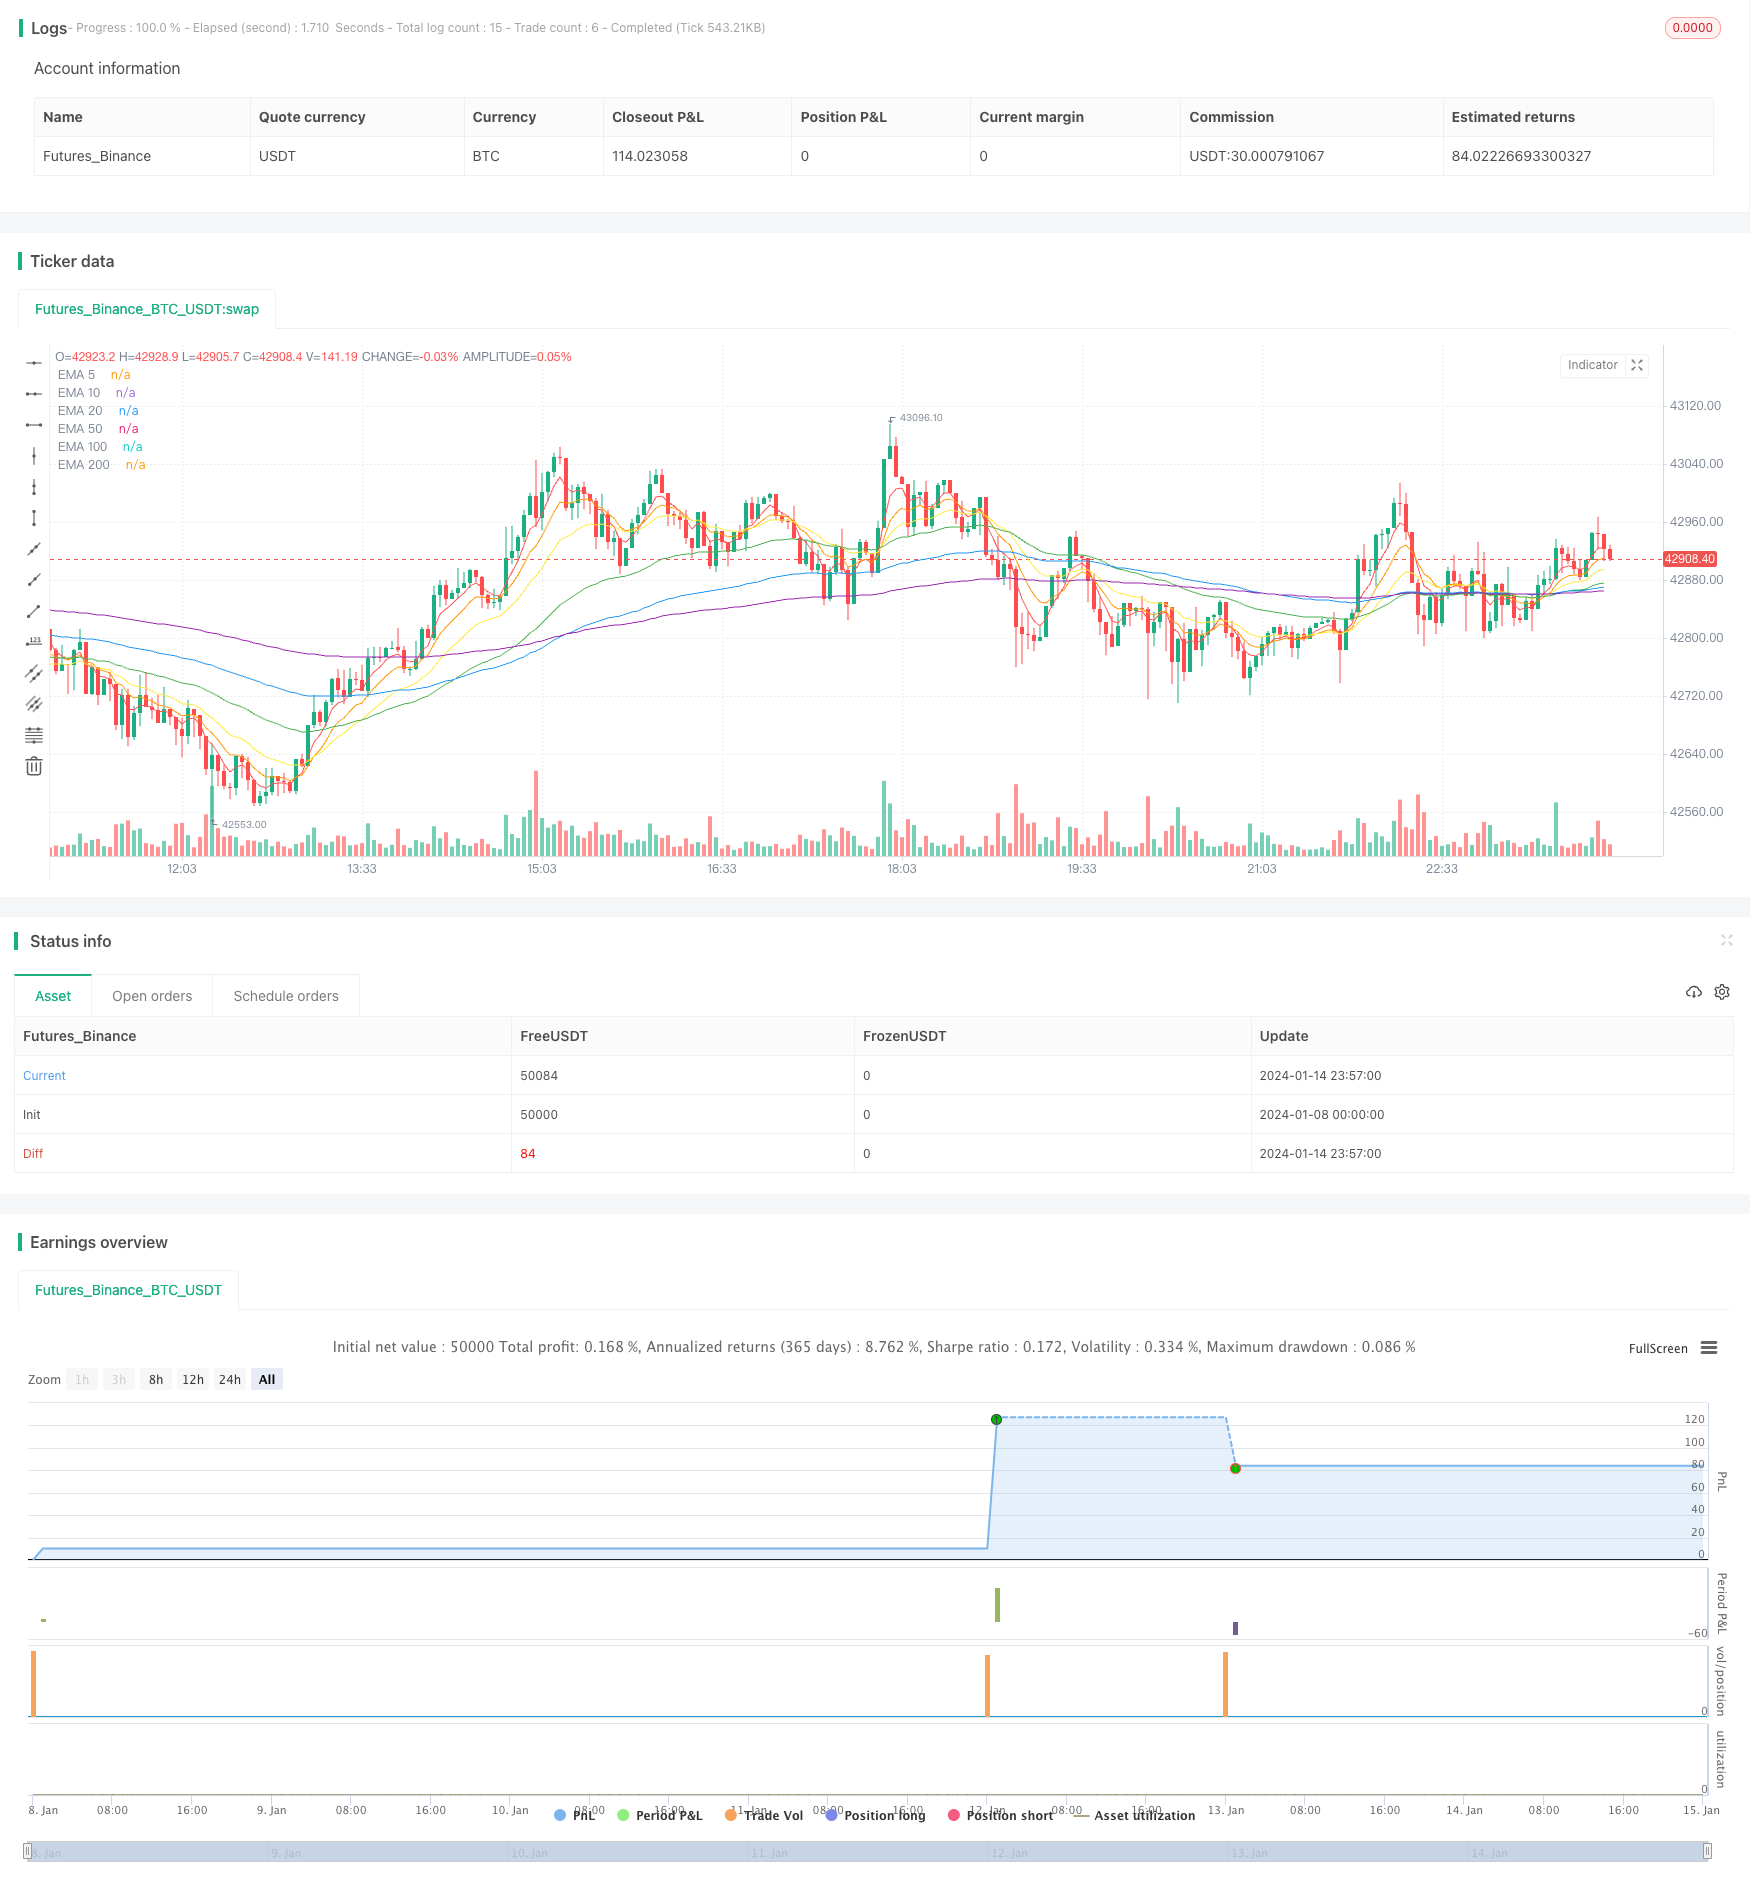
Overview
This Pine script strategy implements a daily dollar-cost averaging approach on the TradingView platform, incorporating EMA touch signals to determine entry points. It follows the dollar-cost averaging methodology to make fixed-amount investments every day, spreading purchases over time to mitigate risk. The EMA crossovers then serve as the specific trigger for entries.
Strategy Logic
The strategy has the following key features:
Daily Dollar-Cost Averaging
- Fixed daily investment regardless of market ups and downs
- Long-term batch investments to reduce single-trade risk
EMAs for Entry Signals
- Buy signal triggered when closing price crosses above EMA 5, 10, 20 etc.
- EMA lines serve as support to avoid short-term pullbacks
Dynamic Stop Loss
- Sell all positions if closing price falls below 20-day SMA
- Avoid further losses
Trade Count Limit
- Caps max trades at 300 to control position sizing
- Prevents over-investment beyond asset capacity
Specifically, every day the strategy invests a fixed amount and calculates the shares to buy based on the closing price. If the closing price crosses above any of the 5-, 10-, 20-day EMA etc., a buy signal is triggered. Once the accumulated trade count hits the 300 limit, no further buys will occur. Additionally, if the price closes below the 20-day SMA or reaches the preset exit date, all positions are cleared. The script also plots the EMAs on the price chart for visual analysis.
Advantage Analysis
The advantages of this strategy include:
Risk Diversification
- Small fixed-amount daily investments regardless of market trends
- Avoids chasing highs
EMA Combination Avoids Pullbacks
- EMA crossovers prevent buying into pullback periods
- Continued buying during pullbacks diversifies risk
Dynamic Stop Loss Controls Losses
- Stop loss allows timely exits
- Prevents heavy losses
Trade Limit Controls Risks
- Max position size is preset to prevent over-investment
- Keeps investment within asset capacity
Intuitive EMA Visualization
- EMAs plotted on price chart
- Allows easy monitoring by operator
Highly Customizable
- Custom inputs for investment amount, EMA periods, stops etc.
- Adjusts based on personal risk preferences
Risk Analysis
The strategy also carries some risks to note:
Systemic Risks Still Exist
- Black swan events can lead to heavy losses
- Diversification only reduces but don't eliminate risks
Fixed Investment Amount
- Fixed daily investments could miss out on upside if prices surge
- Dynamic amount adjustment could help
EMAs Cannot React to Extreme Moves
- EMAs have slower reaction to sudden events and fails to stop loss in time
- Combining with KD, BOLL may help identify extremes
Trade Limit Caps Profit Potential
- Upper limit on trades caps possible gains
- Need to balance risks and rewards
Stop Loss Placement Requires Care
- Stops too close tend to get taken out prematurely while stops too loose fails to protect in time
- Extensive testing needed to find the right balance
Future Enhancements
Further optimizations:
Dynamic Daily Investment Amount
- Base daily investments on indicators
- Increase when bullish, decrease when bearish
Additional Entry Signals
- Complement EMA with other indicators like KD, BOLL
- Improve identification of extreme moves
Exponential Moving Averages
- EMAs react slowly to sudden events, DEMA, TEMA may help
- Faster capture of new trends
Dynamic Position Limit
- Increase limit based on strategy profitability
- Allows higher exposure at fair valuations
Trailing Stop Loss
- Current strategy market sells all, trailing stops could help avoid gaps down
- Reduce risk of stops being "run"
Conclusion
In summary, this EMA-combined daily DCA strategy realizes the concept of long-term periodic investments, spreading risks across multiple small entries compared to large one-time purchases. The EMAs help avoid short-term pullback risks to a certain extent, while the stop loss controls max loss. Still, black swan risks and the limitations of fixed investment size need to be kept in mind. These aspects provide future enhancement directions through parameter tuning and indicator combinations for building efficient yet stable quant strategies.
Parameters
| Name | Default | What it controls |
|---|---|---|
| v_input_1 | 50000 | Daily Investment |
| v_input_2 | 2022 | Start Year |
| v_input_3 | true | Start Month |
| v_input_4 | true | Start Day |
| v_input_5 | 2023 | End Year |
| v_input_6 | 12 | End Month |
| v_input_7 | true | End Day |
| v_input_8 | 10000 | Pyramiding Limit |
| v_input_9 | true | Enable Sell |
Source Pine Script
/*backtest
start: 2024-01-08 00:00:00
end: 2024-01-15 00:00:00
period: 3m
basePeriod: 1m
exchanges: [{"eid":"Futures_Binance","currency":"BTC_USDT"}]
*/

//@version=4
strategy("Daily DCA Strategy with Touching EMAs", overlay=true, pyramiding=10000)

// Customizable Parameters
daily_investment = input(50000, title="Daily Investment")
start_year = input(2022, title="Start Year")
start_month = input(1, title="Start Month")
start_day = input(1, title="Start Day")
end_year = input(2023, title="End Year")
end_month = input(12, title="End Month")
end_day = input(1, title="End Day")
trade_count_limit = input(10000, title="Pyramiding Limit")
enable_sell = input(true, title="Enable Sell")

start_date = timestamp(start_year, start_month, start_day)
var int trade_count = 0

// Calculate the number of shares to buy based on the current closing price
shares_to_buy = daily_investment / close

// Check if a new day has started and after the start date
isNewDay = dayofmonth != dayofmonth[1] and time >= start_date

// Buy conditions based on EMA crossovers
ema5_cross_above = crossover(close, ema(close, 5))
ema10_cross_above = crossover(close, ema(close, 10))
ema20_cross_above = crossover(close, ema(close, 20))
ema50_cross_above = crossover(close, ema(close, 50))
ema100_cross_above = crossover(close, ema(close, 100))
ema200_cross_above = crossover(close, ema(close, 200))

if isNewDay and (ema5_cross_above or ema10_cross_above or ema20_cross_above or ema50_cross_above or ema100_cross_above or ema200_cross_above) and trade_count < trade_count_limit
    strategy.entry("Buy", strategy.long, qty=shares_to_buy)
    trade_count := trade_count + 1

// Dynamic sell conditions (optional)
sell_condition =  true

if enable_sell and sell_condition
    strategy.close_all()

// EMA Ribbon for visualization
plot(ema(close, 5), color=color.red, title="EMA 5")
plot(ema(close, 10), color=color.orange, title="EMA 10")
plot(ema(close, 20), color=color.yellow, title="EMA 20")
plot(ema(close, 50), color=color.green, title="EMA 50")
plot(ema(close, 100), color=color.blue, title="EMA 100")
plot(ema(close, 200), color=color.purple, title="EMA 200")
Published by ChaoZhang on the FMZ strategy square · last modified 2024-01-16. Collected in the Quant Trading Vault. Unvalidated research: re-test with your own data and costs before trusting it.
Build this with AgenKit
A spec is not a trading system. Paste this into your coding agent and AgenKit runs a specialist team — architecture, test-first build, risk gates, review — with paper trading on by default.
/agenkit build a production-grade trading bot with a backtest engine, risk controls and paper trading by default from strategies/Daily-DCA-Strategy-with-Touching-EMAs.md- npx agenkit install engineering-kit in your project
- Paste the command into your agent and approve each phase
- Get tests, backtest, risk controls and a paper-trading switch
Understand it first
Before you run this, read the lesson behind the idea and how to backtest it honestly. Specs like this one are the survivors of an unknown number of trials; deflate their results accordingly.
Related specs
- Quantized Gradual Weighted DCA Trading StrategyPine Script · DCA & fixed investment · 1d
- Mean Reversion Bollinger Band Dollar Cost Averaging Investment StrategyPine Script · DCA & fixed investment · 1d
- Intelligent Wave Trend Dollar Cost Averaging Cyclical Trading StrategyPine Script · DCA & fixed investment · 1h
- Multi Indicator Confirmation EMA Breakout with DCA and Dynamic Take Profit StrategyPine Script · DCA & fixed investment · 1d
- Bollinger Band and RSI Mixing with DCA StrategyPine Script · DCA & fixed investment · 1d
- DCA Dual Moving Average Turtle Trading StrategyPine Script · DCA & fixed investment · 10m