DEMA Volatility Index Strategy
This strategy uses Double Exponential Moving Average (DEMA) to calculate price volatility, and further smoothes the volatility to detect trends in price fluctuations, going long when volatility rises and short when…
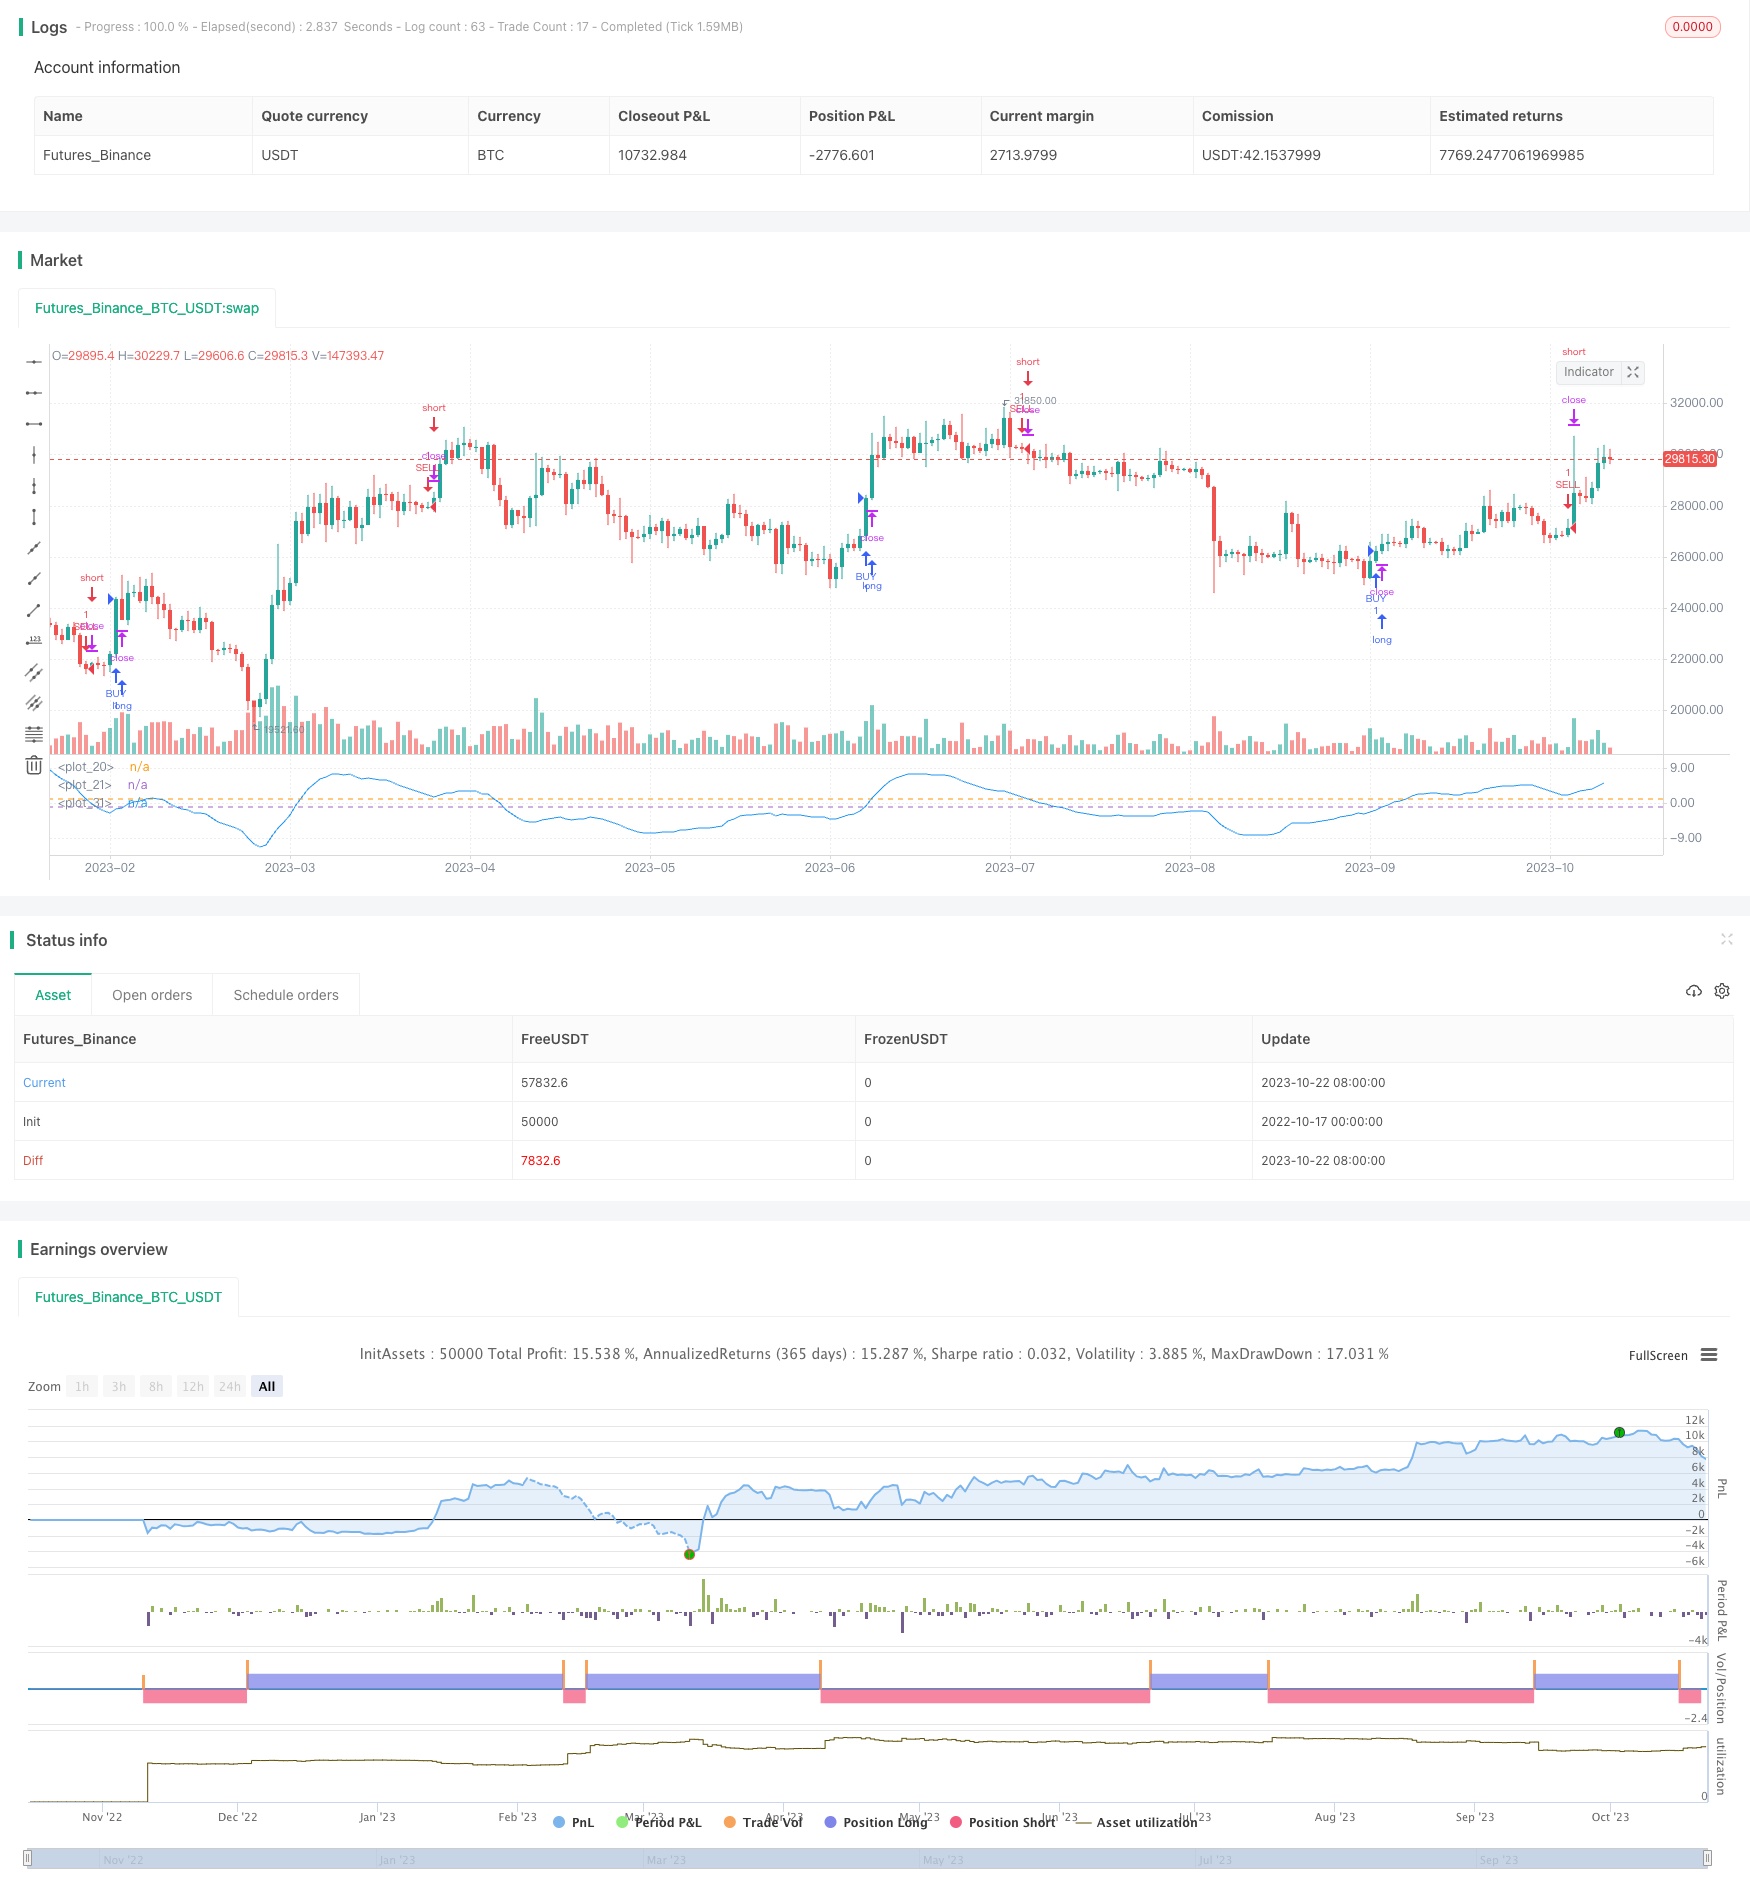
Overview
This strategy uses Double Exponential Moving Average (DEMA) to calculate price volatility, and further smoothes the volatility to detect trends in price fluctuations, going long when volatility rises and short when volatility falls.
Strategy Logic
Calculate Double Exponential Moving Average (DEMA) of price, formula: DEMA = 2*EMA(price, N) - EMA(EMA(price, N), N)
Calculate price volatility relative to DEMA: Volatility = (price - DEMA) / price * 100%
Apply DEMA smoothing on volatility again to get trend signal of volatility
When smoothed volatility crosses above a level, go long. When it crosses below, go short.
Can set to trade only during specific time period.
Advantages
DEMA catches trend changes faster than simple moving averages.
Volatility reflects market sentiment, rise in volatility represents dominance of bulls, fall represents bears.
Smoothing volatility filters out short-term noise and captures major trend.
Trading in specific time periods avoids unnecessary slippage costs.
Stop loss and exit strategies control risk.
Risks
DEMA may lag during strong trends, missing best entry points.
Volatility index may give false signals, should combine with other indicators.
Should set stop loss to prevent magnified losses.
Missing opportunities outside trading time period.
Trading time period needs testing on historical data, improper time may reduce profits.
Risk Management
Optimize DEMA parameters, use smaller N values.
Combine other indicators like RSI, MACD for confirmation.
Set stop loss based on historical data and maximum tolerable loss.
Optimize trading time period selection.
Test optimal trading times separately for different products.
Enhancement Opportunities
Test different DEMA parameter combinations for best smoothing.
Try other moving averages like EMA, SMA.
Additional smoothing of volatility with different parameters.
Add other indicators for multi-factor verification.
Use machine learning to auto-optimize entry and exit parameters.
Test optimal parameters separately for different products.
Add stop loss and exit strategies to control risk.
Summary
This strategy captures trend changes in market sentiment by calculating smoothed DEMA volatility, going long when volatility rises and short when it falls. But DEMA lag and false signals are risks. Parameters should be optimized, strict stop loss implemented, and other indicators combined for confirmation. If used properly, this strategy can catch trend reversals and provide good investment returns.
Parameters
| Name | Default | What it controls |
|---|---|---|
| v_input_1 | -2 | buyper |
| v_input_2 | 2 | sellper |
| v_input_3 | 50 | Dema Length |
| v_input_4 | true | Band for OverBought |
| v_input_5 | -1 | Band for OverSold |
| v_input_6 | 21 | DEMA to Calculate dema of DPD |
| v_input_7 | 2018 | yearfrom |
| v_input_8 | 2019 | yearuntil |
| v_input_9 | 6 | monthfrom |
| v_input_10 | 12 | monthuntil |
| v_input_11 | true | dayfrom |
| v_input_12 | 31 | dayuntil |
Source Pine Script
/*backtest
start: 2022-10-17 00:00:00
end: 2023-10-23 00:00:00
period: 1d
basePeriod: 1h
exchanges: [{"eid":"Futures_Binance","currency":"BTC_USDT"}]
*/

//@version= 2
strategy("DEMA of DPD Strategy ",shorttitle="DPD% DEMA " ,overlay=false)

buyper =input(-2)
sellper=input(2)

demalen = input(50,title="Dema Length")

e1= ema(close,demalen)
e2=ema(e1,demalen)
demaprice  =   2 * e1 - e2

price=close
demadifper =  ((price-demaprice)/price)*100


OverDemaPer = input(1, title="Band for OverBought")
UnderDemaPer= input(-1,title="Band for OverSold")

band1 = hline(OverDemaPer)
band0 = hline(UnderDemaPer)
zeroline=0
fill(band1, band0, color=green, transp=90)


demalen2 = input(21,title="DEMA to Calculate dema of DPD")
demaofdpd =ema(demadifper,demalen2)
demaofdpd2 =ema(demaofdpd,demalen2)
resultstrategy = 2*demaofdpd - demaofdpd2

plot(resultstrategy,color=blue)


yearfrom = input(2018)
yearuntil =input(2019)
monthfrom =input(6)
monthuntil =input(12)
dayfrom=input(1)
dayuntil=input(31)


if (  crossover(resultstrategy,buyper)  )
    strategy.entry("BUY", strategy.long, stop=close, oca_name="TREND",  comment="BUY")

else
    strategy.cancel(id="BUY")


if ( crossunder(resultstrategy,sellper) )

    strategy.entry("SELL", strategy.short,stop=close, oca_name="TREND",  comment="SELL")
else
    strategy.cancel(id="SELL")
Published by ChaoZhang on the FMZ strategy square · last modified 2023-10-24. Collected in the Quant Trading Vault. Unvalidated research: re-test with your own data and costs before trusting it.
Build this with AgenKit
A spec is not a trading system. Paste this into your coding agent and AgenKit runs a specialist team — architecture, test-first build, risk gates, review — with paper trading on by default.
/agenkit build a production-grade trading bot with a backtest engine, risk controls and paper trading by default from strategies/DEMA-Volatility-Index-Strategy.md- npx agenkit install engineering-kit in your project
- Paste the command into your agent and approve each phase
- Get tests, backtest, risk controls and a paper-trading switch
Understand it first
Before you run this, read the lesson behind the idea and how to backtest it honestly. Specs like this one are the survivors of an unknown number of trials; deflate their results accordingly.
Related specs
- Multi Indicator Dynamic Position Size Volatility Adaptive Quantitative Trading StrategyPine Script · Volatility · 1d
- Profit rate theory volatility index quantification strategyPine Script · Volatility · 3h
- Multi Indicator Dynamic Volatility Alert Trading SystemPine Script · Volatility · 1m
- Multi Indicator Volatility Trading RSI EMA ATR StrategyPine Script · Volatility · 3m
- Dynamic Volatility Trading System Multi Timeframe Nested Technical Indicator Strategy with Extreme Market Condition Monitoring for FuturesPine Script · Volatility · 1h
- Relative Volatility Index Backtesting StrategyPine Script · Volatility · 4h